3.1 Why does it [engineering] matter?
Let’s consider two recent examples of where data-driven systems and data analysis have gone dramatically ‘wrong’.
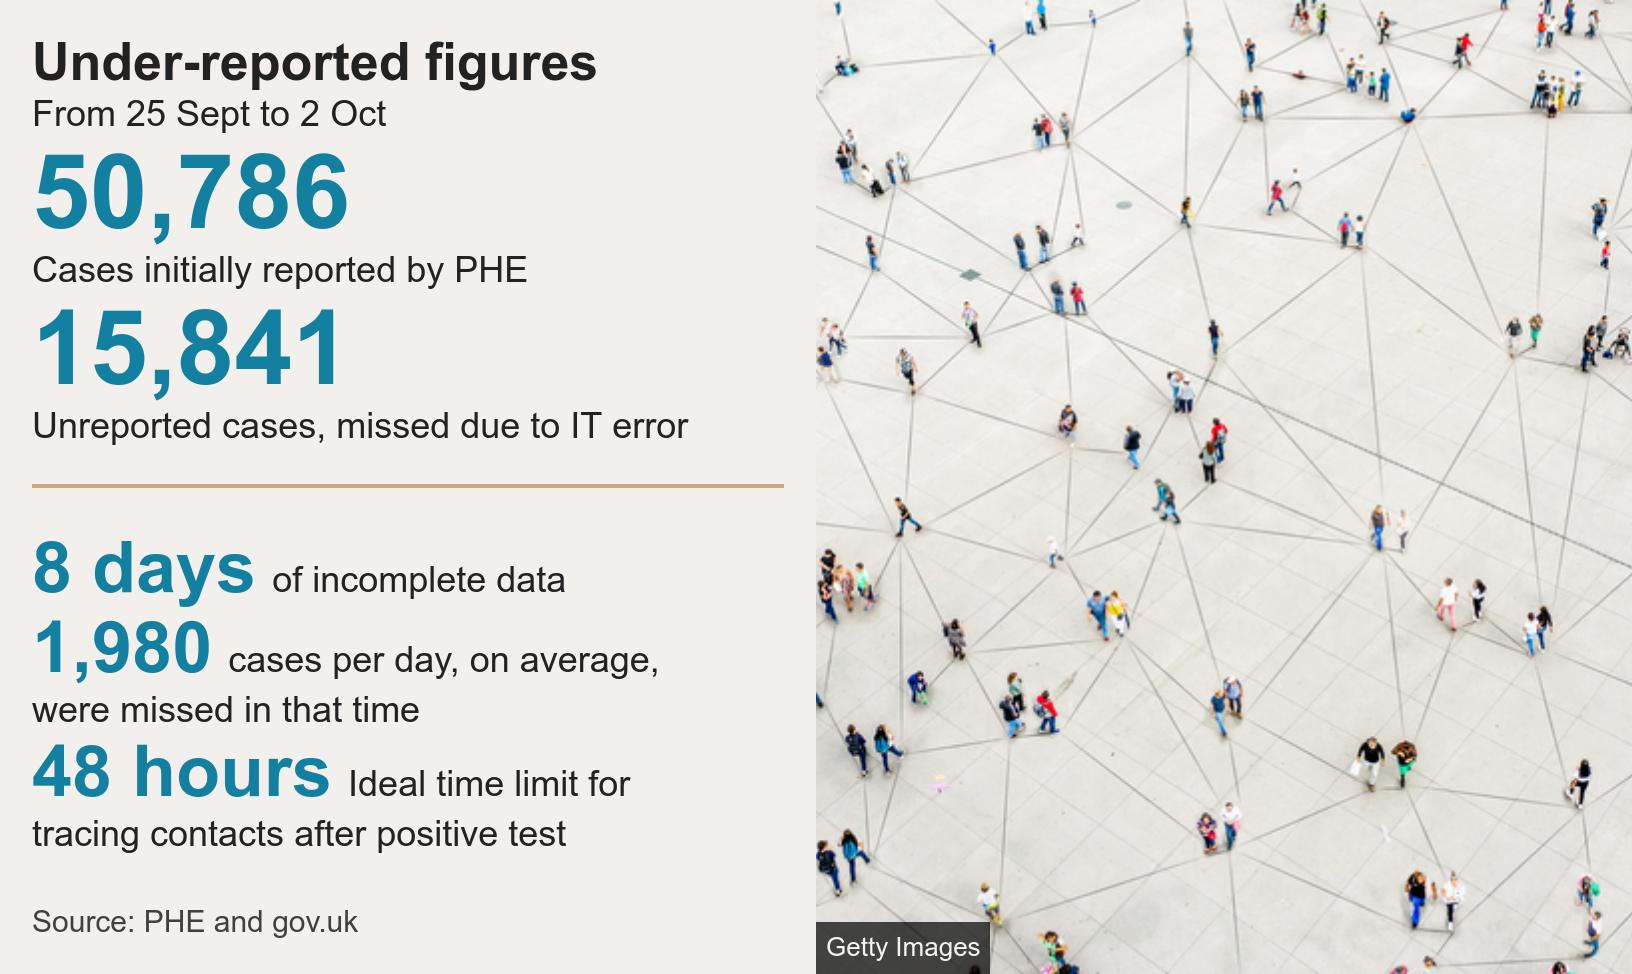
3.1.1 The NHS covid-19 ‘loss’ of 16000 cases
This case study has featured prominently in the UK news in early October, 2020. The background to this example is as follows:
- During the pandemic UK covid-19 testing labs submitted daily test reports to Public Health England (PHE) as simple .csv files.
- These files were then manually merged into Excel templates to upload to a central system.
- For the Excel documents the, now obsolete, .xls format (1986) was chosen.
- Unfortunately this has an upper limit of only ~65K rows.
- Each test result uses multiple rows, so in effect each template was limited to ~1.4K test cases.
- Once that limit was exceeded, further cases were simply left off without warning, hence the users were unaware that data were being lost.
As a consequence, over a period of 8 days the system ‘lost’ almost 16000 positive covid-19 test cases. These were not added to the Track and Trace system and therefore no attempt was made to warn close contacts of the positive test cases. This is likely to have negatively contributed to the spread of covid-19 as well as harmful outcomes to individuals unnecessarily infected.
So what should we make of this example? Below are a couple of quotations from software engineering experts.
analysts in the NHS should have known that their Test and Trace system was too data-rich to rely upon the manual use of Excel to record patient COVID-19 data …
– Darrin Baines, Bournemouth U.
Excel was always meant for people mucking around with a bunch of data for their small company to see what it looked like.
– Jon Crowcroft, U. of Cambridge
Their main message is that whilst Excel is a very useful tool it isn’t intended for health-critical, relatively high volume, production systems. So to use it in this way is an extremely risky decision.
In addition, it is hard to believe that thorough testing was undertaken or that the principles of defensive programming28 were employed, such as checking that the total of cases added centrally equalled the sum of the individual lists supplied by the individual testing facilities.
3.1.2 Audit of machine learning experiments
In an analysis of computational experiments (Shepperd et al. 2019) we undertook an audit of the methods and results to check for errors. These were all published in the scientific literature and therefore subject to peer review and were taken from the problem domain of using machine learning to predict faults in large software systems so as to guide where testing effort should be deployed.
- we analysed 49 scientific papers describing 2456 individual experimental results
- and found 22/49 (~45%) of the papers contain demonstrable errors
- the errors include transcription, calculation and statistical errors
However, not all errors are easy to detect, e.g., errors can cancel each other out or simply not be visible given the level of detail provided by a particular research paper, thus we speculate that 45% might be an underestimate. Given the ease with which it is possible for us (the author included) to make errors we recommend the use of methodical engineering methods (the subject of this chapter) and presenting sufficient information that the data cleaning and processing, analysis and presentation of results are all open to scrutiny. That way even if errors are made, there is an opportunity for others to spot and correct them.
3.1.3 Reproducible code
Often we talk about reproducibility and sometimes the replicability of a data analysis. Unfortunately these terms are occasionally used in different ways. I (and most people) mean reproducibility to be the property that somebody else could re-run your analysis using your data and come up with the same result. This would seem minimally necessary. Again it points us in the direction of needing a disciplined engineering approach.
Reproducibility: means that data and code for an analysis are shared so that others can produce the same results as reported i.e., avoidance of measurement, computational and analysis errors. To facilitate reproducibility it is also necessary that the steps of an analysis can be understood, e.g., our R Notebooks should help us understand both how and why we did things.
Replicability: in contrast to reproducibility, means if the study were repeated, but with a new sample (data) are the findings similar (although not necessarily exactly so).
Although one might hope that reproducible code would be some basic minimum standard for data scientists, in practice the reality is far from this. For example, Pimentel et al. (2019) in a massive empirical study of over 1.4 million Jupyter29 notebooks (available on GitHub), found that only 24% of the notebooks could be executed without error and only 4% produced the same results as originally claimed.
The Pimentel et al. (2019) study identified some good and other less good practices.
- Good practices
- literate programming aspects of notebooks
- application of abstractions
- descriptive filenames
- literate programming aspects of notebooks
- Bad practices
- untested code
- out-of-order cells [chunks], non-executed code cells
- possibility of hidden states e.g., carryover from previous execution
- untested code
Partly as a consequence, a survey of professional data scientists found that data scientists spend 19% of their time finding, understanding and accessing datasets, and a further 60% of their time cleaning and organizing these datasets to use in their studies (CrowdFlower 2016). Although these figures are only going to be approximate and may vary considerably due to context, they do highlight the timeconsuming nature of understanding and data cleaning.
3.1.4 Tips for more reproducible data analysis
- Preserve and keep your raw (unprocessed) data read only
- Manipulate data in a reproducible manner (i.e., write code, don’t hack it in Excel!)
- Dates, authors and versions
- The code is commented
- Format the code neatly (spaces/indentation etc)
- No extraneous code (e.g. early versions)
To facilitate reproducibility, it is also necessary that the steps of an analysis can be understood e.g., our R Notebooks should explain how and why we did things.
References
See for example (Zaidman 2004) for some examples which although in Java can easily be applied in R.↩︎
Jupyter notebooks serve a similar role to R Notebooks but in the Python ecosystem.↩︎