Structure of the guide
Chapter 1 introduces the concept of open source and explains which software and data are needed to use this guide. Chapters 2 and 3 describe the main steps for mapping building electricity consumption and calculating the renewable electricity potential of each rooftop. Both chapters provide a thorough explanation of how to use the available software and data. Chapter 4 introduces what is sampling and demonstrates and compares two different sampling methods to estimate the renewable electricity potential for the whole city. Chapter 5 presents the final results for Rosario and La Plata and the outputs after completing this guide.
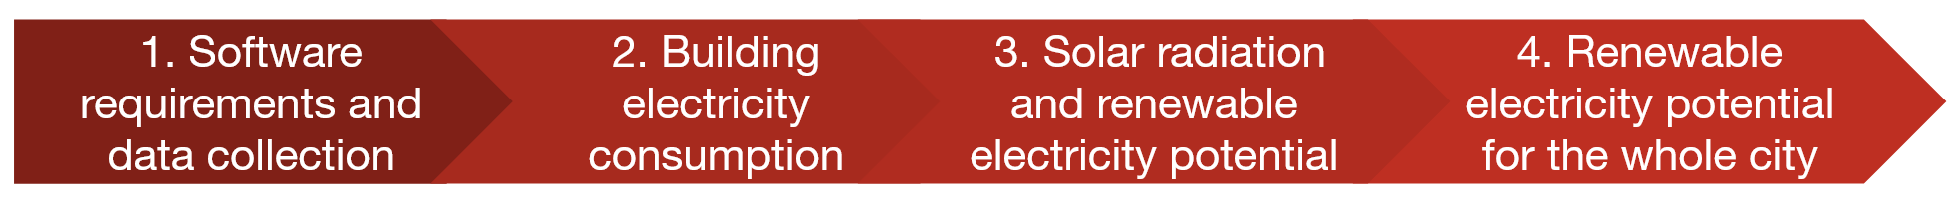
Figure 0.1: Chapters in the Guide
Data Requirements:
The following table describes the data required to complete this guide, in what format and from where it should be contributed or downloaded.
| Data description | Format | Source |
|---|---|---|
| Annual electricity consumption of municipal buildings | table format - excel, csv, etc. | City |
| Vector layer of the administrative borders of the city | shapefile or GeoJSON format | City |
| Vector layer of the buildings in the city | shapefile or GeoJSON format | OpenStreetMap (1.4) |
| Raster layer of global horizontal irradiation (GHI) | GeoTIFF, ASCII Grid, etc. | The Solar Global Atlas (1.5) |
| Raster layer of Land-Use Change and Land-Use Cover (LUCLCC) | GeoTIFF, ASCII Grid, etc. | Copernicus Land Monitoring Service global maps of land cover & cover changes and related surface area statistics (4.3) |