4.5 Comparison between sample results and sampling methods
Figure 4.32 presents the results of the different samples collected for the city of La Plata.
The most important parameters when comparing between sampling results are the \(SEM\) / \(SET\) and the confidence interval range.
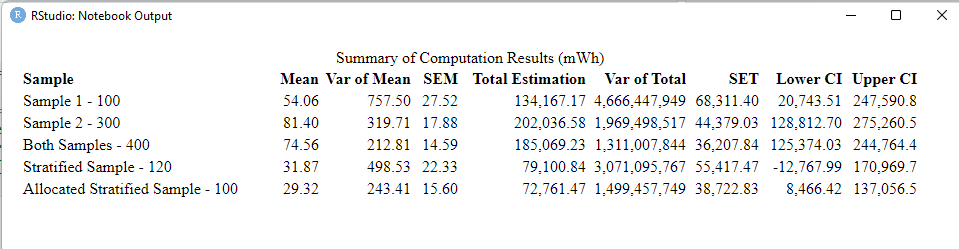
Figure 4.32: Summarizing Table of Sampling Results
In our results, we can see that the sample of 400 building rooftops had the lowest standard error estimation and a more narrow confidence interval range than the other samples. This means that the estimation of the total electric potential of this spatial random sample is our best estimate.
It is important to acknowledge that the optimal allocation sample also provided a low standard error estimation, this may indicate that if we increase our sample size we can have a better estimation of the total.