3.2 Extracting raster values to vector layers
Next, we would like to calculate the GHI for the building rooftops so we can translate the values to electricity. For this, we need to use the Zonal statistics algorithm. This algorithm Calculates statistics of a raster layer for each feature of an overlapping polygon vector layer adding the new statistics fields to it. First, we will select the Processing tab from the menu bar and add the Processing Toolbox to our user interface. (See 3.3)
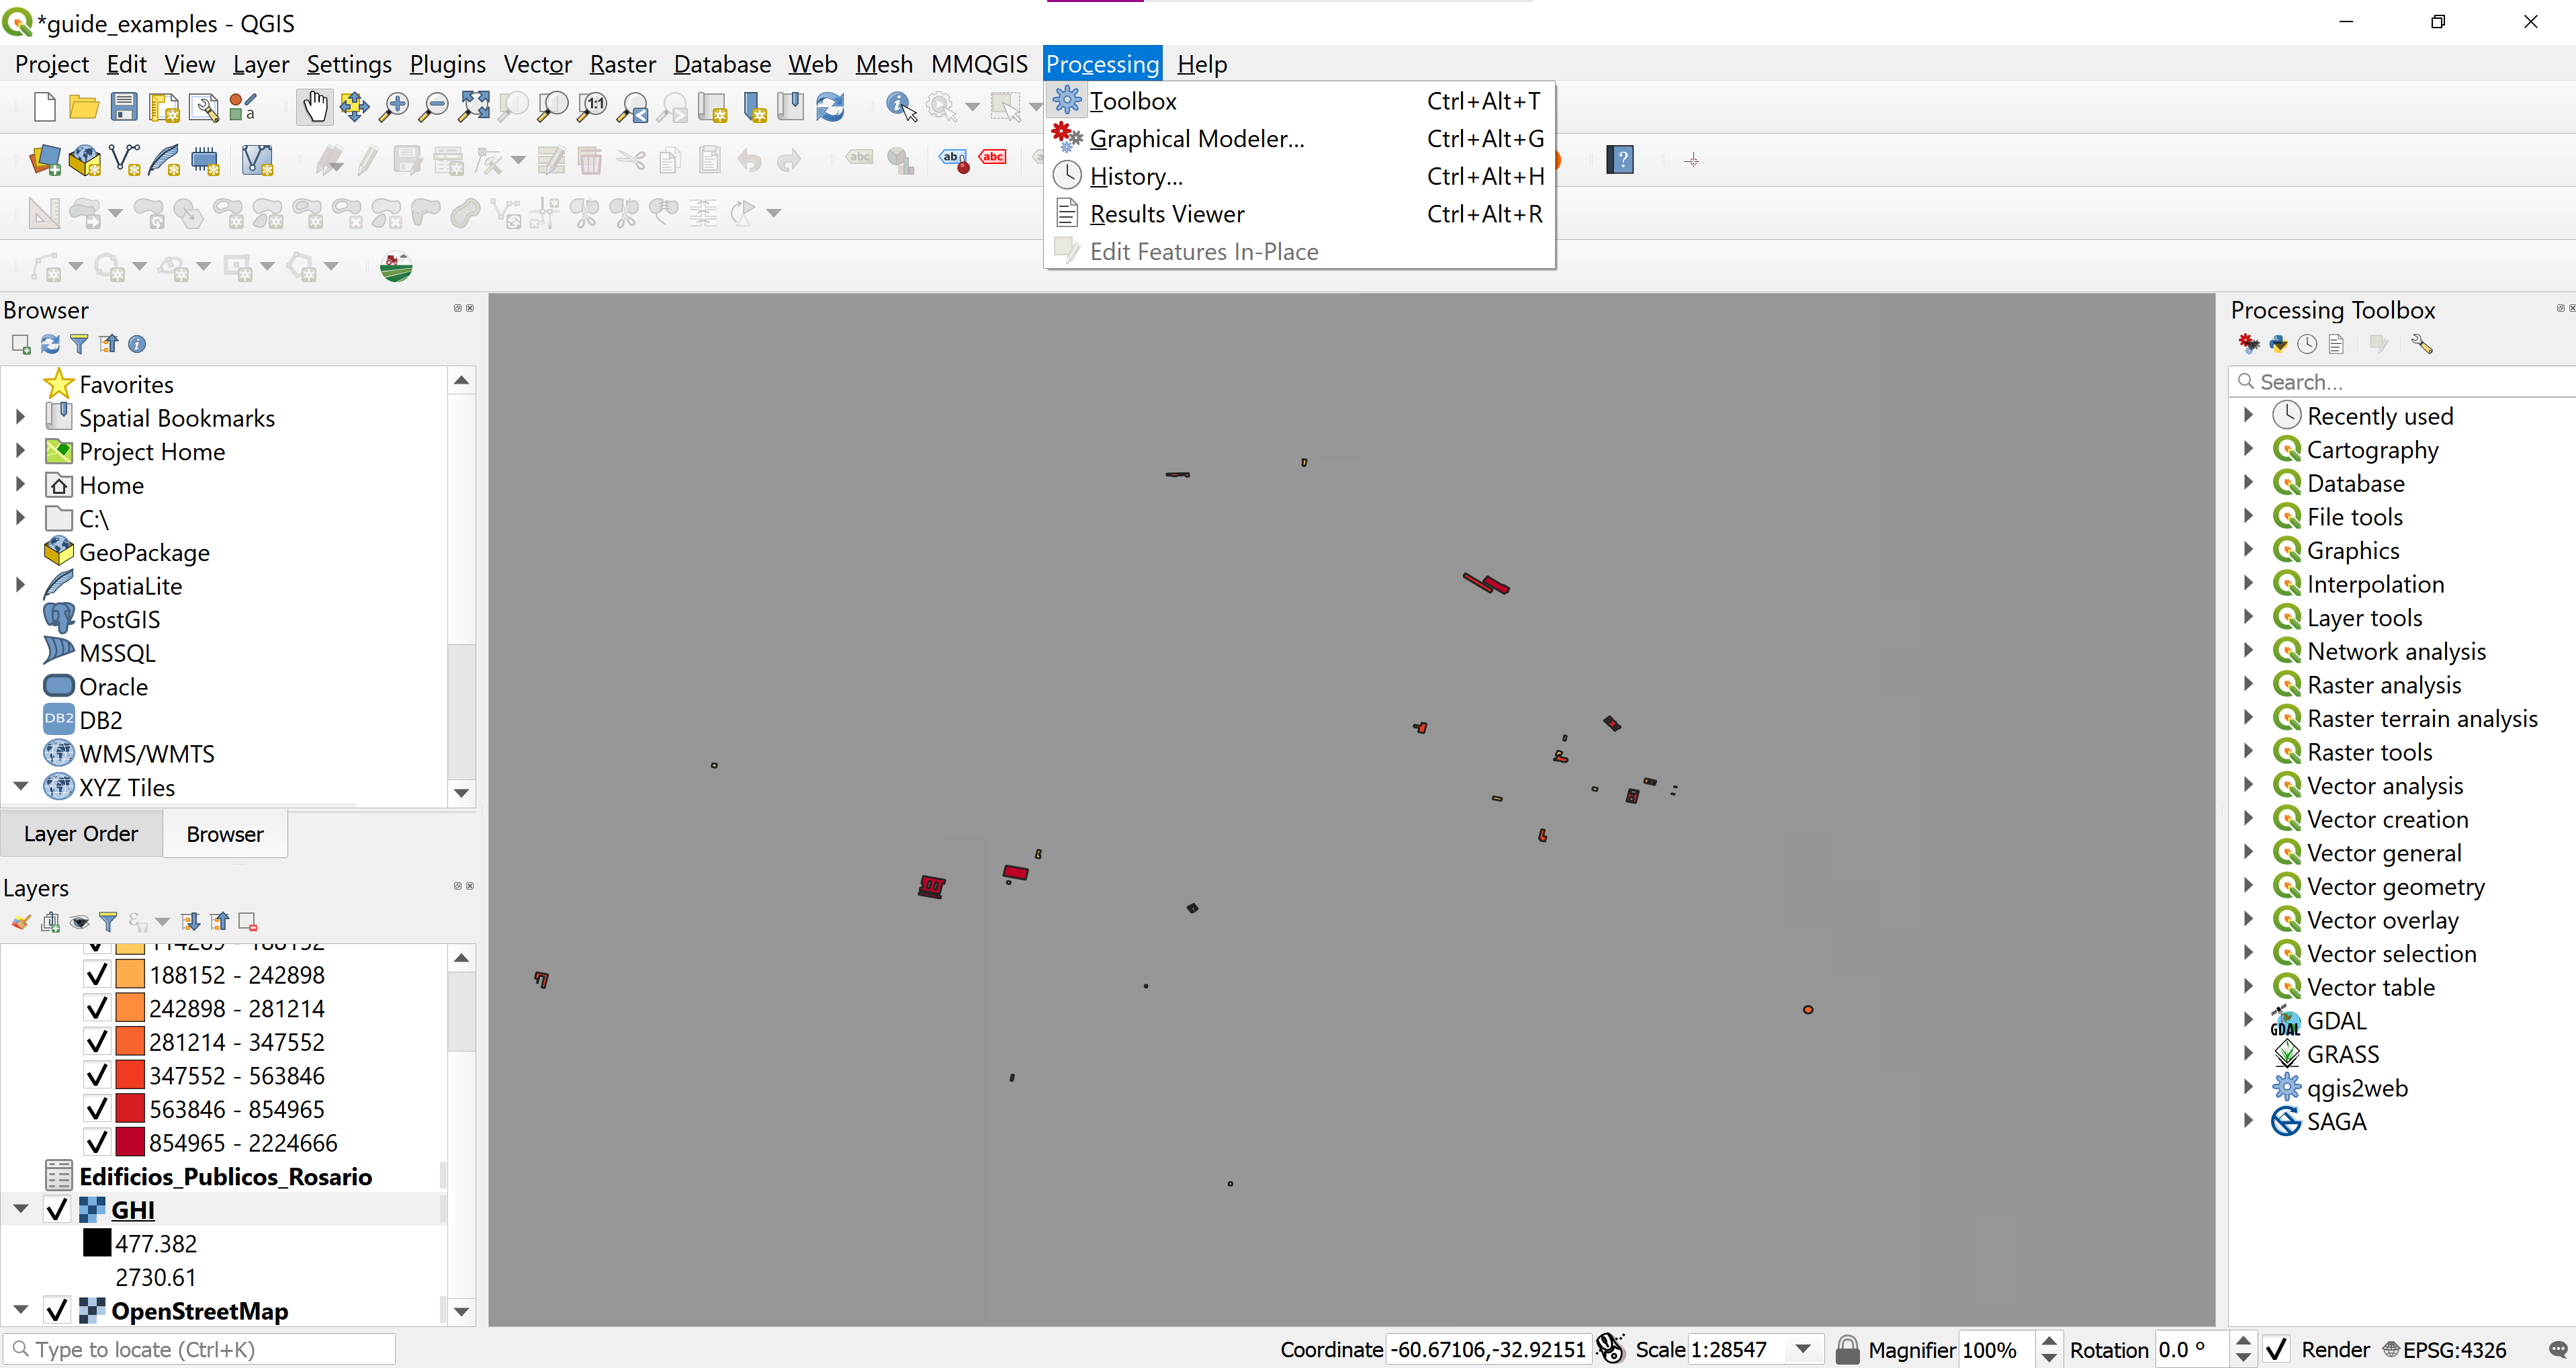
Figure 3.3: Processing Toolbox
In the Processing Toolbox search bar we can search for the tool we would like to use - Zonal statistics. Once we press the Zonal statistics algorithm configuration window will open and we can choose our raster layer and our vector layer containing the zones for calculation. Under the two layer inputs, we can select a prefix for the field name which will contain the algorithm’s calculations, we will use the predefined _ prefix. (See 3.4)
The last tab called Statistics to calculate is where we can select how the algorithm will calculate the pixel values over the polygons. Here we would like to average the pixel value of irradiation throughout the rooftop. Therefore, we select Mean click the OK button and then the Run button. (See 3.5)
To see our calculations we can open the attribute table of the rosario_municipalb layer. (See 3.6)
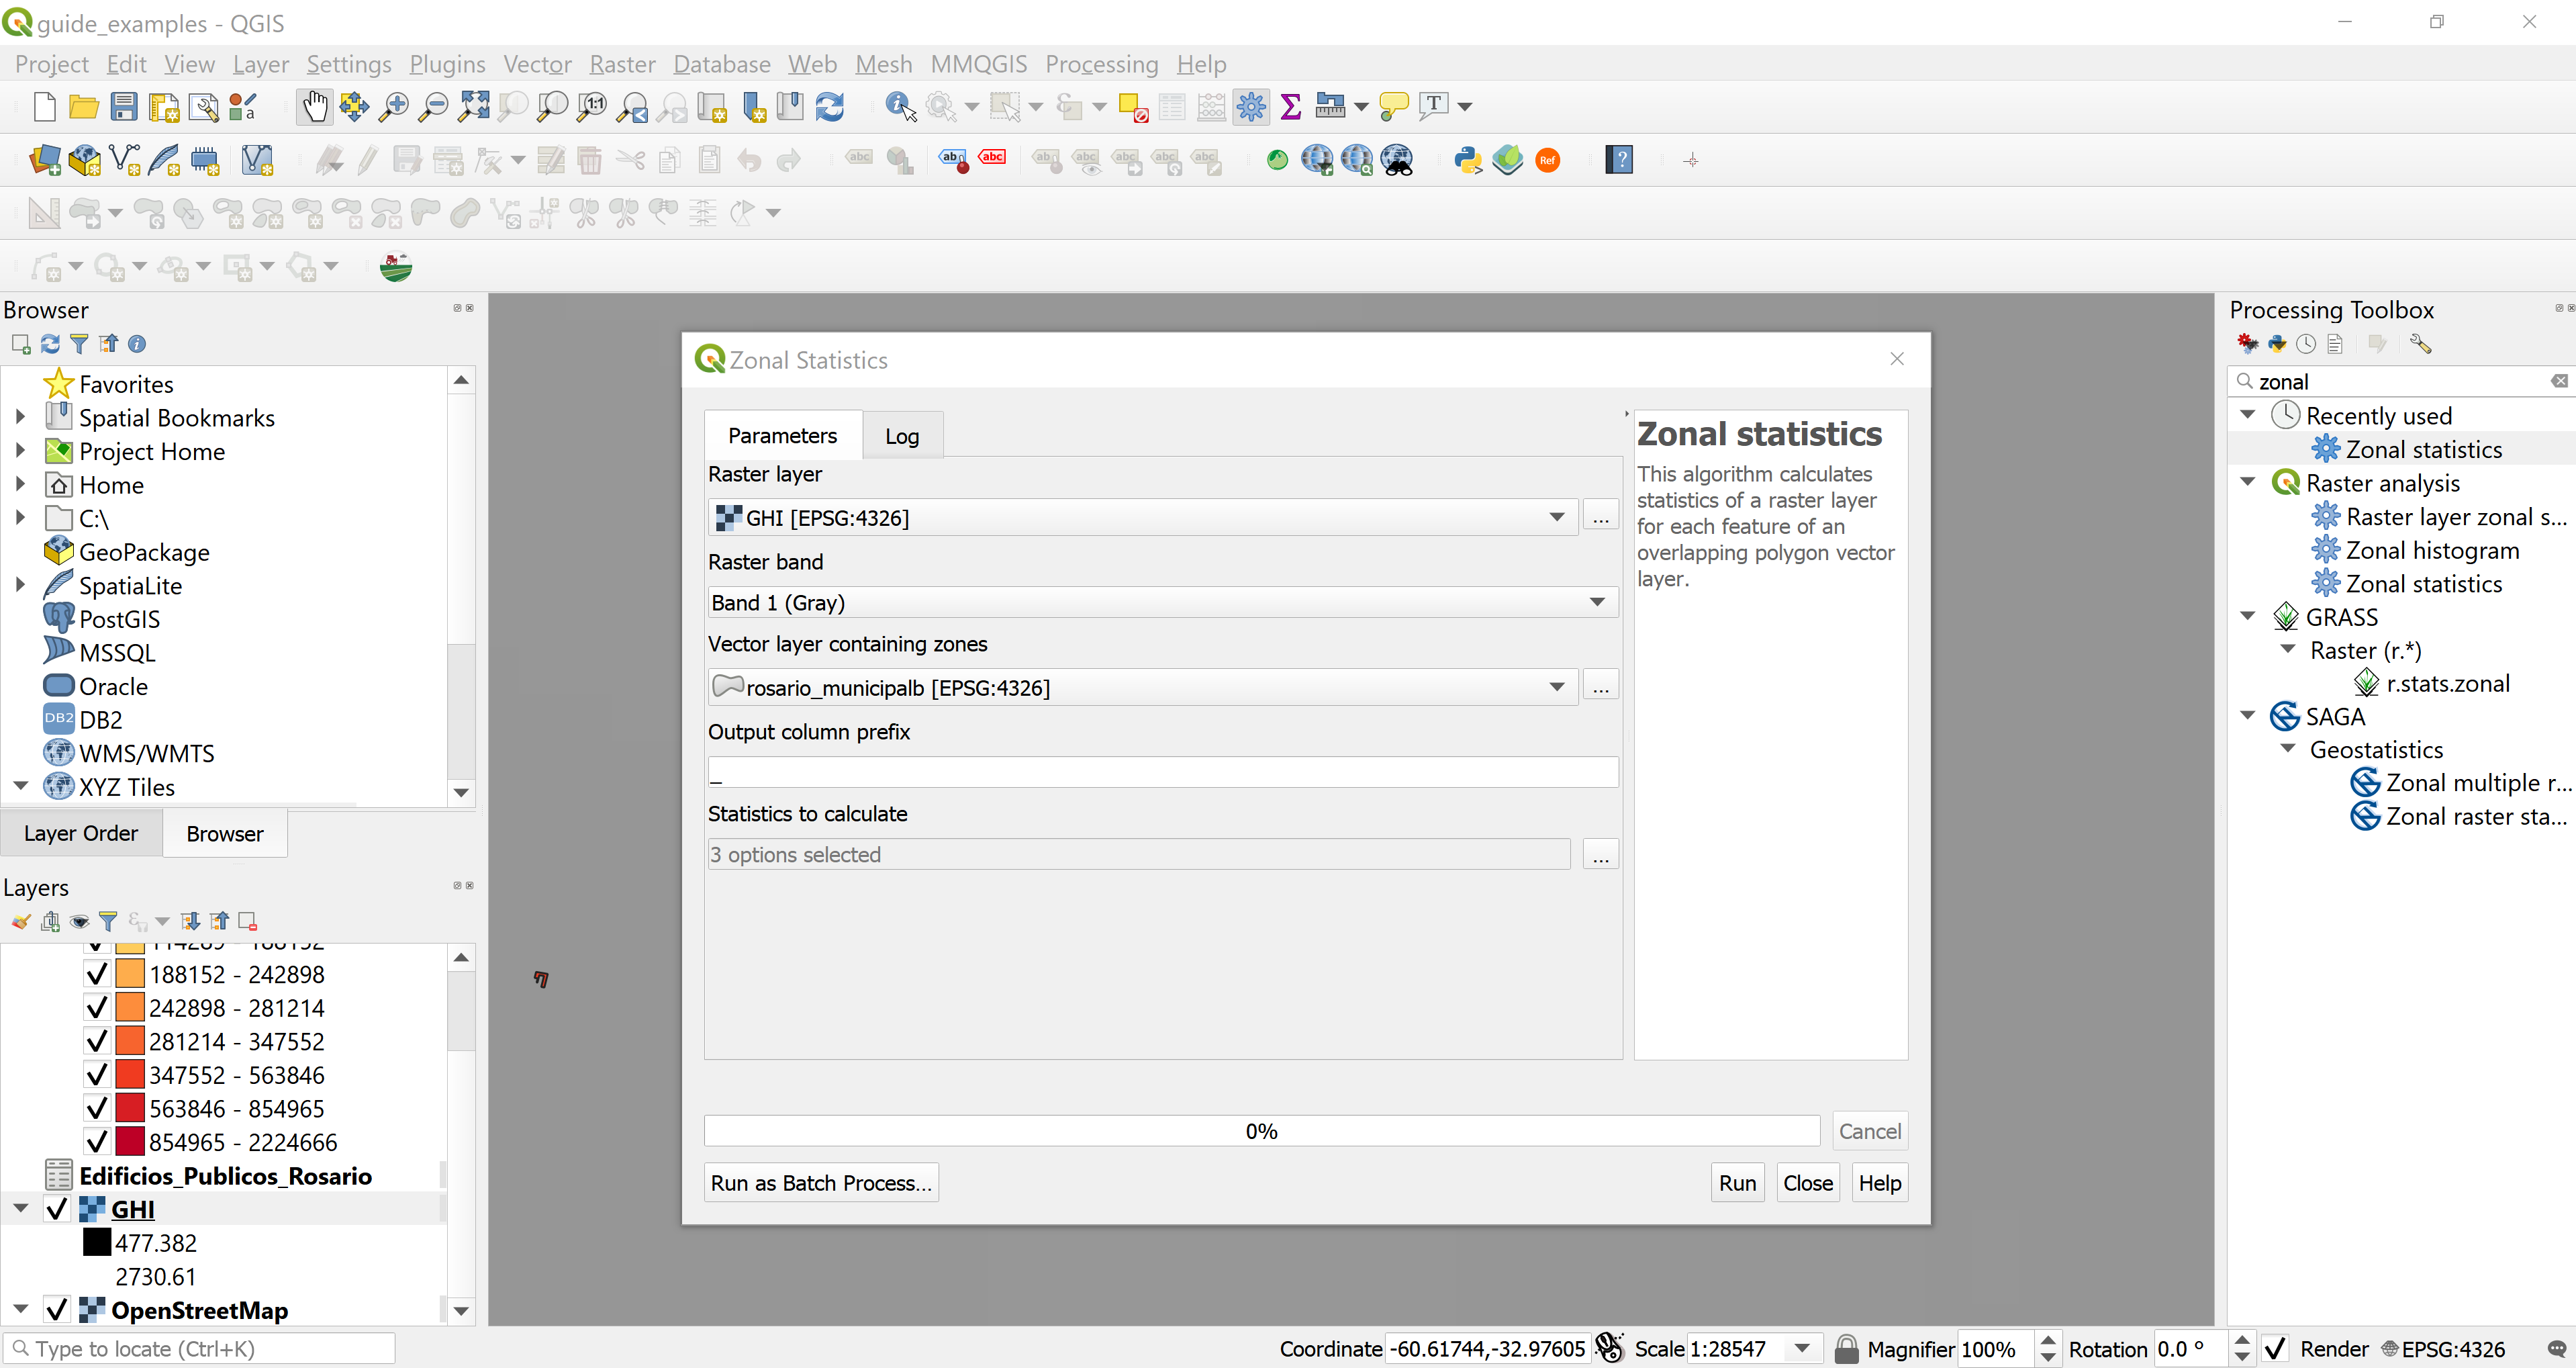
Figure 3.4: Zonal Statistics
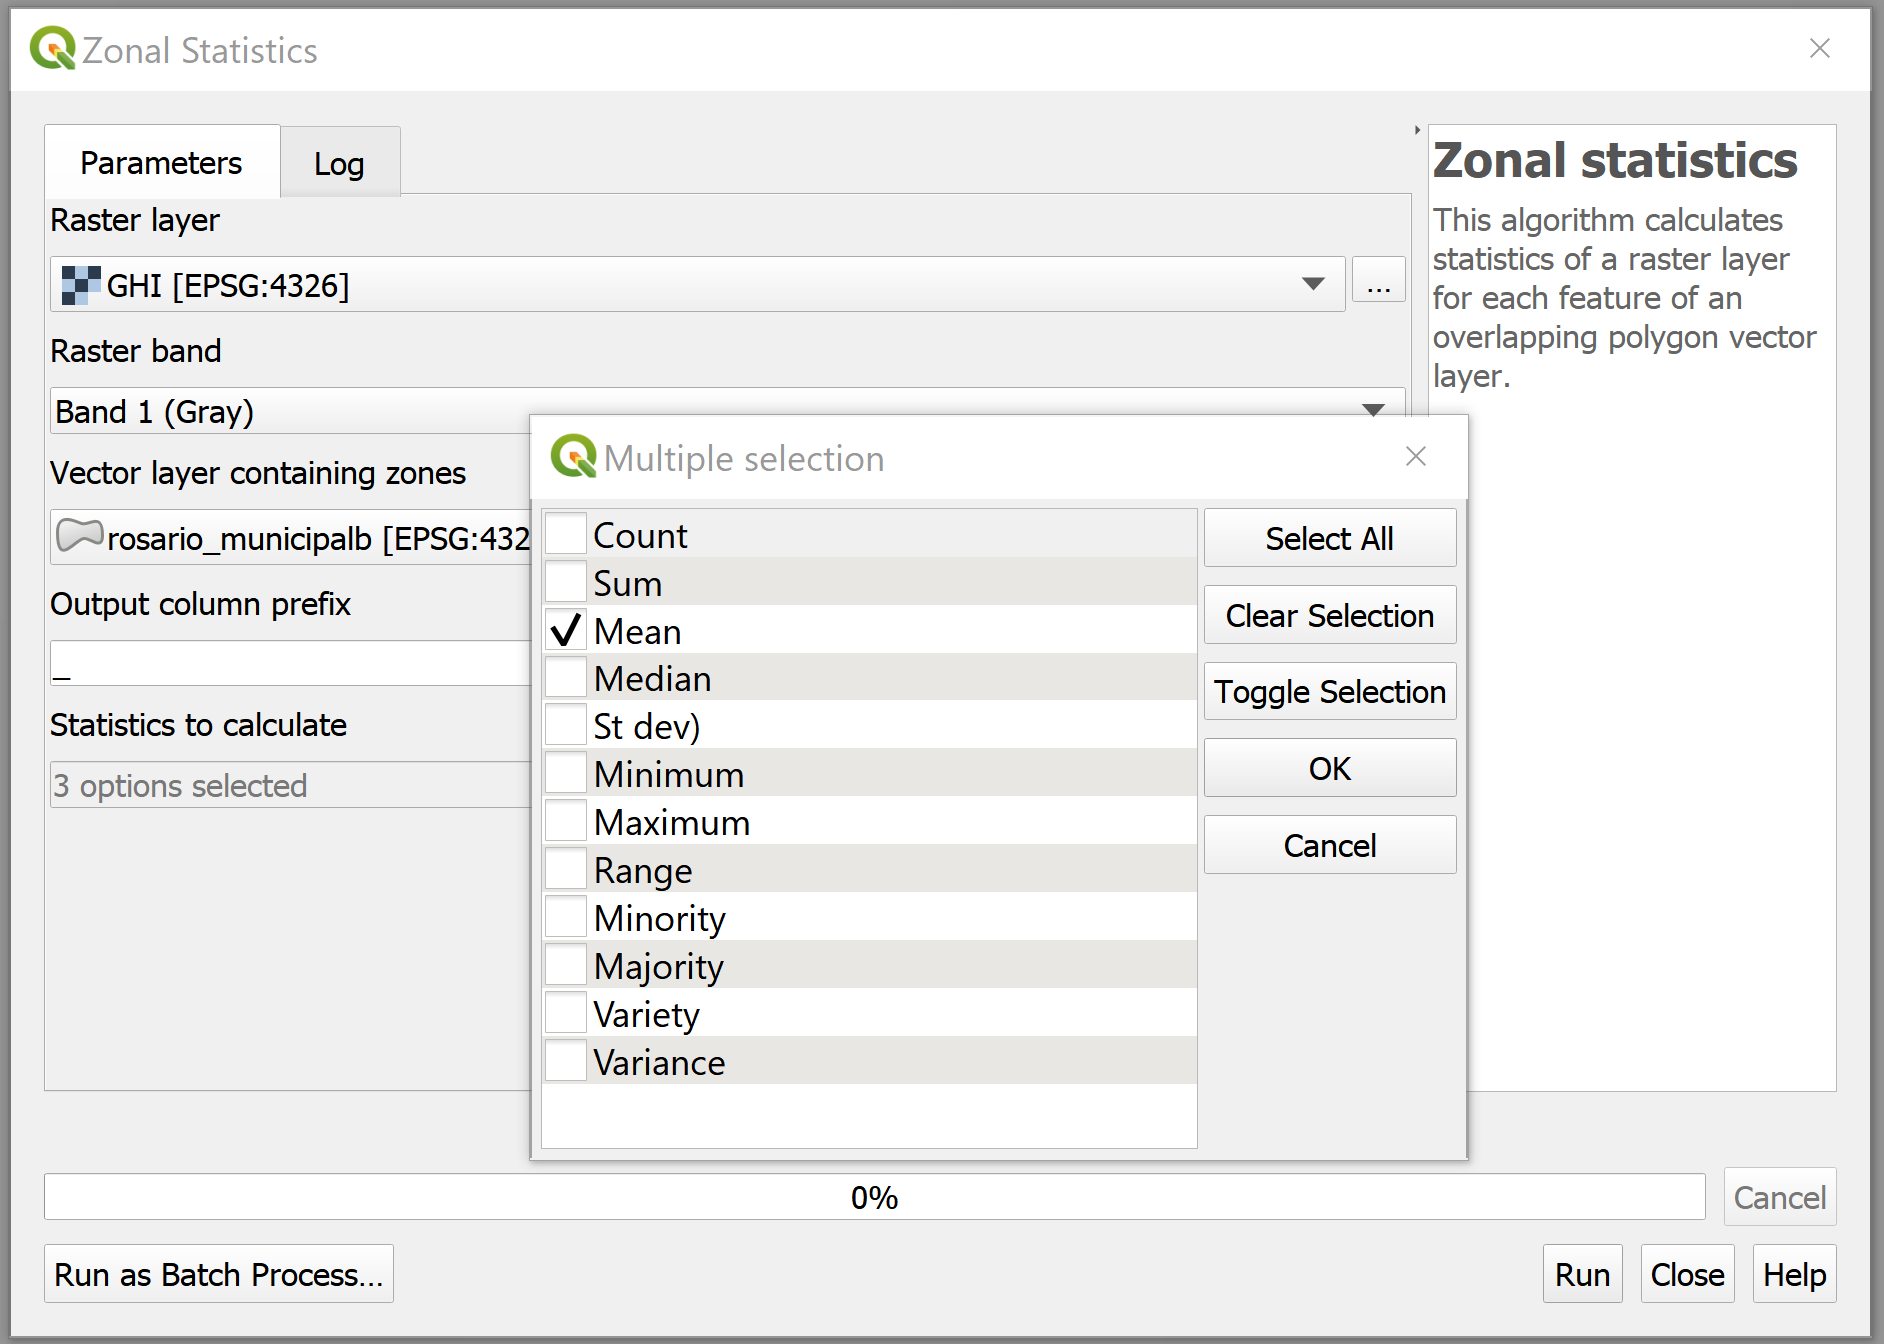
Figure 3.5: Zonal Statistics
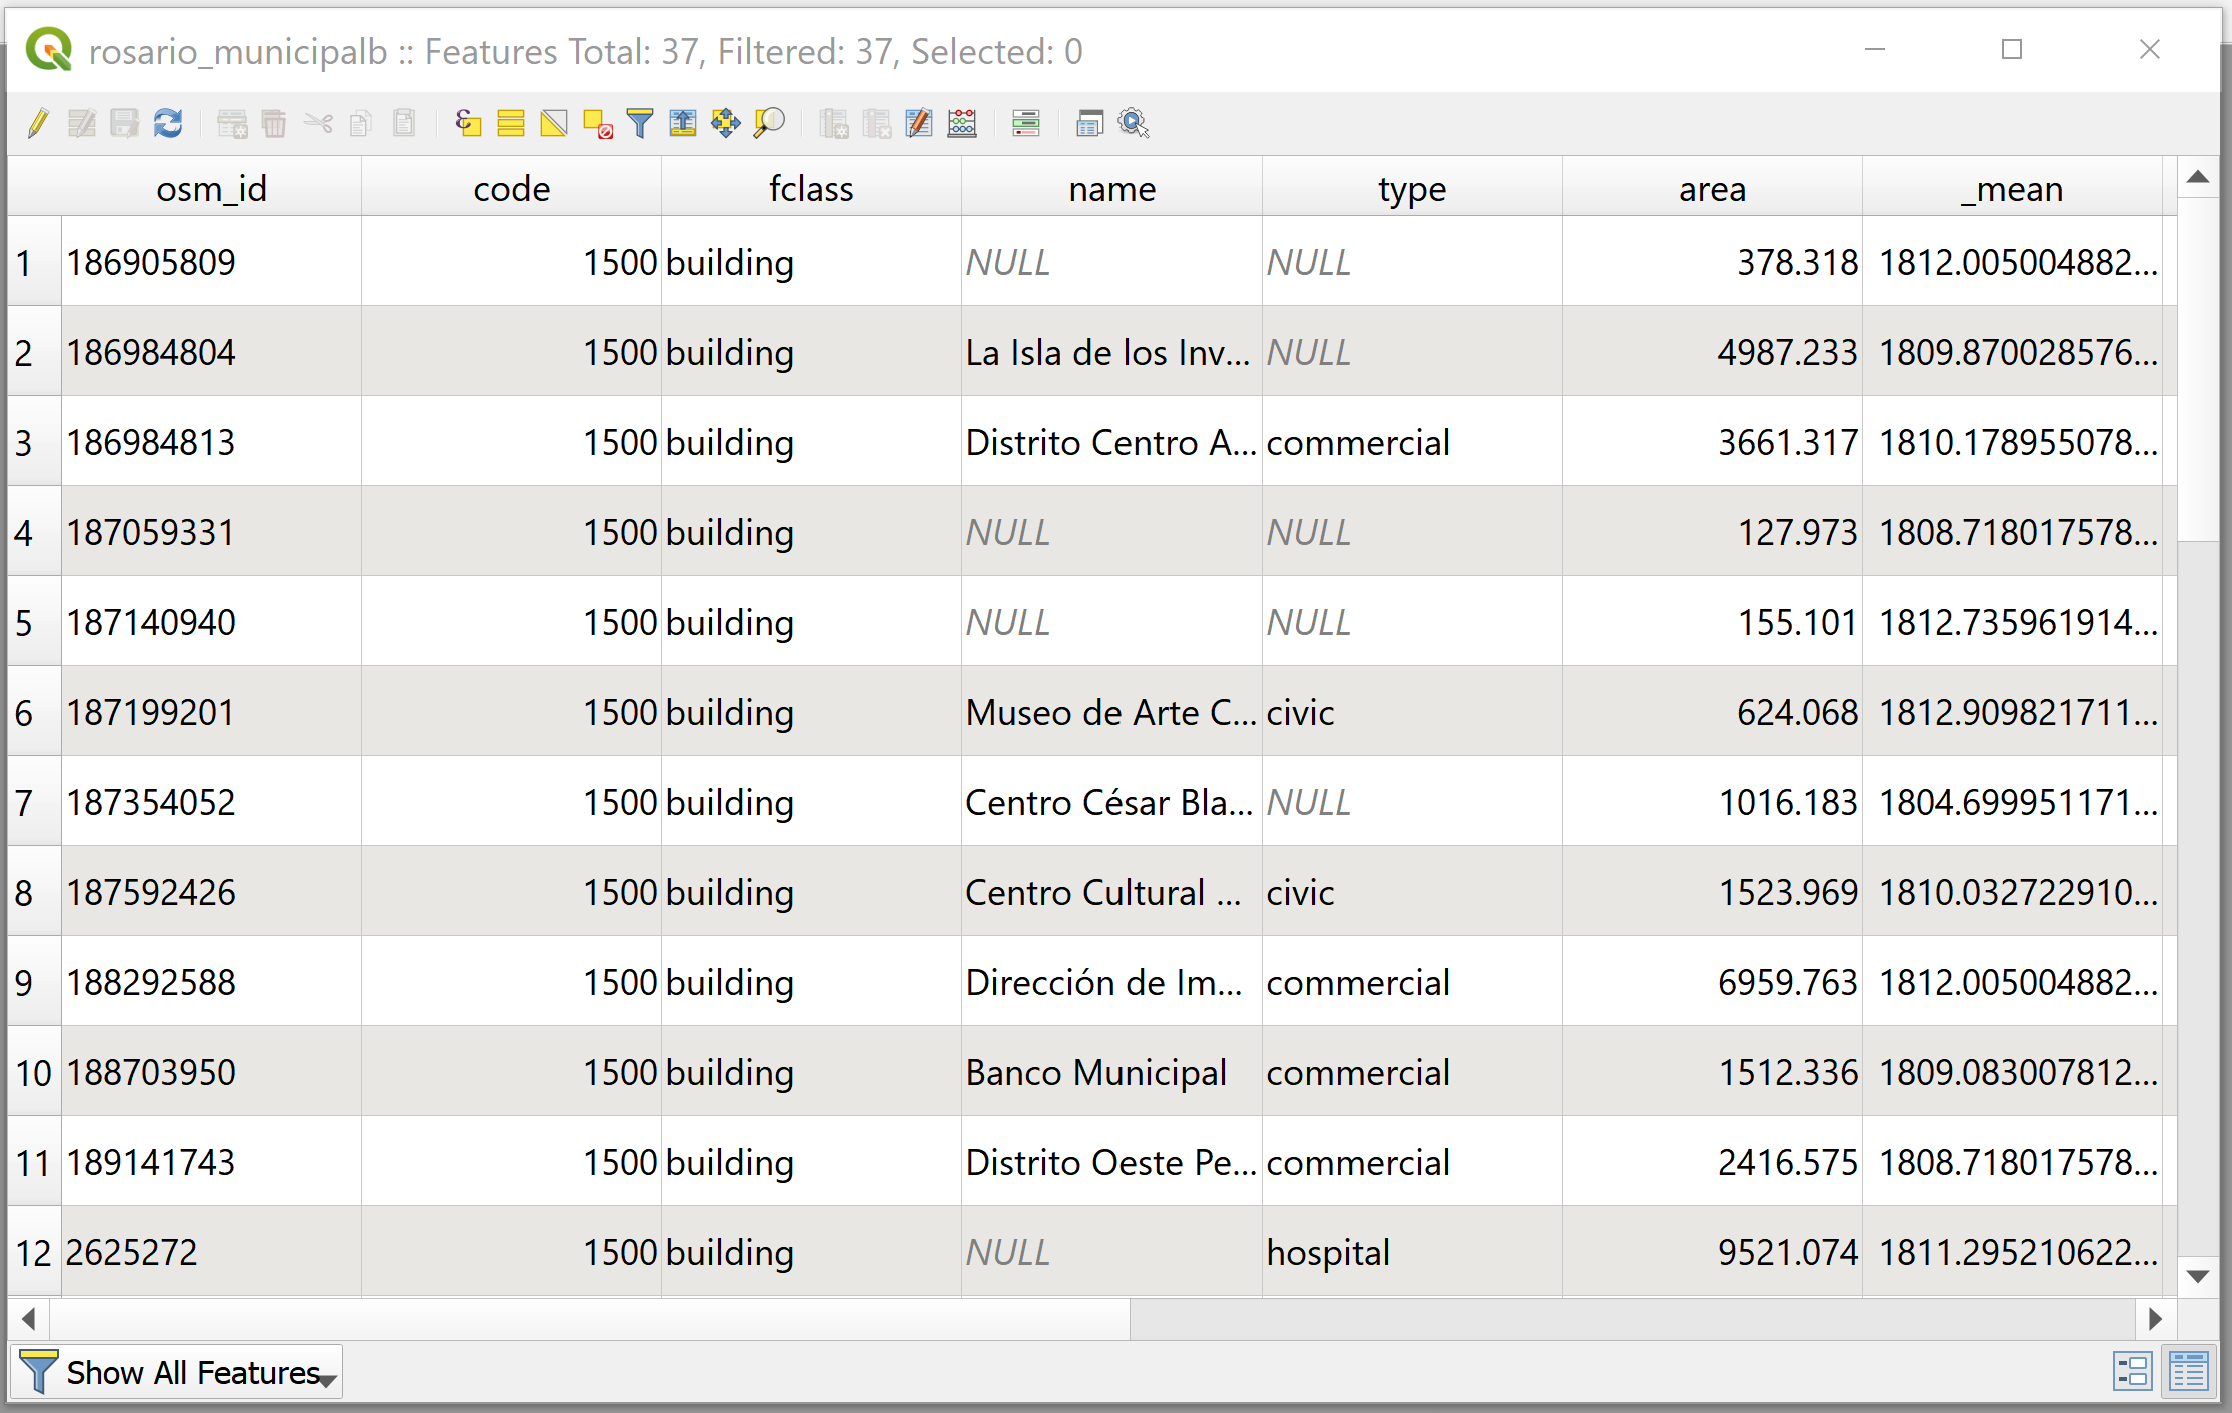
Figure 3.6: Attribute Table with Mean GHI Calculation