2.1 Adding table data to QGIS
As a first step, we would like to add to QGIS table data of electricity consumption. To do this we will go to the menu bar and click on the Layer Menu. The Layer Menu provides a large set of tools to create, add or save data sources. A table is usually in formats of delimited text e.g. CSV, therefore we will click on the Add Delimited Text Layer option. (See 2.2)
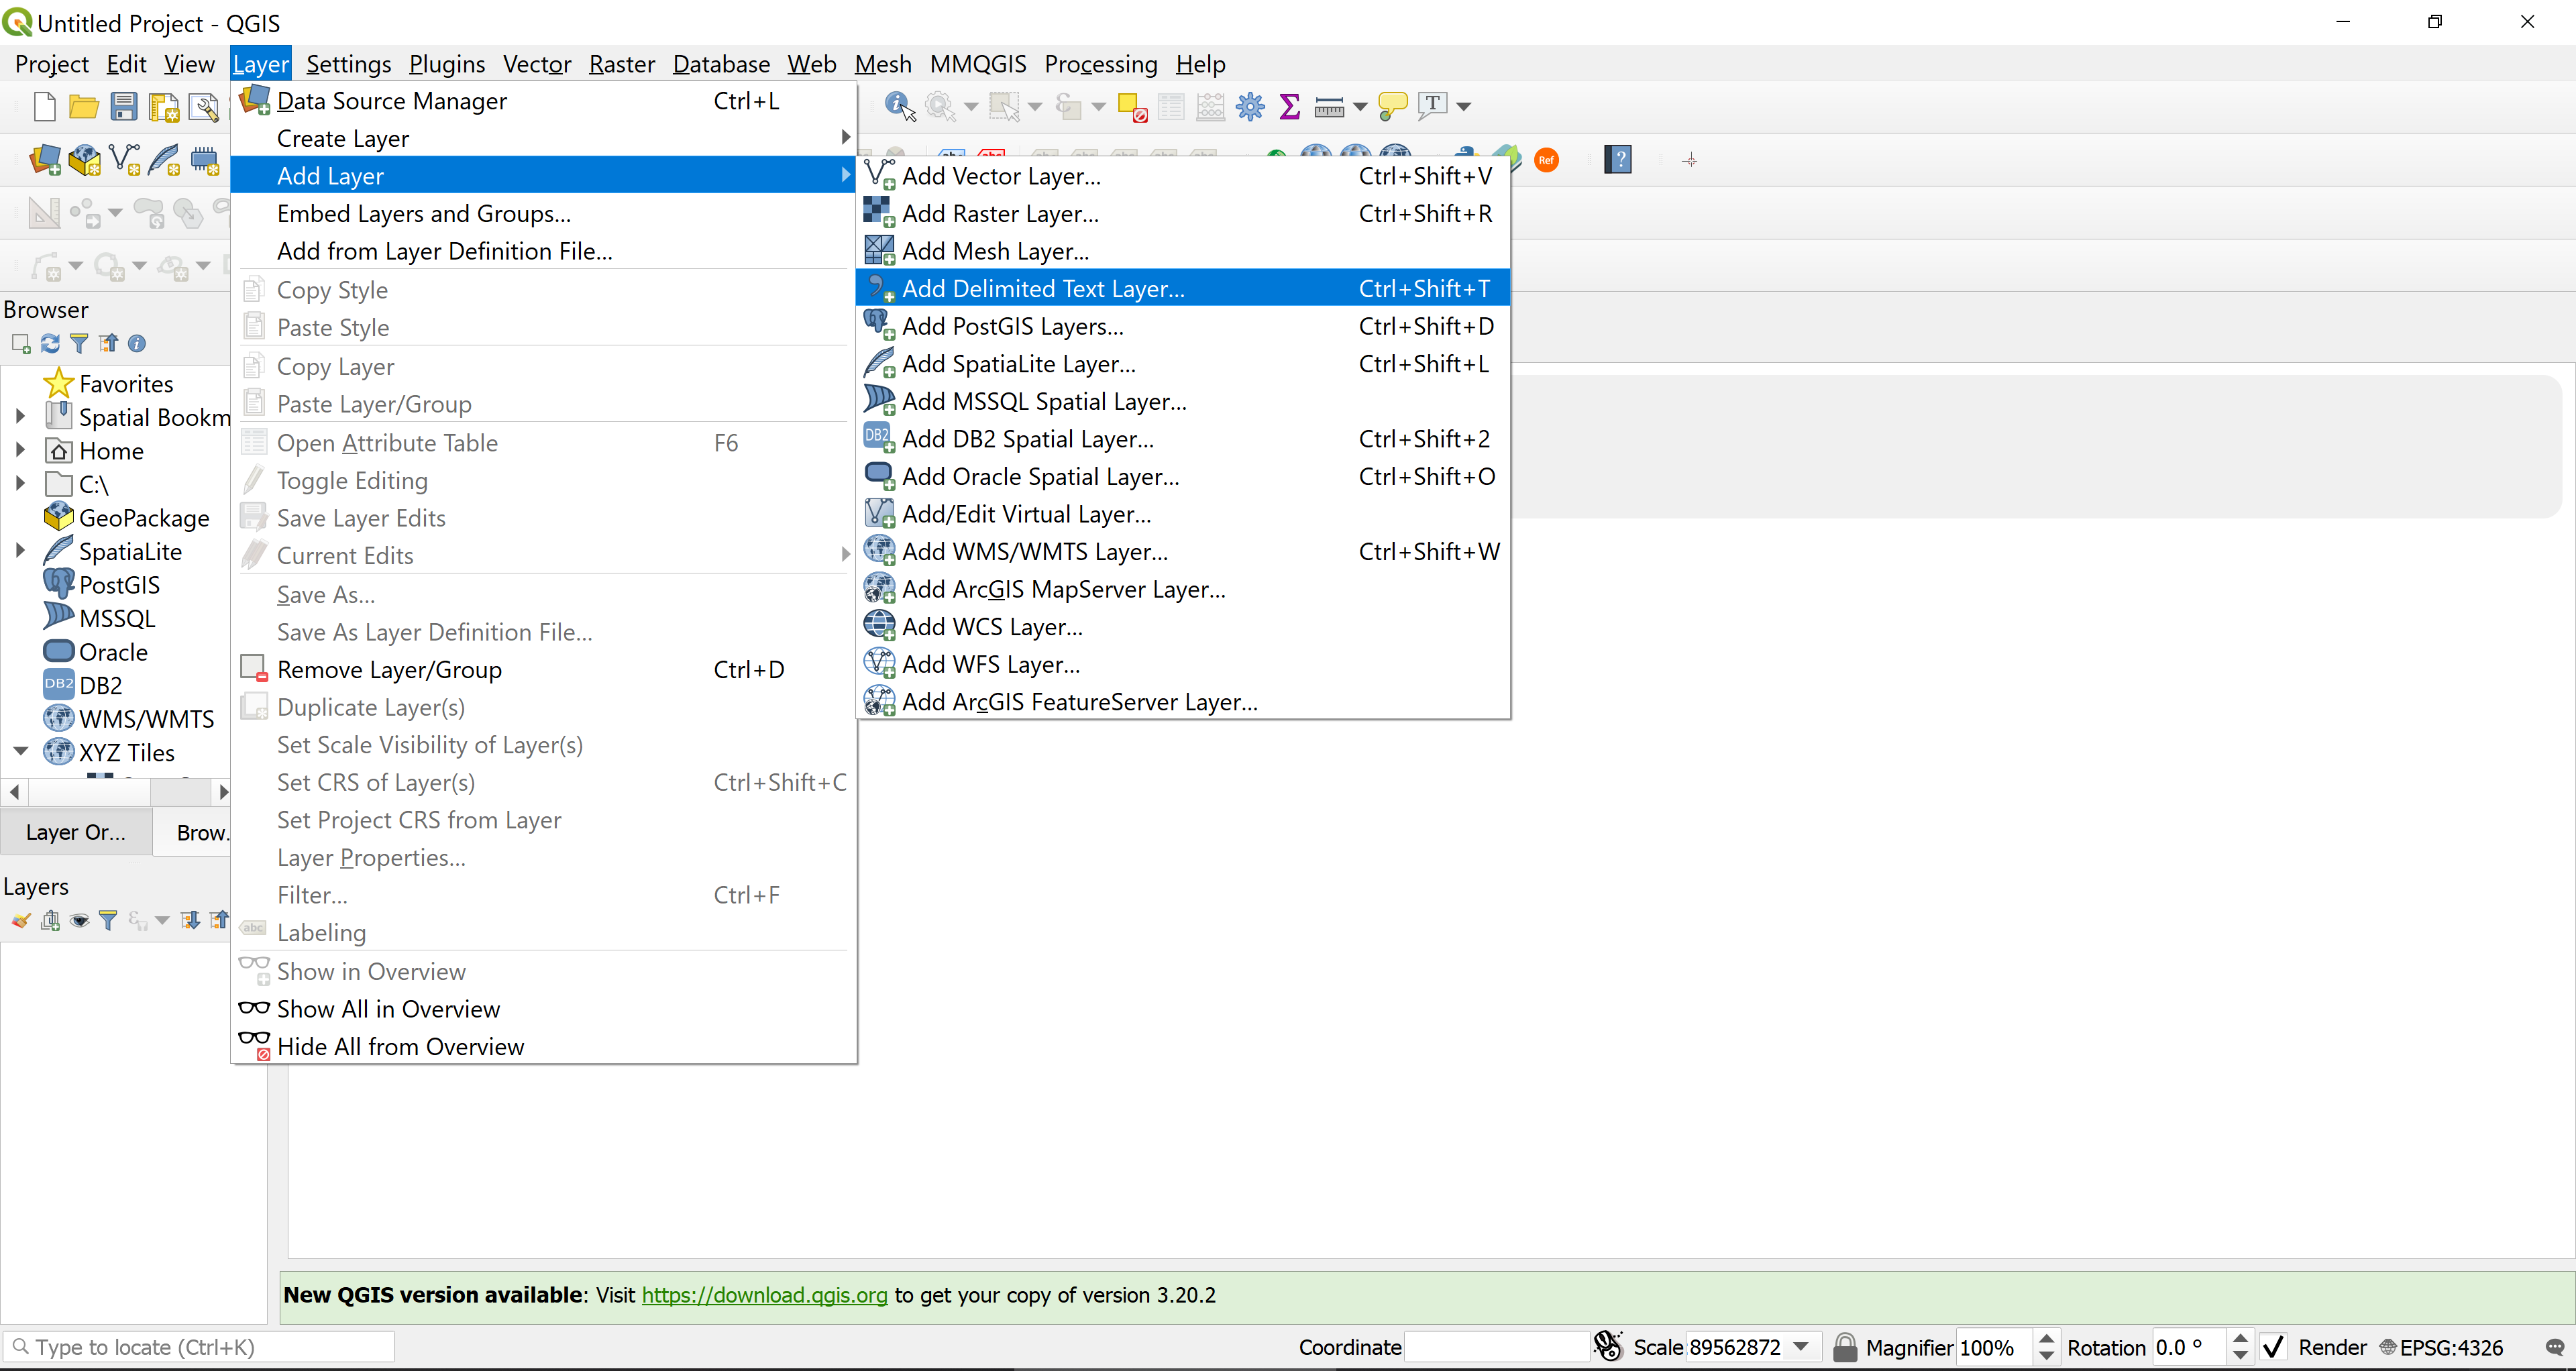
Figure 2.2: Add Table
Next the Data Source Manager will open, and we can click on the three dots (…) on the top right corner to select the file we would like to add from our local directory.
In this window, QGIS will automatically update the File Format, Record and Fields Options, and the Geometry Definition information. Under the Layer Settings, we can see a preview of the table Edificios_Publicos_Rosario.csv, the Total Consumos is the column or better known as the field of current building electricity consumption in Rosario.
Once we finish validating all the information in our table, we can click on Add on the bottom right and see our table data on the bottom left side under Layers . (See 2.3 and 2.4)
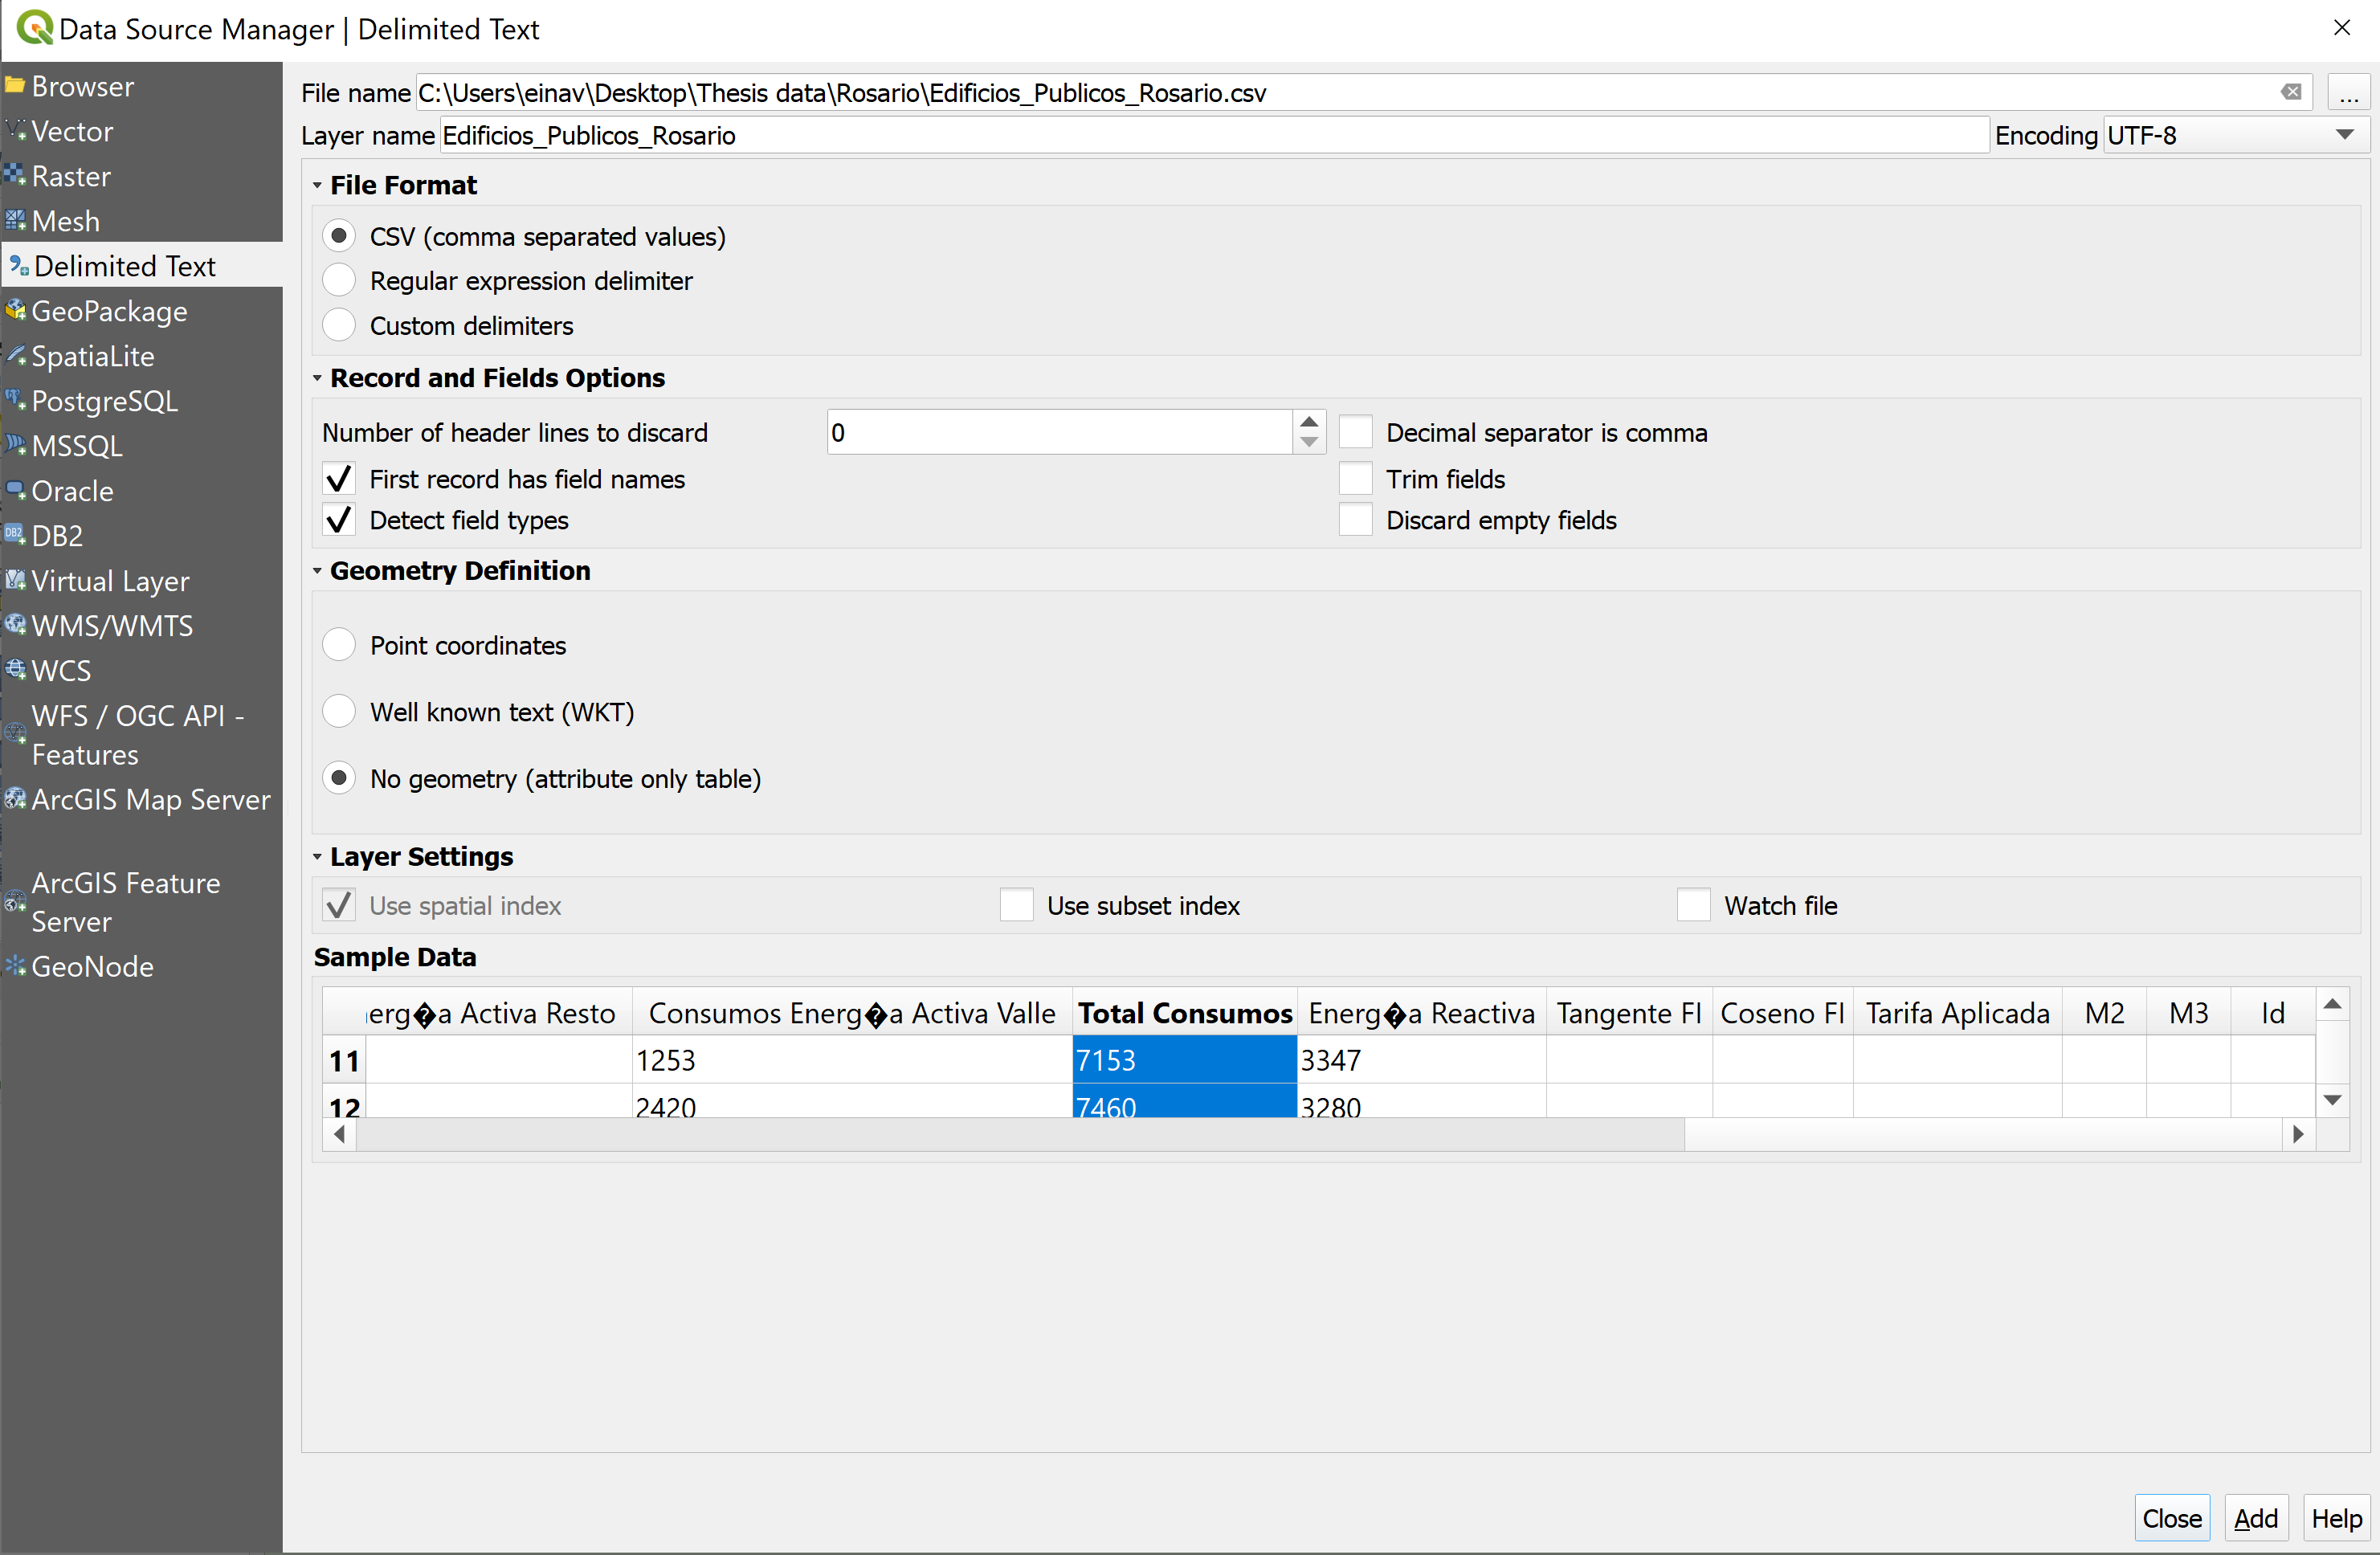
Figure 2.3: Data Source Manager
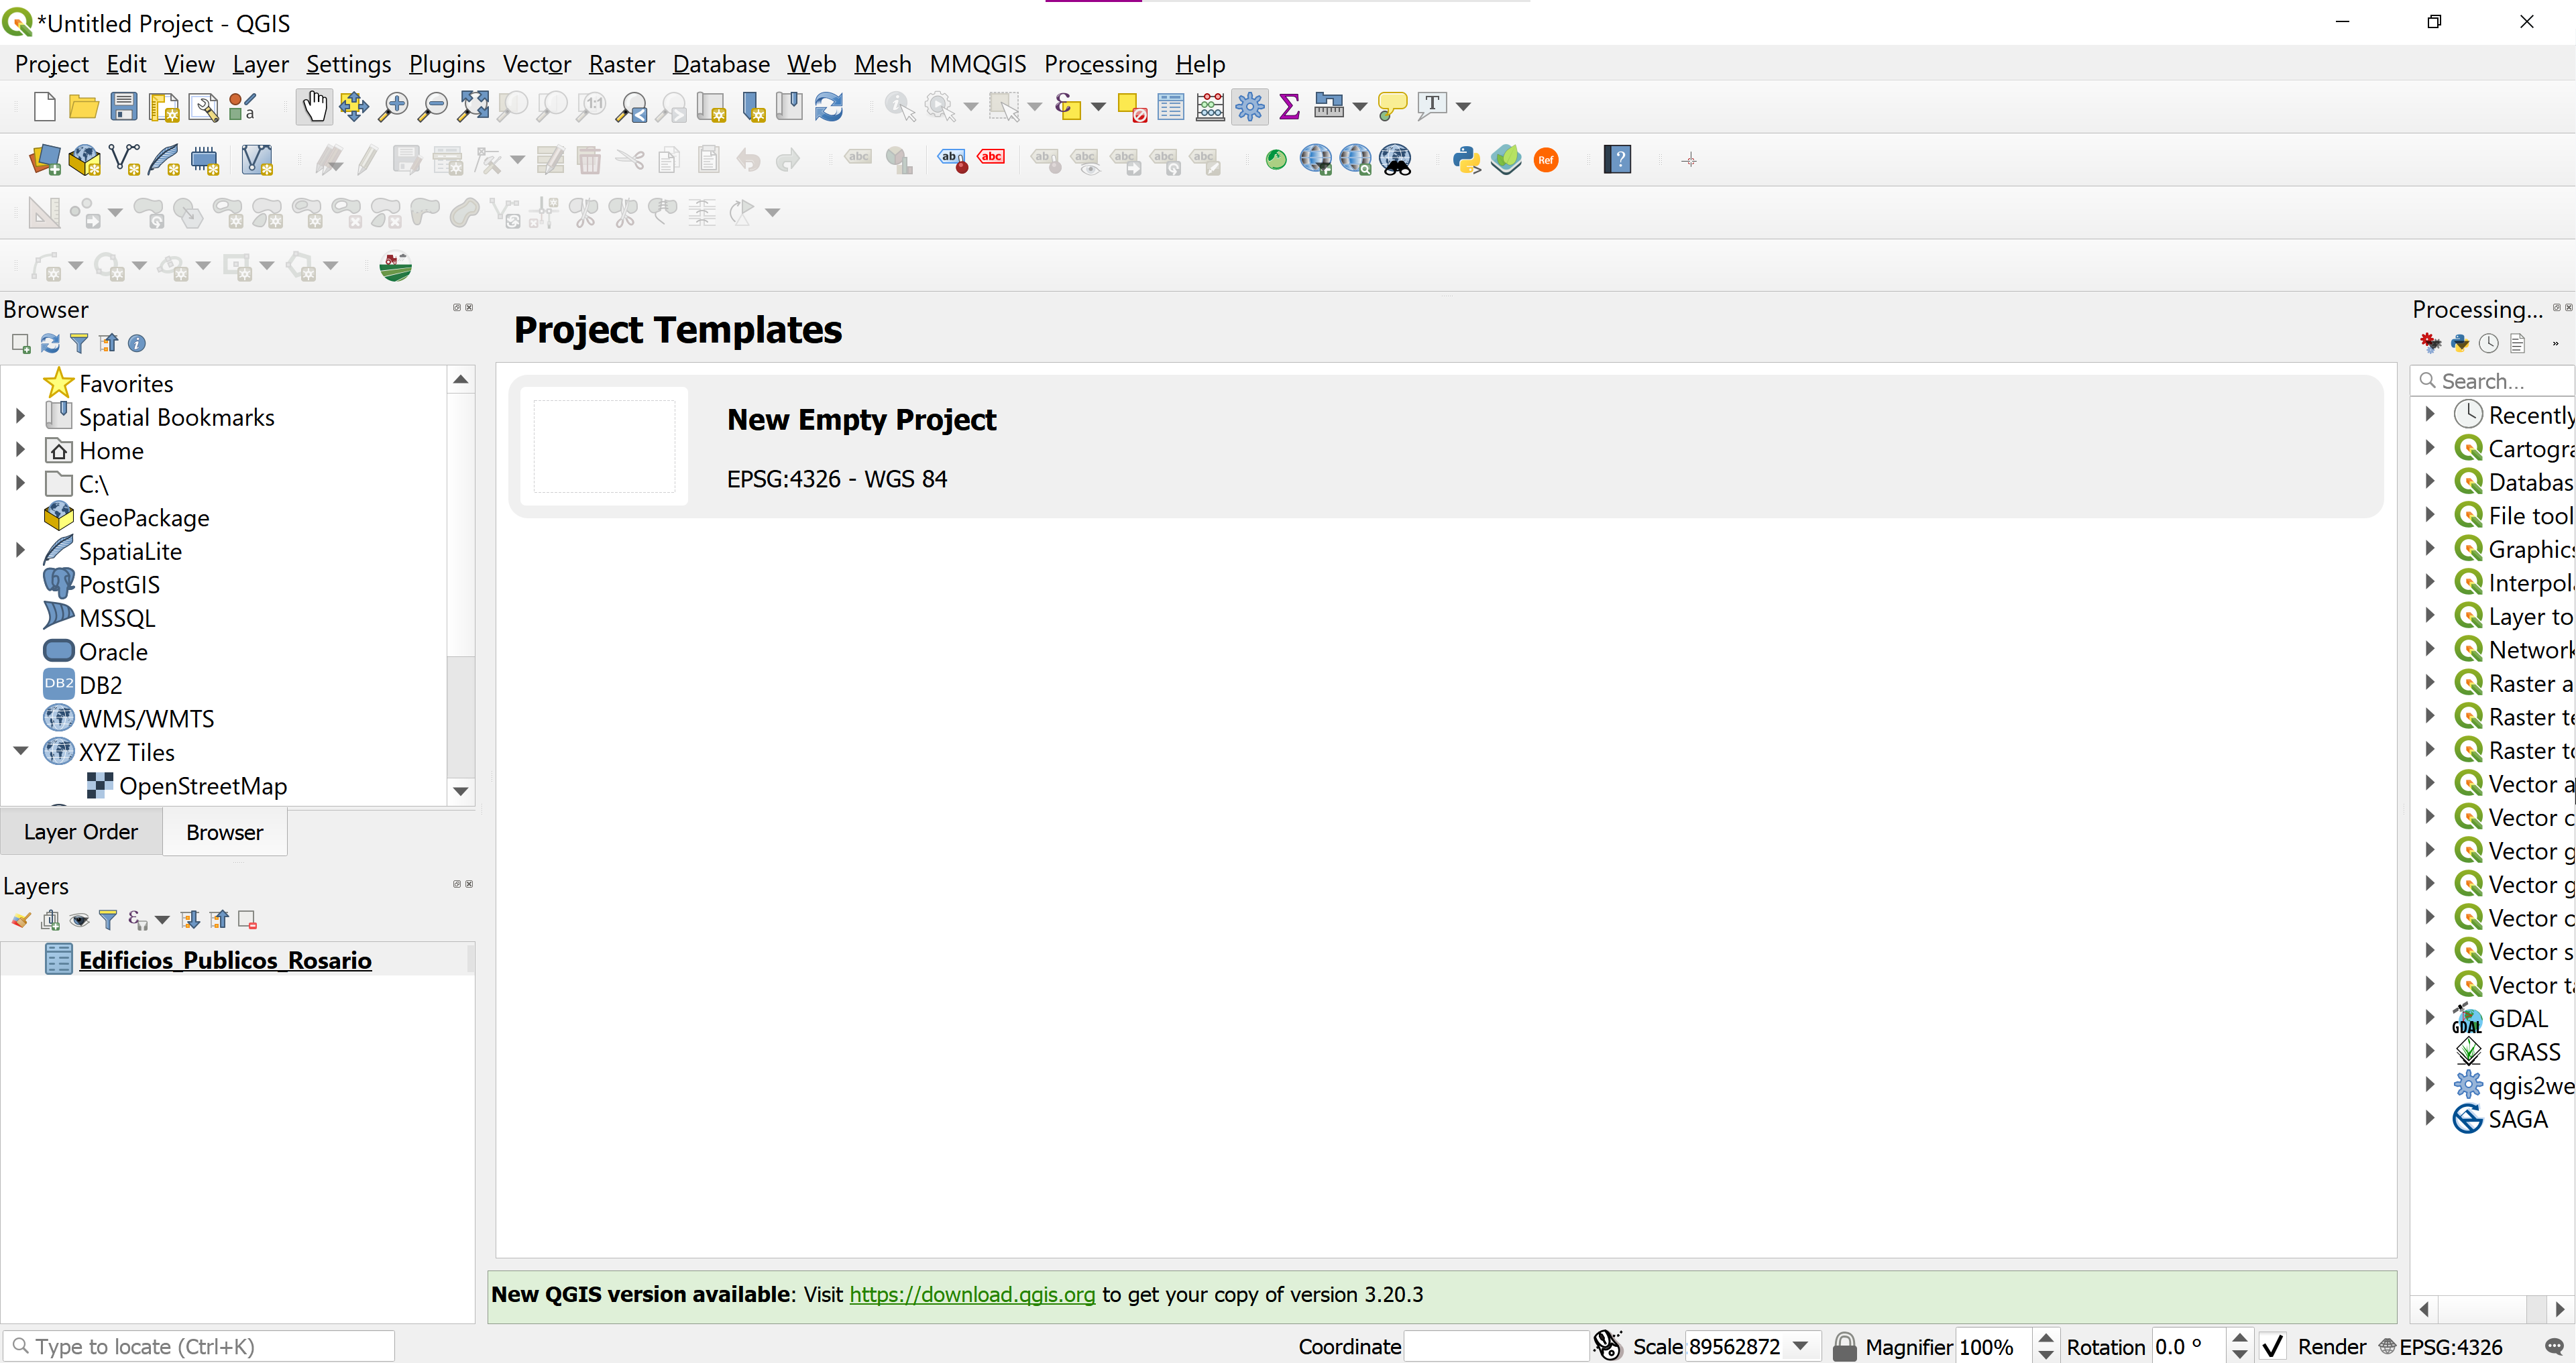
Figure 2.4: Layers Panel
This data is not open data. In this guide, the data about municipal building electricity consumption was contributed by the city of Rosario, Argentina.
This guide can also be implemented without mapping the current electricity consumption of buildings but this data can provide information regarding the non-renewable and renewable electricity balance produced for a building.