2.4 Consumption visualizations
Now that we have the building electricity consumption associated with the polygon layer of the municipal buildings, we can visualize the consumption using The Symbology tab.
First we will right click on our rosario_municipalb layer, then we select the Properties button and The Vector Properties Dialog window will open. On the right side we will see The Symbology tab, this tab provides a comprehensive tool for rendering and symbolizing vector data. At the top, we can choose between different rendering options.For visualizing the electricity consumption we will select the Graduated rendering option and click on the classify button to classify our total electricity consumption into 9 Equal Count (Quantile) breaks, meaning that each class will have the same number of elements. Then we can see our buildings colored according to their class. (See 2.13 and 2.14)
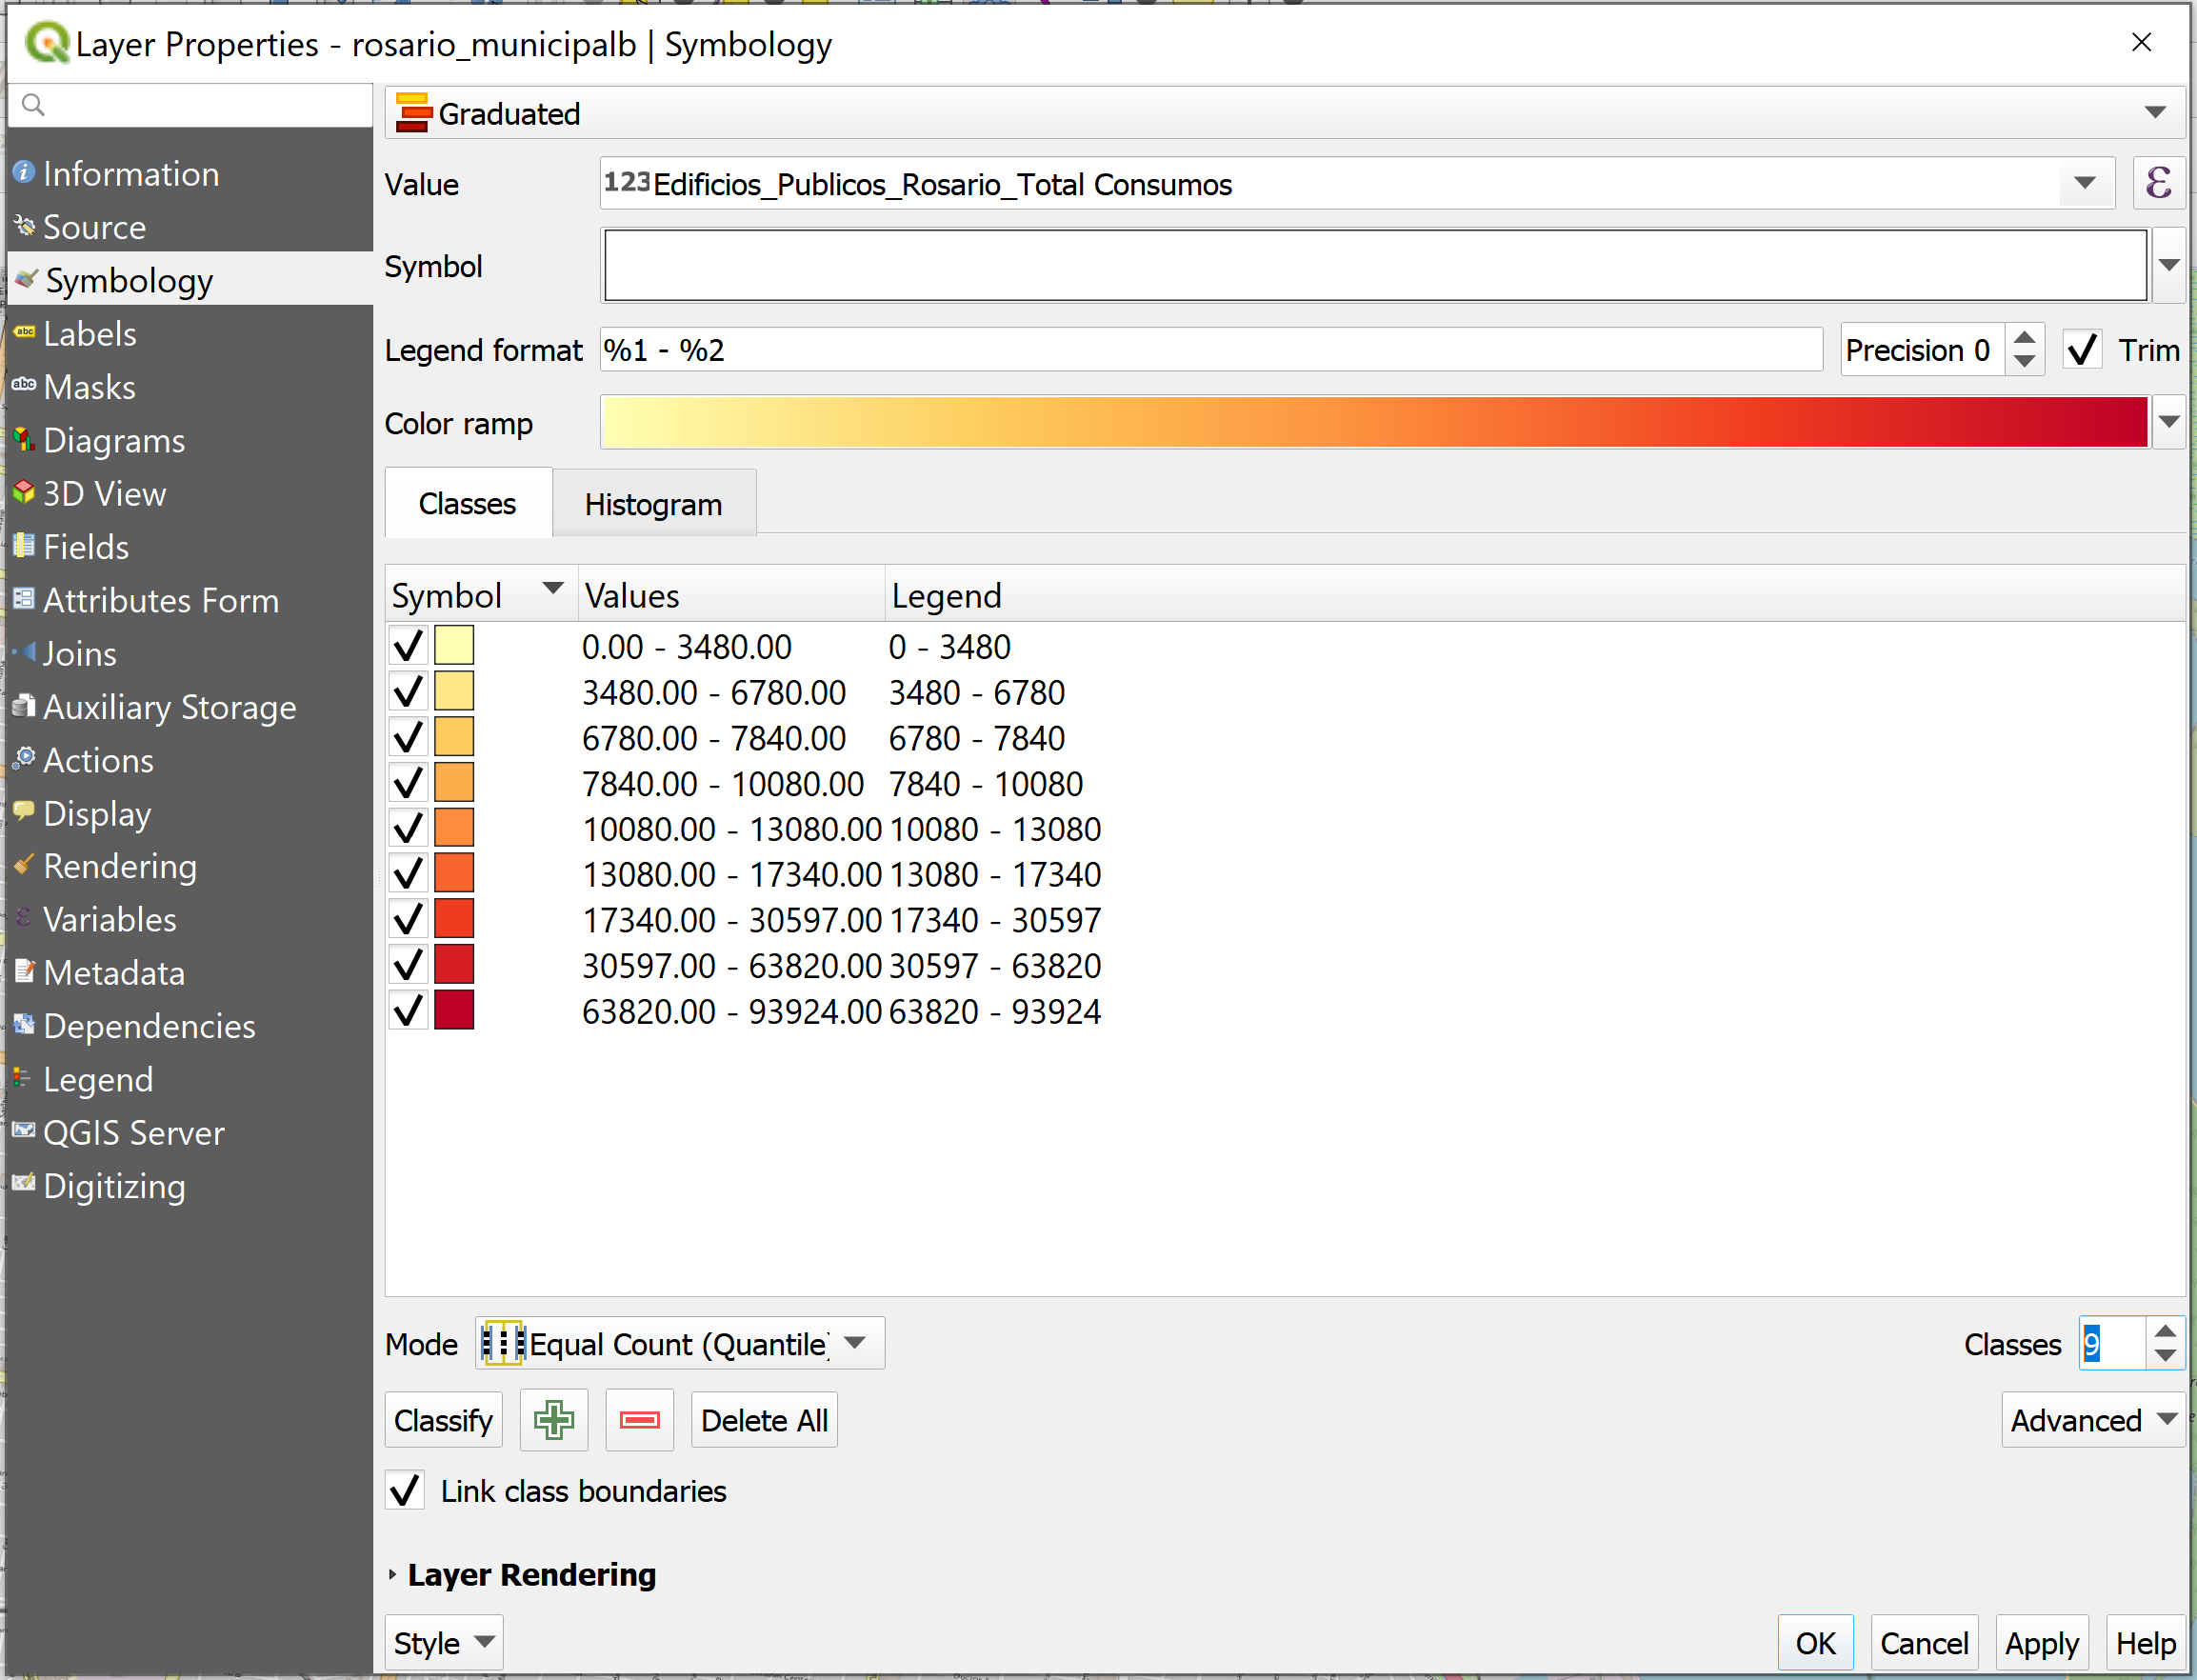
Figure 2.13: Layer Visualizations
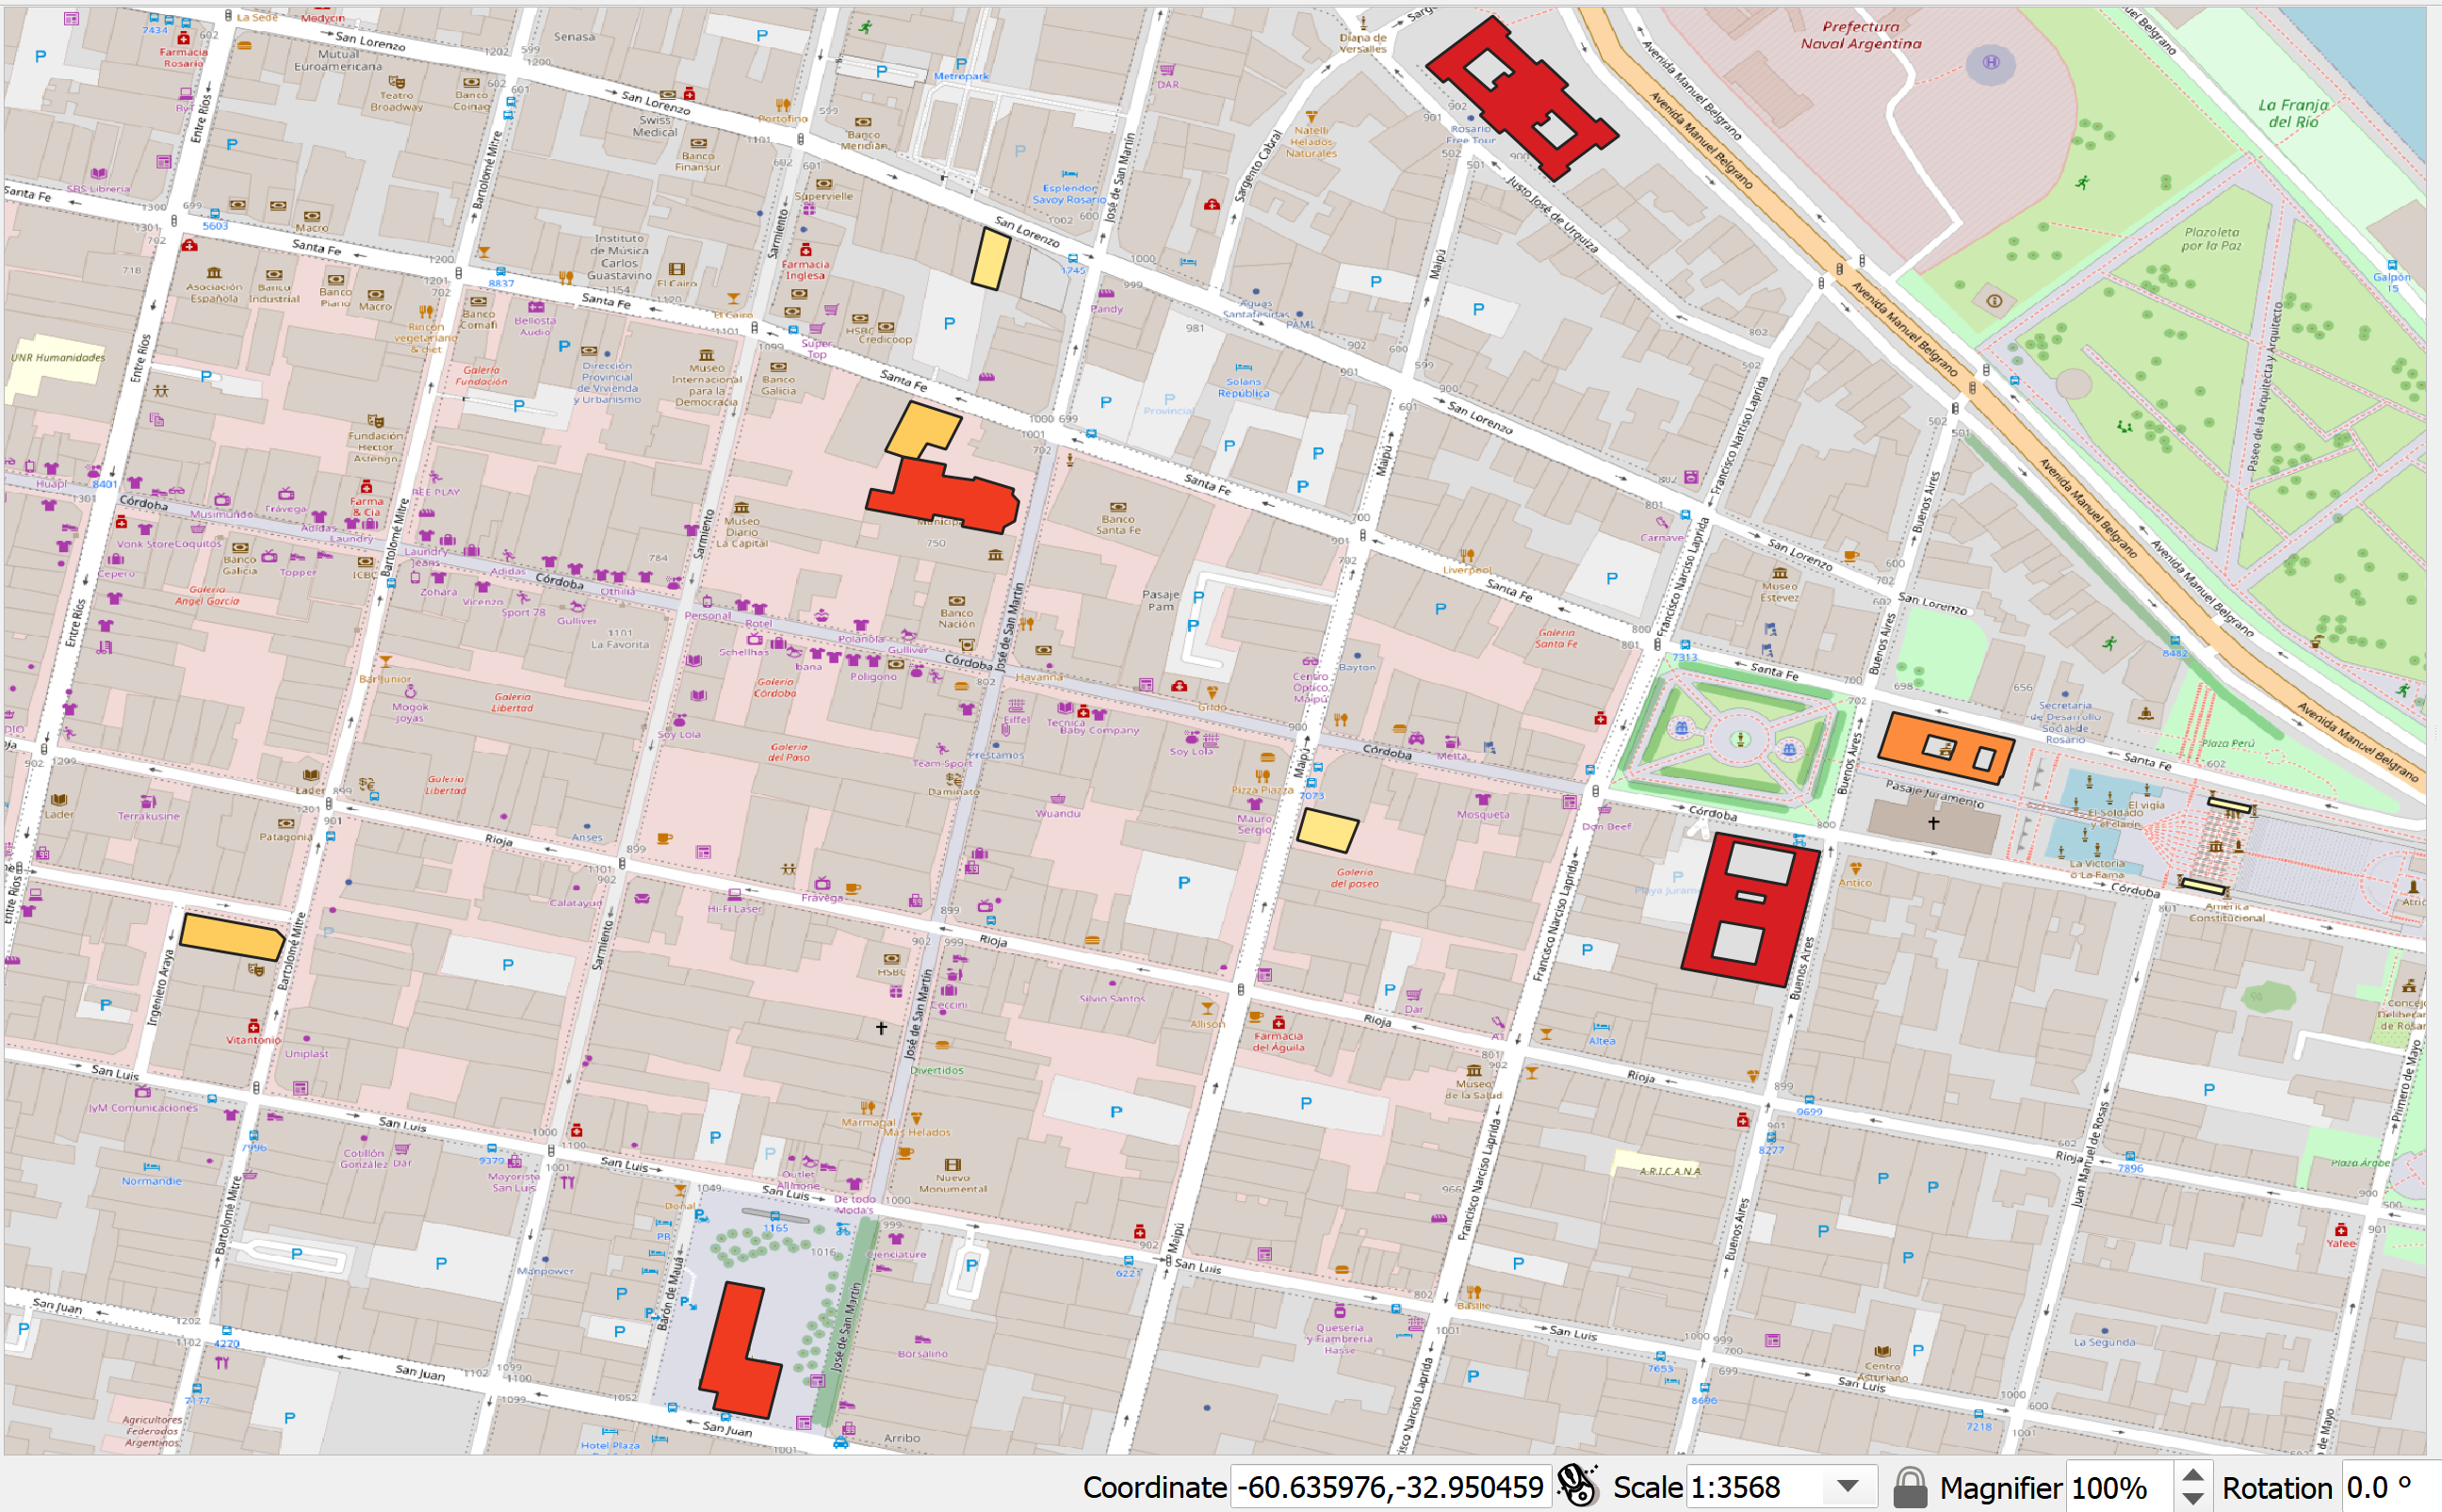
Figure 2.14: Layer Visualizations