Chapter 5 Results and outputs
Rosario results
The results for the electricity balance of 34 government operated buildings in the city of Rosario are presented in 5.1, 3 buildings did not have the electricity consumption data. The total annual renewable electricity production potential (for 37 buildings) is 14,921.49 \(mWh\), and the total annual electricity consumption is 1,388.016 \(mWh\), therefore the annual renewable electricity balance is 12,812.970 \(mWh\).
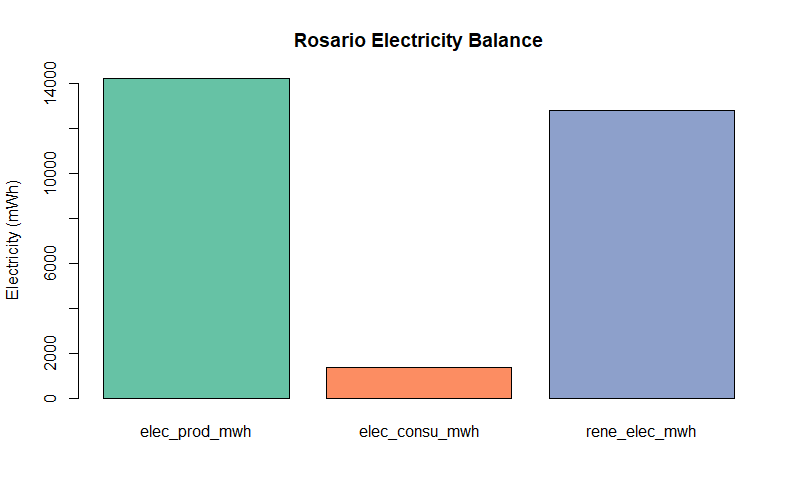
Figure 5.1: Rosario Renewable Electricity Balance
The minimum value for the annual electricity production of 37 municipal buildings, is 29.86 \(mWh\), the maximum value is 2,224.67 \(mWh\) and the mean value is 403.28 \(mWh\). The minimum value for annual electricity consumption for 34 buildings, is 3.064 \(mWh\), the maximum value is 414.480 \(mWh\) and the mean value is 40.824 \(mWh\). And, the minimum value of the renewable electricity balance, is -116.1 \(mWh\), the maximum value is 1810.2 \(mWh\) and the mean value is 376.9 \(mWh\).
For all the buildings extracted from OSM in the administrative borders of Rosario, including the government operated buildings but excluding buildings equal to or under 30 \(m^2\), a total of 9,783 buildings, the total renewable electricity production potential is 1,449,576 \(mWh\).
When estimating renewable electricity potential for the whole city of Rosario, the sampling design that had the best estimate was samples 1 and 2 combined with a total of 400 digitized building rooftops. The sample estimated a total of 9,704,559 \(mWh\) renewable electricity production potential with a standard error of 2,441,361 \(mWh\), and a 95% confidence interval of 5,679,532 \(mWh\), 13,729,586 \(mWh\) for Rosario’s 357,126 buildings. Thus, there is a 95% probability that the total renewable electricity production potential for Rosario is between 5,679,532 to 13,729,586 \(mWh\). However, sample 2 with 300 digitized building rooftops presented less variation (\(s^2\)=15,541.21 \(mWh\)) than both samples combined (\(s^2\)=18,714.05 \(mWh\)) and produced the second-best estimate compared to the other samples collected.
La Plata results
The total annual renewable electricity production potential for La Plata’s 105 government operated buildings is 35,961.04 \(mWh\), where the minimum value is 9.998 \(mWh\), the maximum value is 5016.660 \(mWh\) and the mean value is 349.136 \(mWh\). For all the buildings extracted from OSM in the administrative borders of La Plata, including government operated buildings but excluding buildings equal to or under 30 \(m^2\), a total of 2,657 buildings, the total renewable electricity production potential is 44,6342.8 \(mWh\). The distribution of the renewable electricity production potential for the OSM buildings in La Plata- the minimum value is 6.801 \(mWh\), the maximum value is 10,541.243 \(mWh\) and the mean value is 167.987 \(mWh\).
When estimating renewable electricity potential for the whole city of La Plata, the sampling design that had the best estimate was samples 1 and 2 combined with a total of 400 digitized building rooftops, the largest sample collected. The sample estimated a total of 185,069.23 \(mWh\) renewable electricity production potential with a standard error of 36,207.84 \(mWh\), and a 95% confidence interval of 125,374.03 \(mWh\), 244,764.4 \(mWh\) for La Plata’s 2,482 buildings. Accordingly, there is a 95% probability that the total renewable electricity production potential for La Plata is between 125,374.03 to 244,764.4 \(mWh\). Though, the allocated stratified sample with 100 digitized building rooftops presented less variation (\(s^2\)=25,362.42 \(mWh\)) and produced the second-best estimate compared to the other samples collected. This sample estimated a total of 72,761.47 \(mWh\) renewable electricity production potential with a standard error of 38,722.83 \(mWh\), and a 95% confidence interval of 8,466.42 \(mWh\), 137,056.5 \(mWh\) for La Plata’s 2,482 buildings.
Limitations
The main limitations of this guide are related to the use of only open-source data. A particular issue when dealing with building data in OSM is the fact that there is no information about the building’s mapping procedure. Mostly, buildings are mapped in OSM by tracing their footprint using aerial imagery to define areas covering the shape of the building. But it can be difficult to distinguish the footprint of the building from its shadow and its roof shape, as satellite imagery is usually taken from a certain angle. Additionally, the GHI layer considers the solar radiation on a horizontal surface on Earth, although a rooftop is not necessarily horizontal and can be positioned diagonally. Furthermore, the spatial resolution of the layer is ~250 m, this might affect the accuracy of the results while buildings’ rooftops may have smaller areas. A solution in future work to these issues would be to estimate an Effective Photovoltaic-Available Roof Area (PVA) for the building rooftops as suggested by Singh and Banerjee. Another limitation concerning open-source data is the use of the QMS plugin tile map services imagery which has a global 1 m resolution. However, specifically for Argentina the plugin does not have the highest resolution, hence shade effects, trees, or other obstacles on the building rooftop cannot be avoided. Therefore, the digitization of building rooftops for spatial sampling is prone to errors. In future work, additional earth imagery can be evaluated such as Google Earth, to have a clearer point of view for existing obstacles while digitizing the sample of building rooftops. This leads to a supplementary limitation regarding sampling collection. A better and more accurate estimate would be possible if additional time was available to collect more samples and compare between them, especially using stratification for built-up and non-built-up area.
The following sections present the outputs of the guide. The outputs can be divided to web maps and sampling analysis results.
Web Maps:
The web maps are a result of the steps completed in chapters 2 and 3. The web maps are hosted on GitHub Pages.
Sampling Analysis:
The sampling analysis is a result of the steps completed in chapter 4. These analyses are hosted on RStudio Connect.
Sampling analysis for Rosario
Sampling analysis for La Plata