Chapter 2 Mapping electricity consumption
For mapping the building electricity consumption of municipal buildings, we will use the QGIS interface. For this chapter and chapter 3 we will use data from the city of Rosario, Argentina. Once we start QGIS, we immediately open an untitled new project, to save the project click on the Project icon on the menu bar (which provides access to QGIS functions using standard hierarchical menus) click on the Save As… button there we can decide the project name and in which directory we want to save our project. Every time we make changes we can click the save button and our project will be automatically saved. (See 2.1)
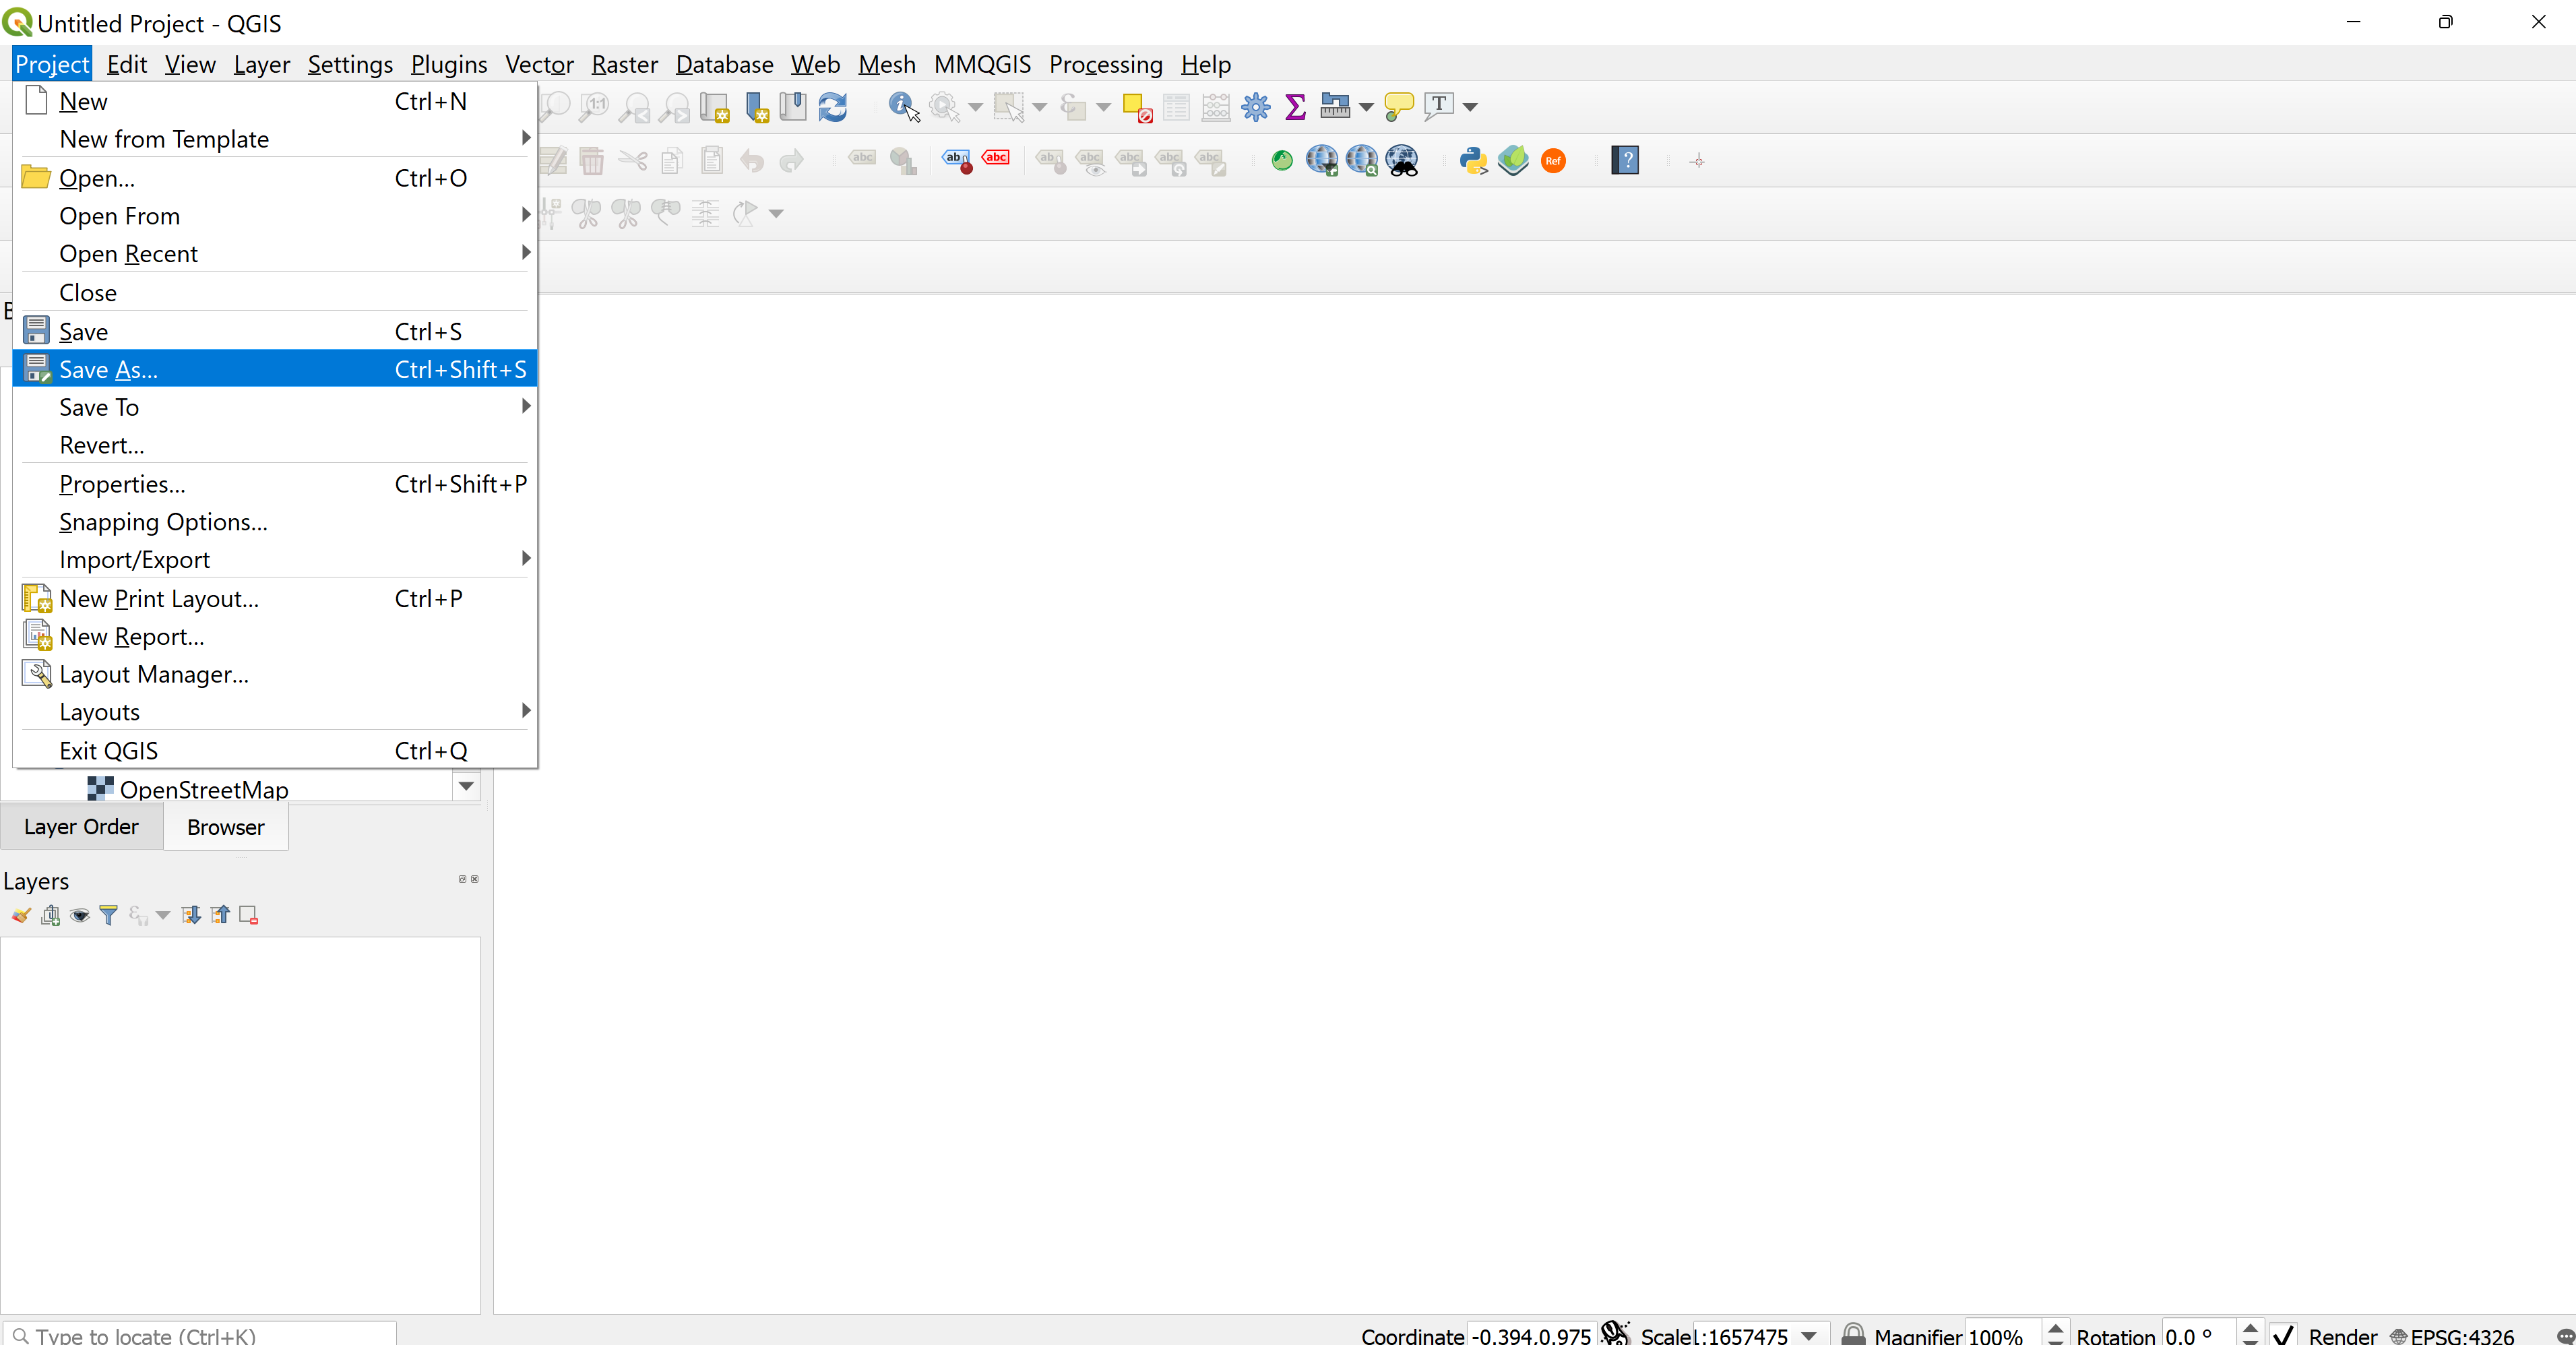
Figure 2.1: Save QGIS Project