13.5 Embed an interactive 3D plot with rgl
The rgl package (Murdoch and Adler 2025) can be used to generate interactive 3D plots. These plots can still be interactive if they are saved to the WebGL format, which can be done through a hook function rgl::hook_webgl(). Below is an example that shows you how to set up rgl and knitr so 3D plots can be saved while preserving the interactivity:
---
title: Embed 3D plots with rgl
output: html_document
---

Set up a hook to save **rgl** plots:

```{r, setup}
library(rgl)
knitr::knit_hooks$set(webgl = hook_webgl)
```

See if it works for this 3D plot after we enable the hook
via the chunk option `webgl = TRUE`:

```{r, test-rgl, webgl=TRUE}
x <- sort(rnorm(1000))
y <- rnorm(1000)
z <- rnorm(1000) + atan2(x,y)
plot3d(x, y, z, col = rainbow(1000))
```
You should get an interactive 3D scatterplot like Figure 13.3 after you compile this example. Note that the interactive plots only work when the output format is HTML.
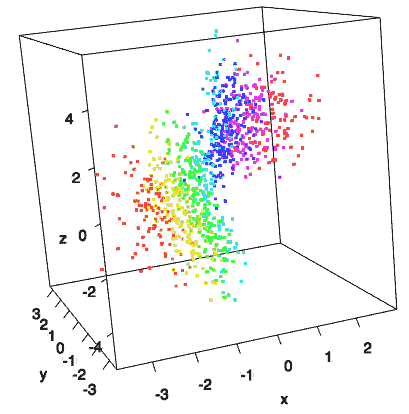
FIGURE 13.3: A 3D scatterplot generated from the rgl package.
References
Murdoch, Duncan, and Daniel Adler. 2025. Rgl: 3d Visualization Using OpenGL. https://github.com/dmurdoch/rgl.