6.6 LaTeX sub-figures
Sometimes you may want to include multiple images in a single figure environment. Sub-figures allow us to achieve this by arranging multiple images within a single environment and providing each with its own sub-caption.
Sub-figures require the LaTeX package subfig. We can load it via the extra_dependencies YAML option within the pdf_document output. For example:
---
output:
  pdf_document:
    extra_dependencies: "subfig"
---
To arrange all plots from a code chunk in sub-figures, you have to use the chunk options fig.cap (the caption for the whole figure environment) and fig.subcap (a character vector of the captions for sub-figures). For best output, you can also use the following options:
fig.ncol: The number of columns of sub-figures. By default, all plots are arranged in a single row. You can break them into multiple rows.out.width: The output width of individual plots. You will normally set this to100%divided by the number of columns. For example, if you have two plots, theout.widthoption should be equal to or less than50%, otherwise the plots may exceed the page margin.
Below is an illustrative example:
---
output:
  pdf_document:
    extra_dependencies: "subfig"
---
```{r, fig.cap='Figure 1', fig.subcap=c('(a)', '(b)', '(c)')}
plot(1:10)
plot(cars, pch = 19)
boxplot(Sepal.Width ~ Species, data = iris)
```The output is shown in Figure 6.2. For the sake of simplicity, we omitted a few chunk options in the chunk header of the above example, including fig.ncol = 2, out.width = "50%", fig.align = "center", and the actual long captions.
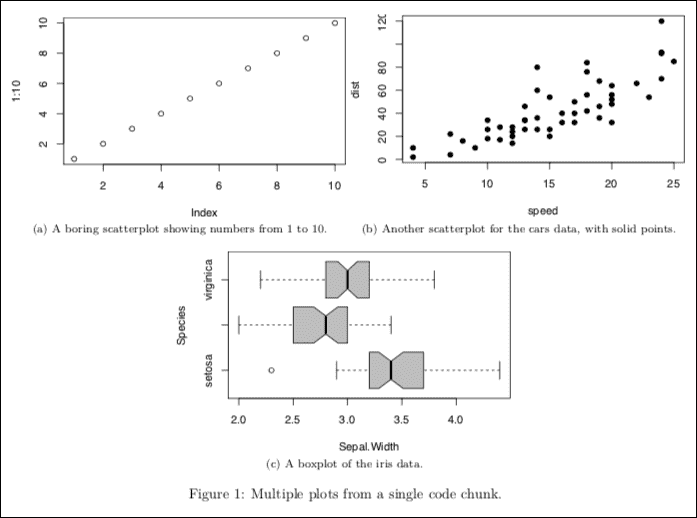
FIGURE 6.2: An example of one figure environment containing multiple sub-figures.