12.5 Output figures in the HTML5 format
By default, plots in R Markdown are included in the tag <img src="..." /> in a <p> or <div> tag in the HTML output. This example below shows how to use the HTML5 <figure> tag to display plots.
---
title: Output figures in `<figure>` tags
output: html_document
---

Given a plot file path `x` and a figure caption in the chunk
option `options$fig.cap`, we want to write the plot in the
HTML5 tag in this form:

```html
<figure>
  <img src="PATH" alt="CAPTION" />
  <figcaption>CAPTION</figcaption>
</figure>
```

Now we redefine the `plot` hook (only when the output format
is HTML):

```{r}
if (knitr::is_html_output()) knitr::knit_hooks$set(
  plot = function(x, options) {
    cap  <- options$fig.cap  # figure caption
    tags <- htmltools::tags
    as.character(tags$figure(
      tags$img(src = x, alt = cap),
      tags$figcaption(cap)
    ))
  }
)
```

The plot from the code chunk below will be placed in the
`<figure>` tag:

```{r, fig.cap='A scatterplot for the cars data.'}
par(mar = c(4.5, 4.5, .2, .2))
plot(cars, pch = 19, col = 'red')
```

We add some CSS styles to "see" the `<figure>` and
`<figcaption>` tags better (the `figure` has a dashed
border, and the caption has a light pink background):

```{css, echo=FALSE}
figure {
  border: 2px dashed red;
  margin: 1em 0;
}
figcaption {
  padding: .5em;
  background: lightpink;
  font-size: 1.3em;
  font-variant: small-caps;
}
```
The figure output is shown in Figure 12.2. Note that we actually overrode the default plot hook in this example, while most other examples in this chapter build custom hooks on top of the default hooks. You should completely override default hooks only when you are sure you want to ignore some built-in features of the default hooks. For example, the plot hook function in this case did not consider possible chunk options like out.width = '100%' or fig.show = 'animate'.
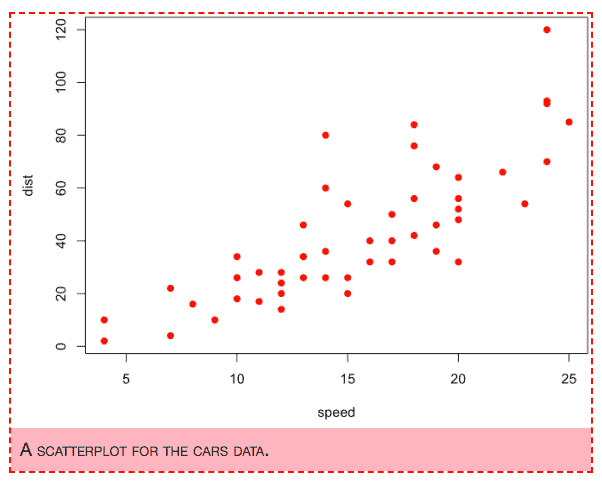
FIGURE 12.2: A figure in the HTML5 figure tag.
This example shows you what you can possibly do with the plot file path x in the plot hook. If all you need is to customize the style of figures, you do not have to use the HTML5 tags. Usually the default plot hook will output images in the HTML code like this:
<div class="figure">
  <img src="PATH" />
  <p class="caption">CAPTION</p>
</div>
So you can just define css rules for div.figure and p.caption.