1 Introduction
1.1 Why do we need to learn R
SPSS、Jamovi 不香么?为什么还要花时间去学一门新的编程语言?
理由:R 在业界和学界都有广泛的运用,对于未来打算从事任何与数据的分析和处理有关的岗位, 学习和掌握 R 都是一个不错的选择,可以成为你的武器库中的一把趁手的兵器。
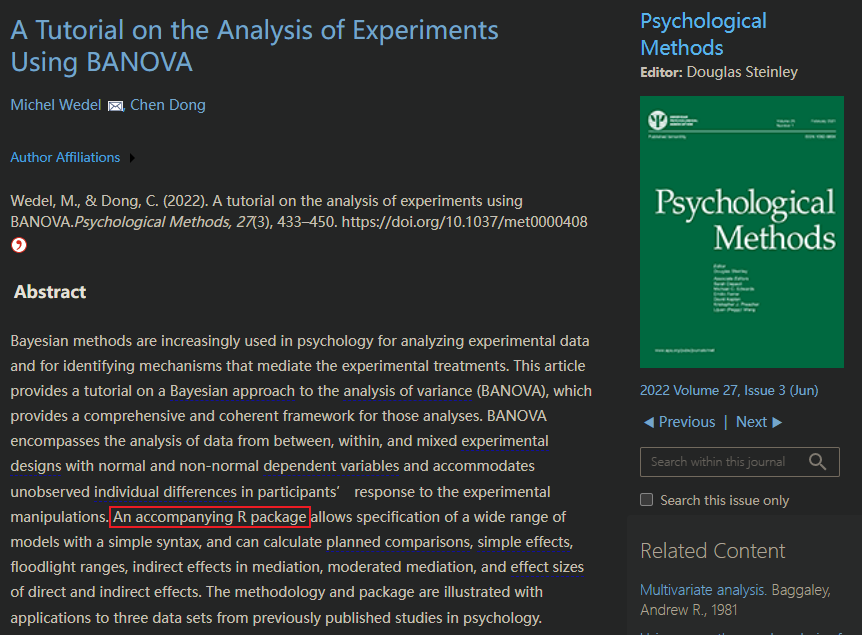
学术用途示例:
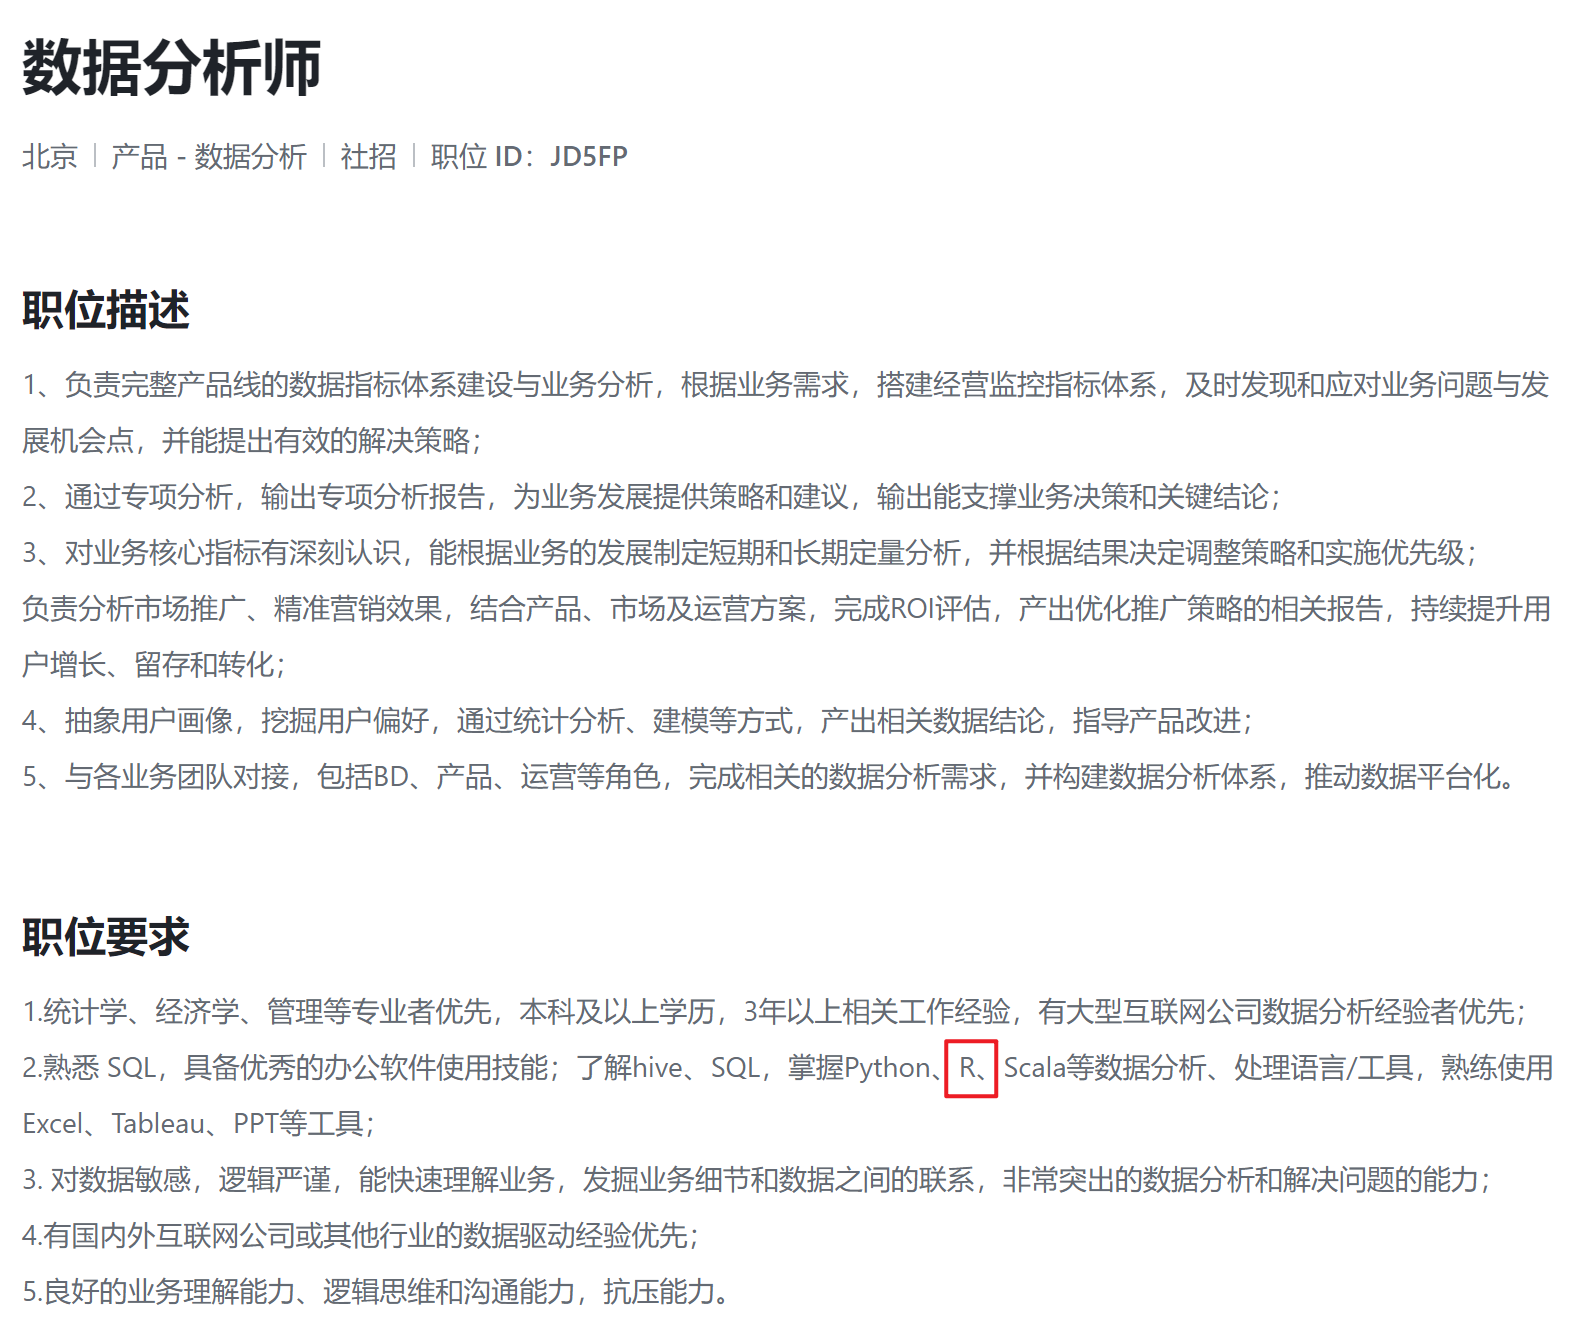
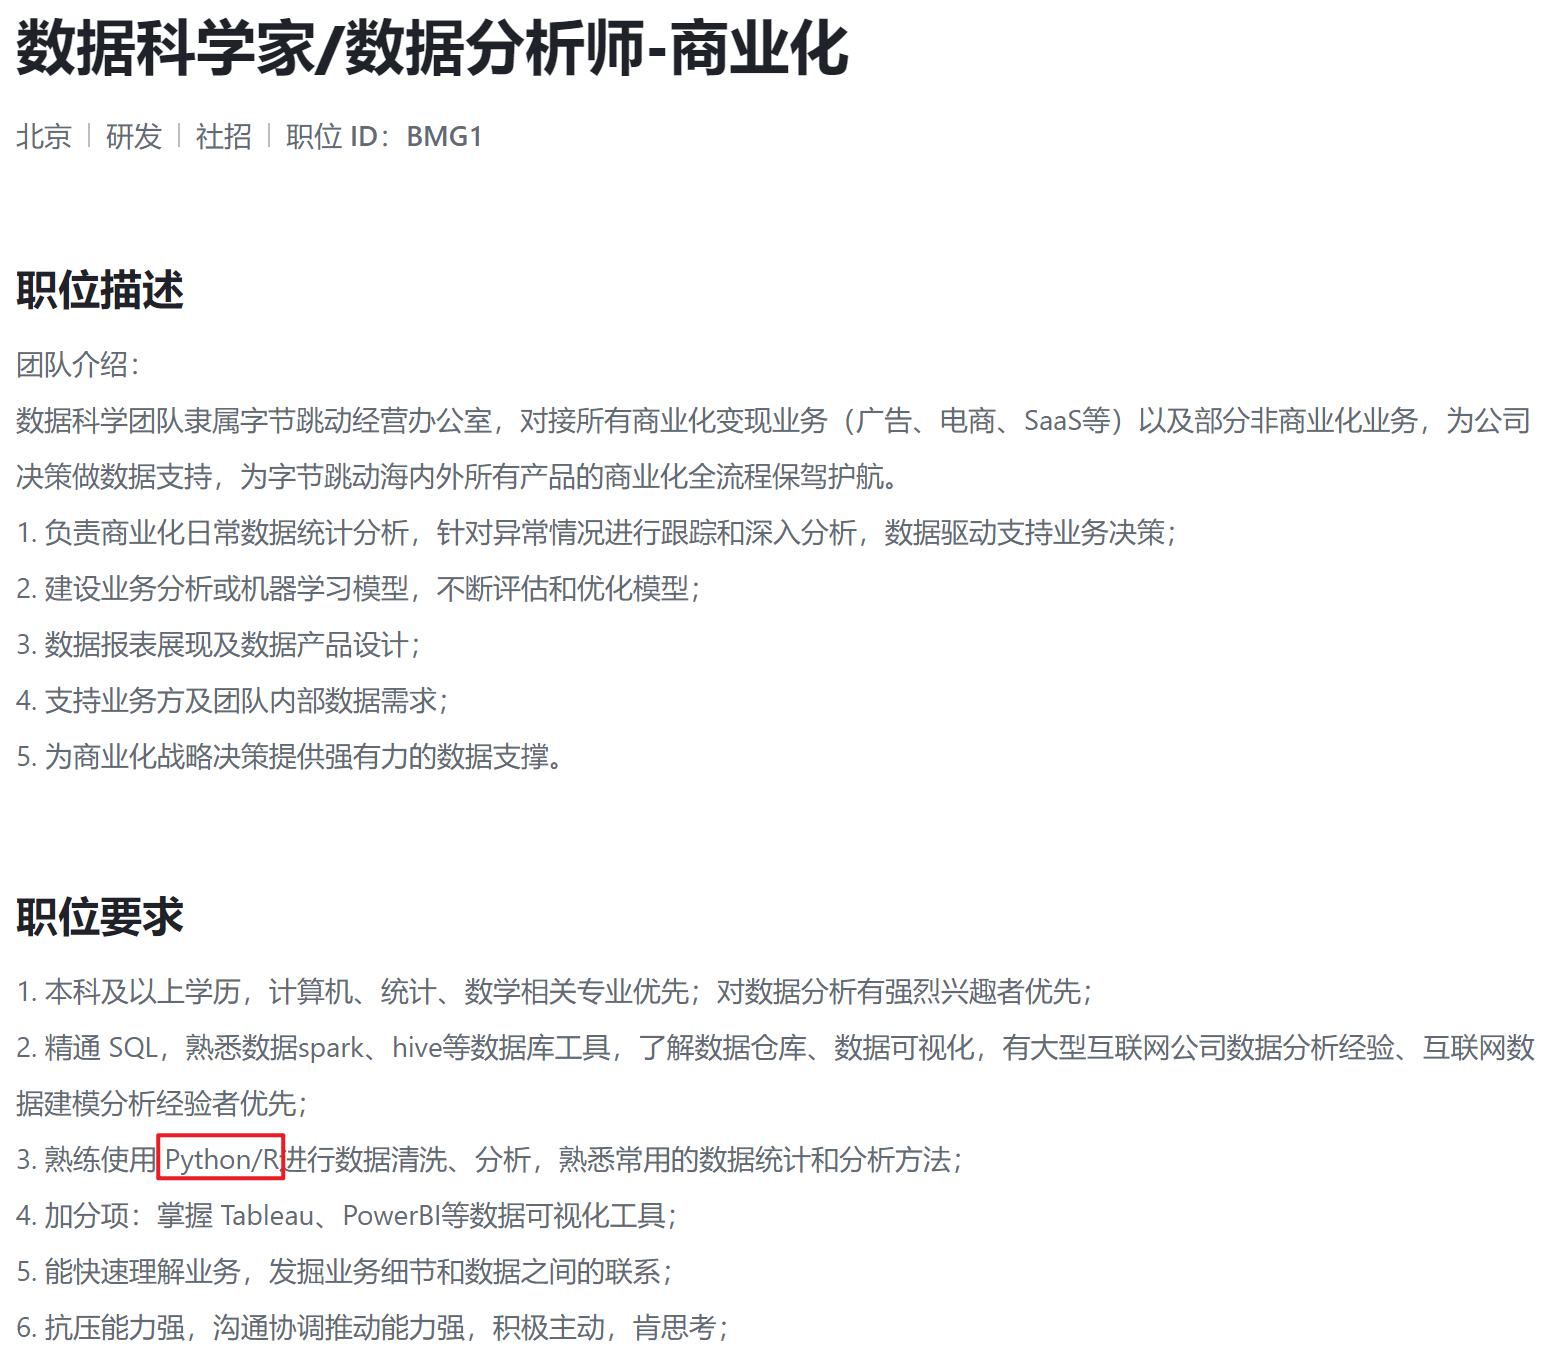
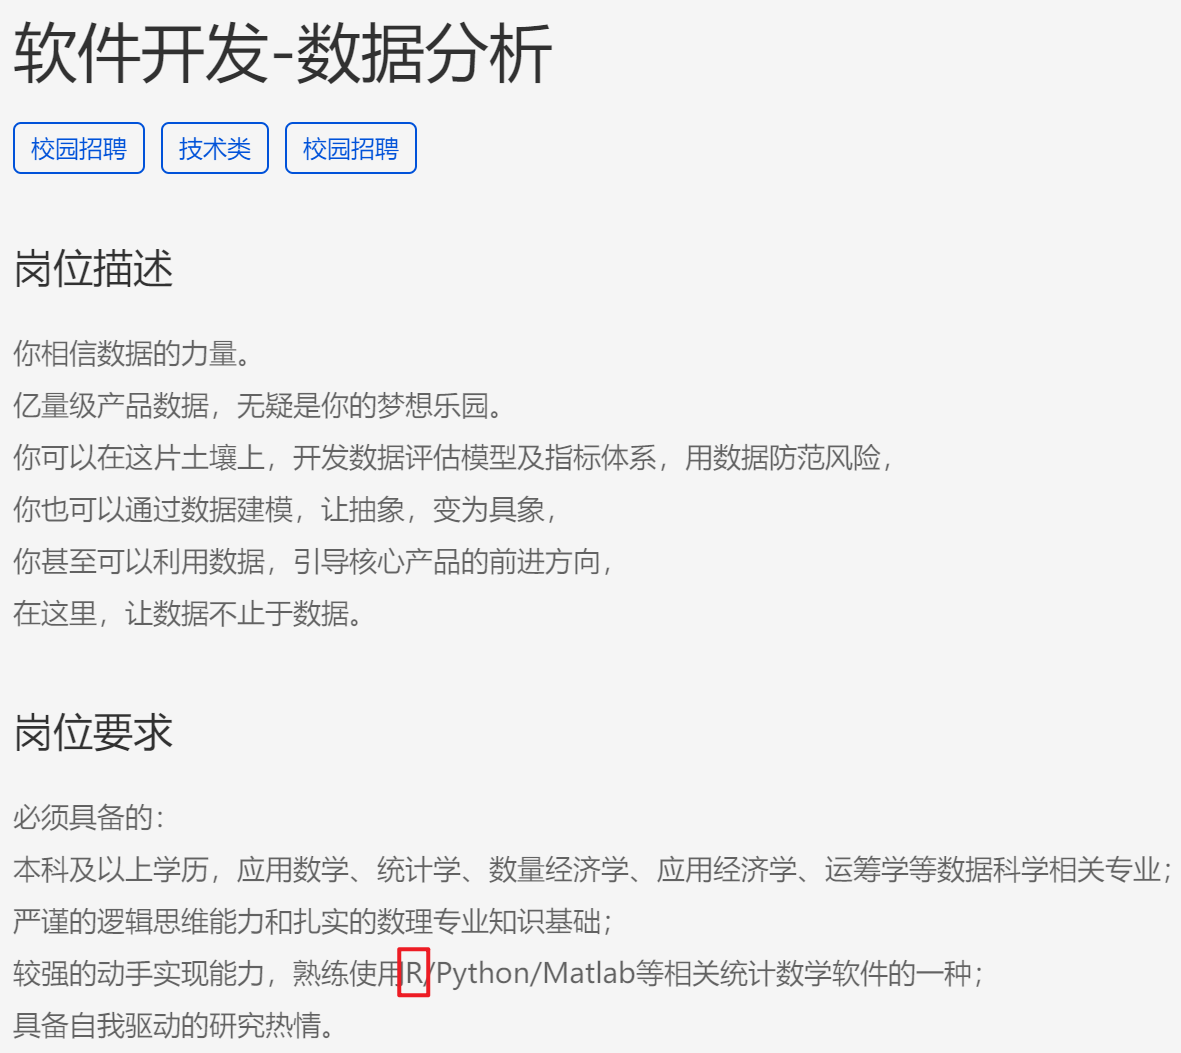
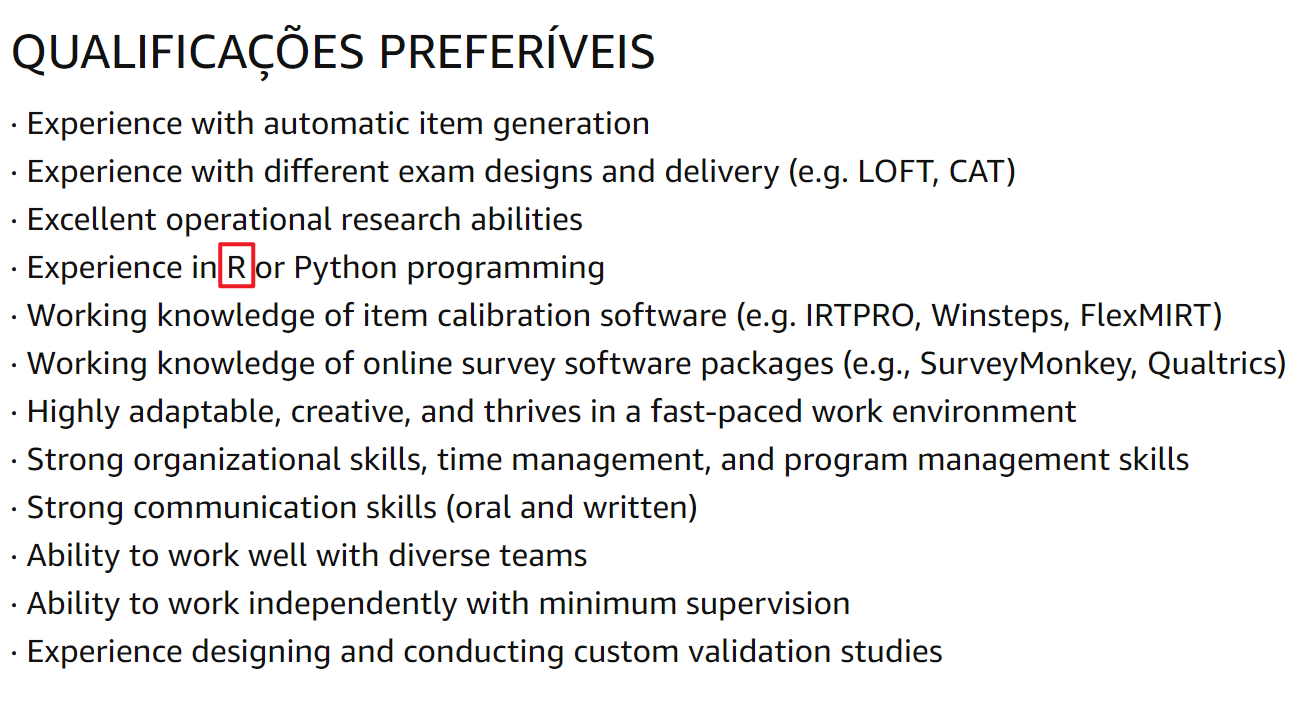
业界示例,数据分析师岗位:
- 字节跳动
- 腾讯
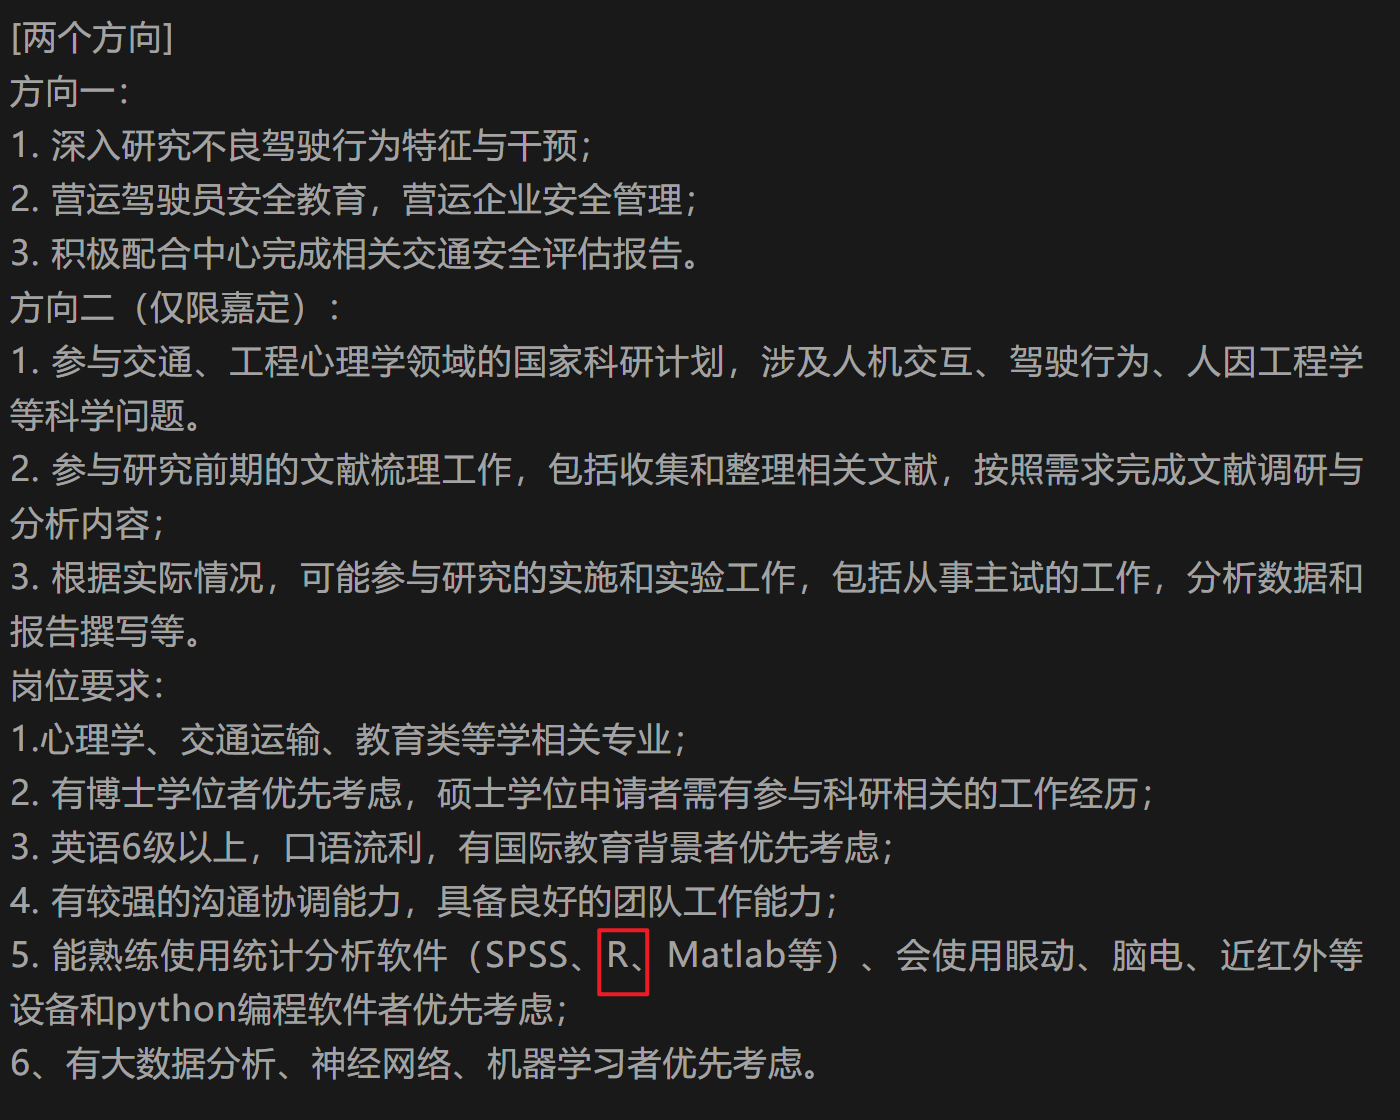
学界示例,科研助理招聘、研究员:
- 科研助理
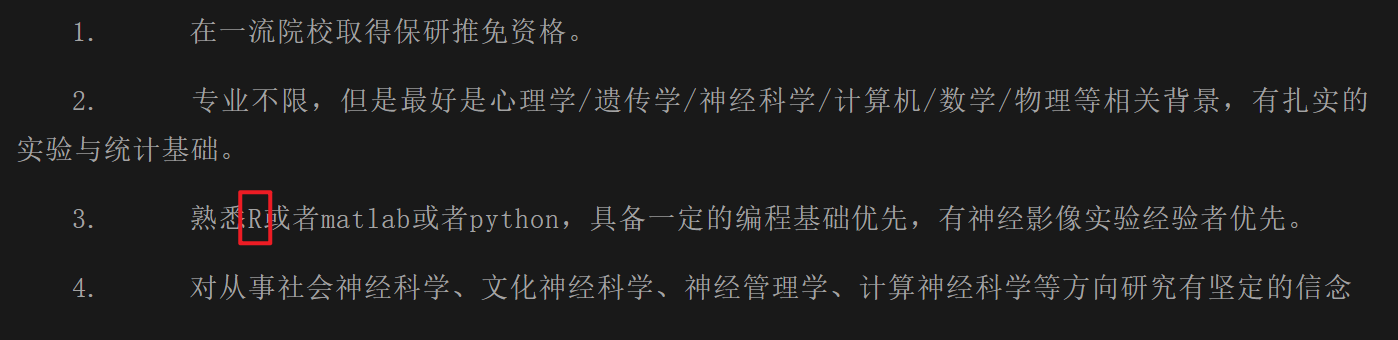
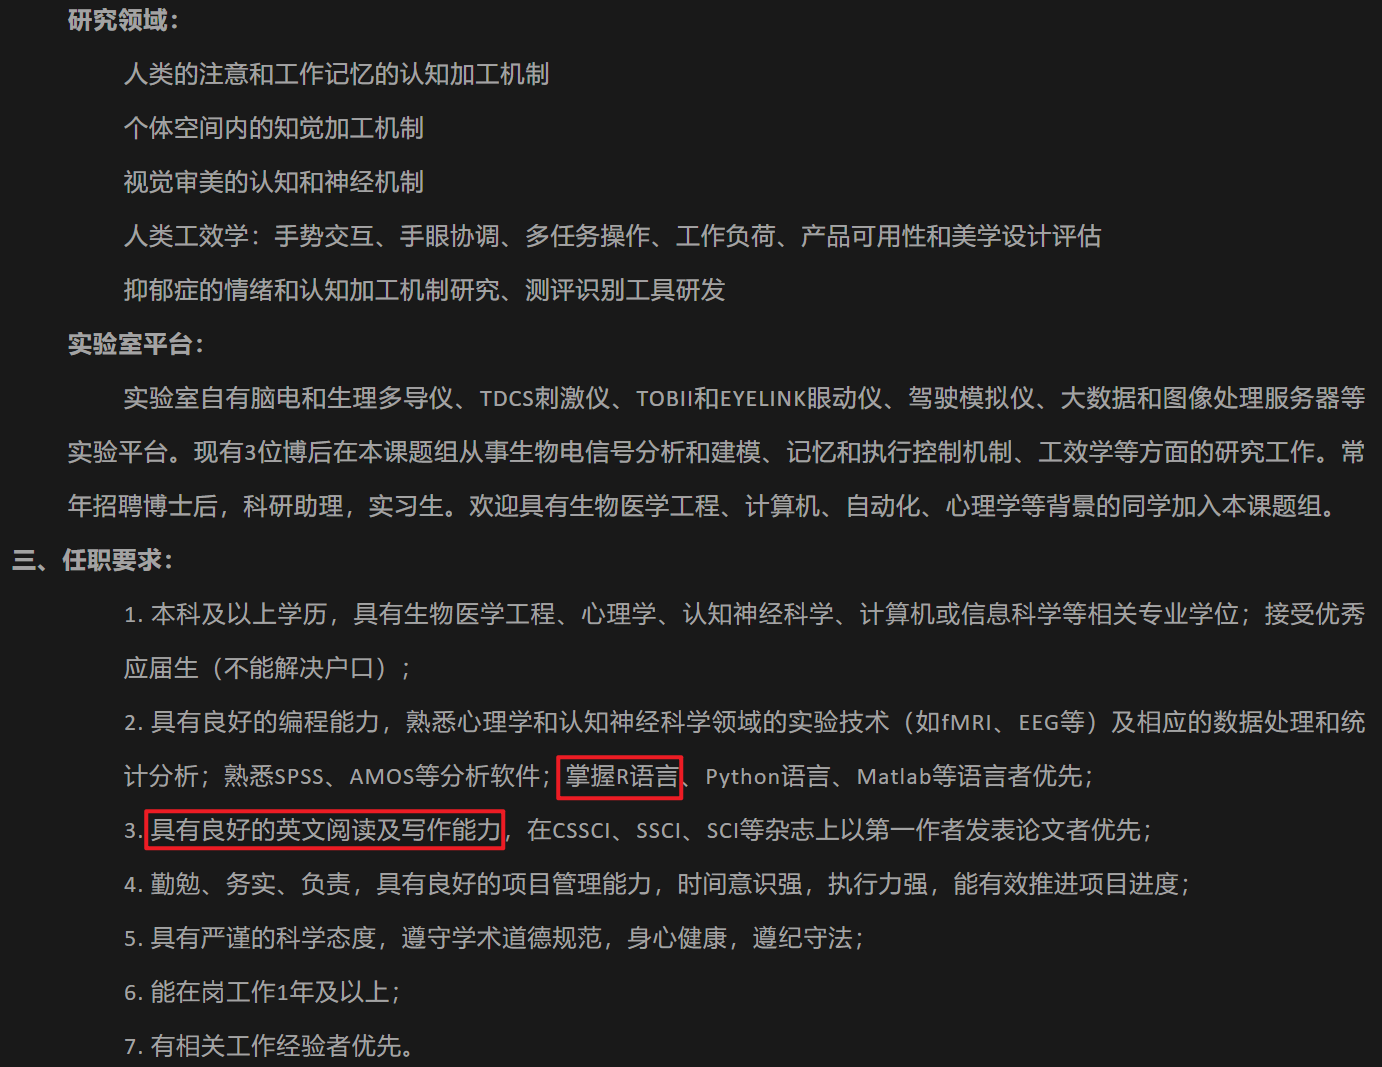

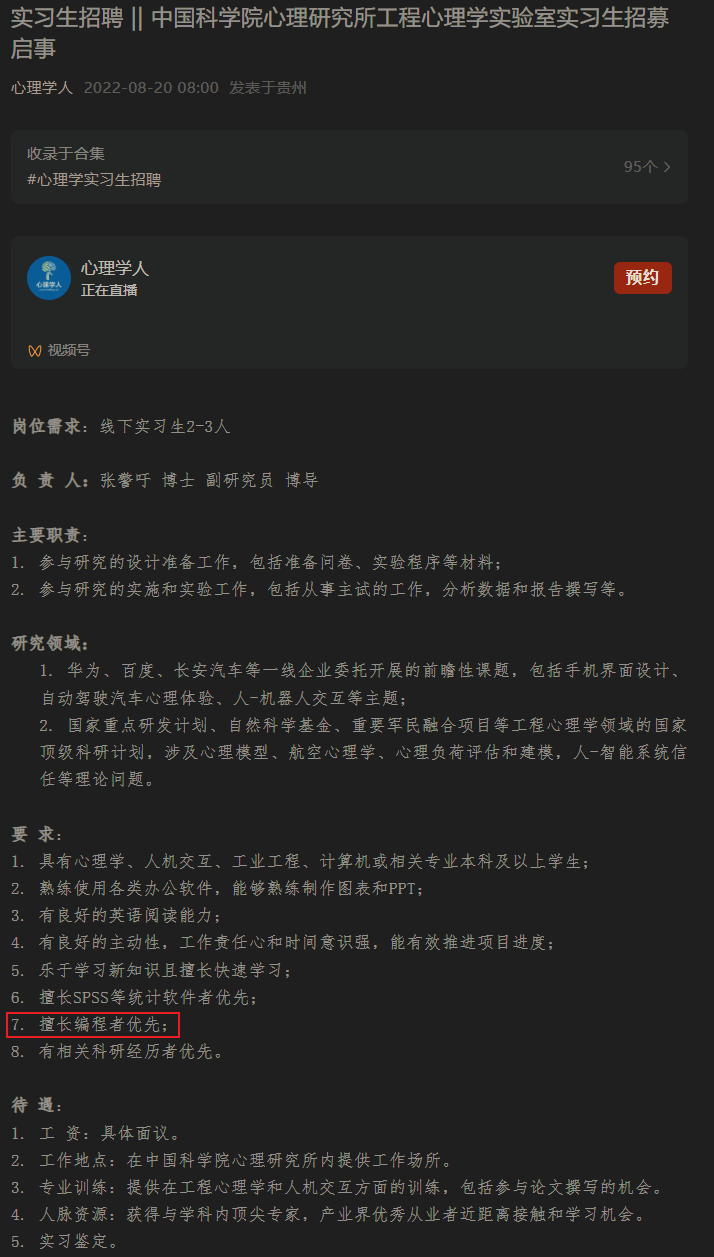
- 保研\直博
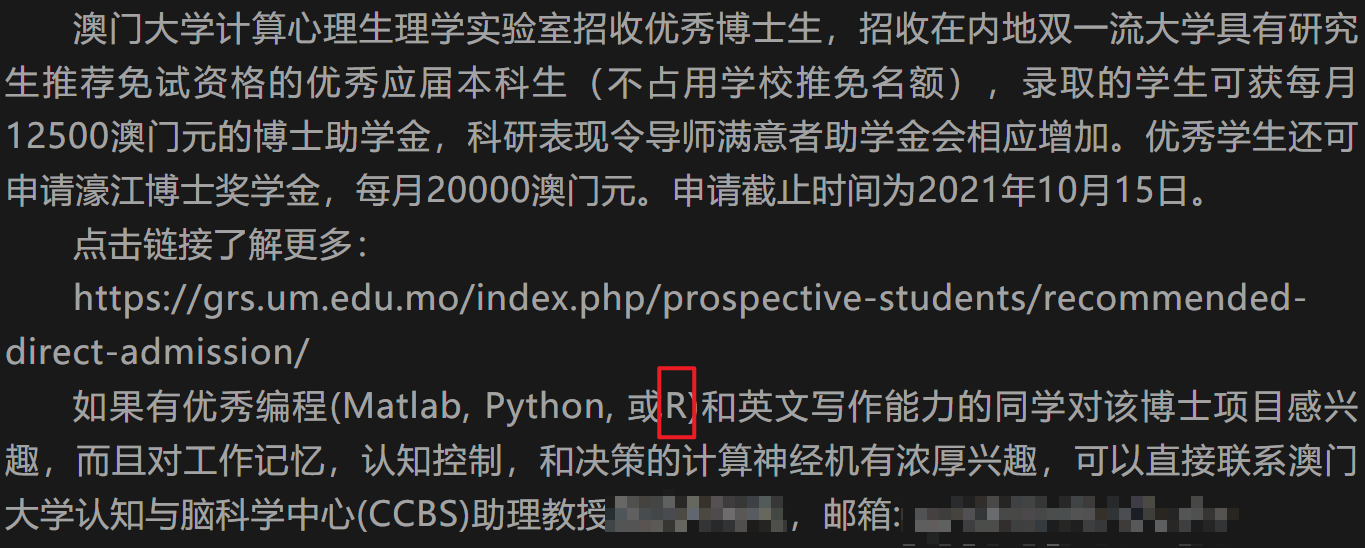
- 研究员(亚马逊 research scientist)
- 实习生
1.2 What & How & Grading
1.2.1 What to learn
教学内容分为两大块,基础和进阶。基础部分介绍 R 语言的基本要素和语法结构,进阶部分学习如何运用基础部分学到的知识完成不同领域中复杂但通用的任务类型。详细课程内容见目录。
1.2.2 How to learn
1.2.2.1 Learning programming is just like leaning a new language
例如以下语句:
exam_1st <- read.table(file = "exam_1st.txt")  # 读取第 1 次考试的数据
exam_2nd <- read.table(file = "exam_2nd.txt")  # 读取第 2 次考试的数据
rank_1st <- order(exam_1st$scores, decreasing = TRUE)  # 第 1 次考试的成绩降序排列
rank_2nd <- order(exam_2nd$scores, decreasing = TRUE)  # 第 2 次考试的成绩降序排列
rank_change <- rank_2nd - rank_1st  # 计算排名变化
stu_improved <- exam_1st$ID[rank_change > 0]  # 找出排名变化为正的同学
stu_retrogressed <- exam_1st$ID[rank_change < 0]  # 找出排名变化为负的同学
stu_improvement_largest_three <- exam_1st$ID[order(
  rank_change,
  decreasing = TRUE
)][1:3]  # 找出排名变化最大的三位同学
看起来很复杂对不对,但其实就是一个很简单的目标任务:现有一个班前后两次考试的数据,现在需要依次找出进步的同学、退步的同学和进步最大的三位同学。这件任务如果不借助 R ,而是通过手动的方式来完成,相信每一位同学都会做,因为任务可以很清晰地分解以下几个步骤:
- 拿到两次考试的数据,里面应该包括学生的身份识别信息(学号、姓名等)和成绩;
- 分别将两次考试中学生的成绩由高到低排序;
- 将第二次考试中每一位同学的排名减去 Ta 在第一次考试中的排名,获得排名变化;
- 将排名变化是正数和负数的同学分别找出来,分别代表进步和退步的同学;
- 将排名变化最大的前三位找出来。
而只要懂得 R 的基本语法,就能够很轻松地写出上面这些代码。
学习英语相信大家都有经验,学习 R 的过程本质上就是 记忆知识点 + 阅读理解 + 任务分解 + 翻译,和学英语其实是十分类似的。每一句 R 代码就好比一个基本结构只有谓语和宾语的句子,句子的意思都是“操作了object(s),给操作产生的结果object起了个名字叫做xxx”。
- 记忆知识点(输入):体现在要能够记住诸如操作(<-、-、$、[])、函数(read.table() order())等基本知识点;
- 阅读理解(输入):体现在要能在储备了一定基本知识点的基础上,能够开始学习一些相对更复杂的代码,读懂每一句代码代表的意思,究竟是操作了什么object,有什么样的结果,为自己写代码打下基础;
- 任务分解:体现在要能在前两点的基础上,面临一个新的目标任务(如上面的例子),要能够把任务分解为清晰的步骤;
- 翻译(输出):把分解好的每一步骤翻译成 R 代码。
1.3 Introduction of R
R is a language and environment for statistical computing and graphics. It is a GNU project which is similar to the S language and environment which was developed at Bell Laboratories (formerly AT&T, now Lucent Technologies) by John Chambers and colleagues. The current R is the result of a collaborative effort with contributions from all over the world. R was initially written by Robert Gentleman and Ross Ihaka—also known as “R & R” of the Statistics Department of the University of Auckland. Since mid-1997 there has been a core group, the R Core Team, with write access to the R source.
R provides a wide variety of statistical (linear and nonlinear modelling, classical statistical tests, time-series analysis, classification, clustering, …) and graphical techniques, and is highly extensible.
节选自:
- R 语言官网: About R
- R 语言官网: Contributors
更多有关 R 的前世今生参见:R : Past and Future History
R includes
- a suite of operators for calculations on arrays, in particular matrices,
- a large, coherent, integrated collection of intermediate tools for data analysis (regression, factor analysis, etc.),
- graphical facilities for data analysis and display either on-screen or on hardcopy, and
- a well-developed, simple and effective programming language which includes conditionals, loops, user-defined recursive functions and input and output facilities.
R, like S, is designed around a true computer language, and it allows users to add additional functionality by defining new functions. For computationally-intensive tasks, C, C++ (Rcpp) and Fortran code can be linked and called at run time (for advanced user).
Many users think of R as a statistics system. We prefer to think of it as an environment within which statistical techniques are implemented. R can be extended (easily) via packages. There are about eight packages supplied with the R distribution and many more (18095) are available through the CRAN family of Internet sites covering a very wide range of modern statistics.
节选自 R 语言官网: About R
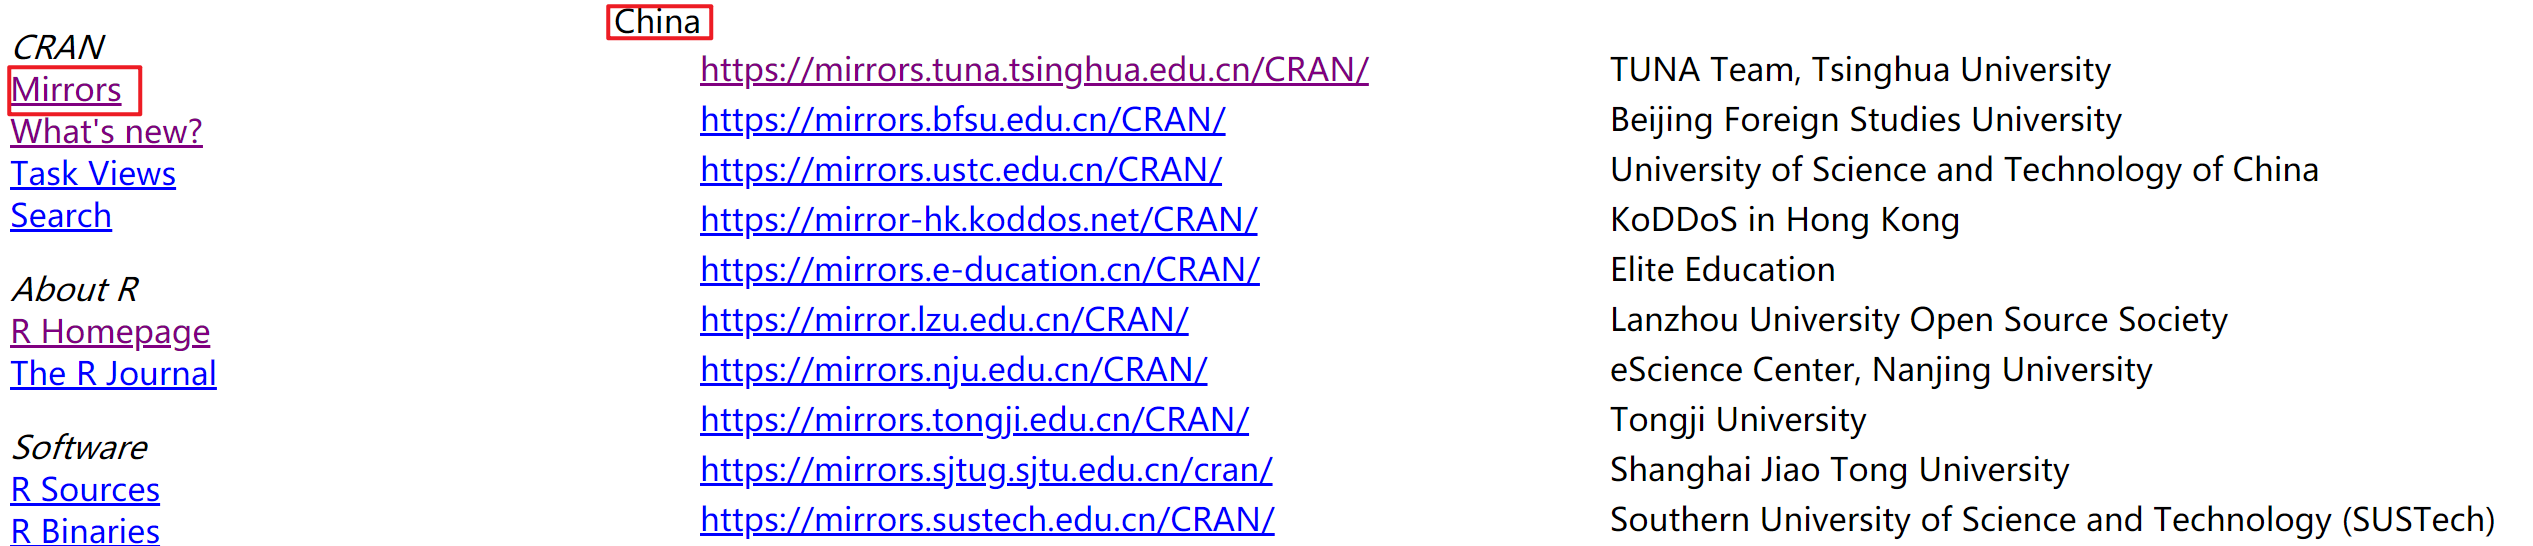
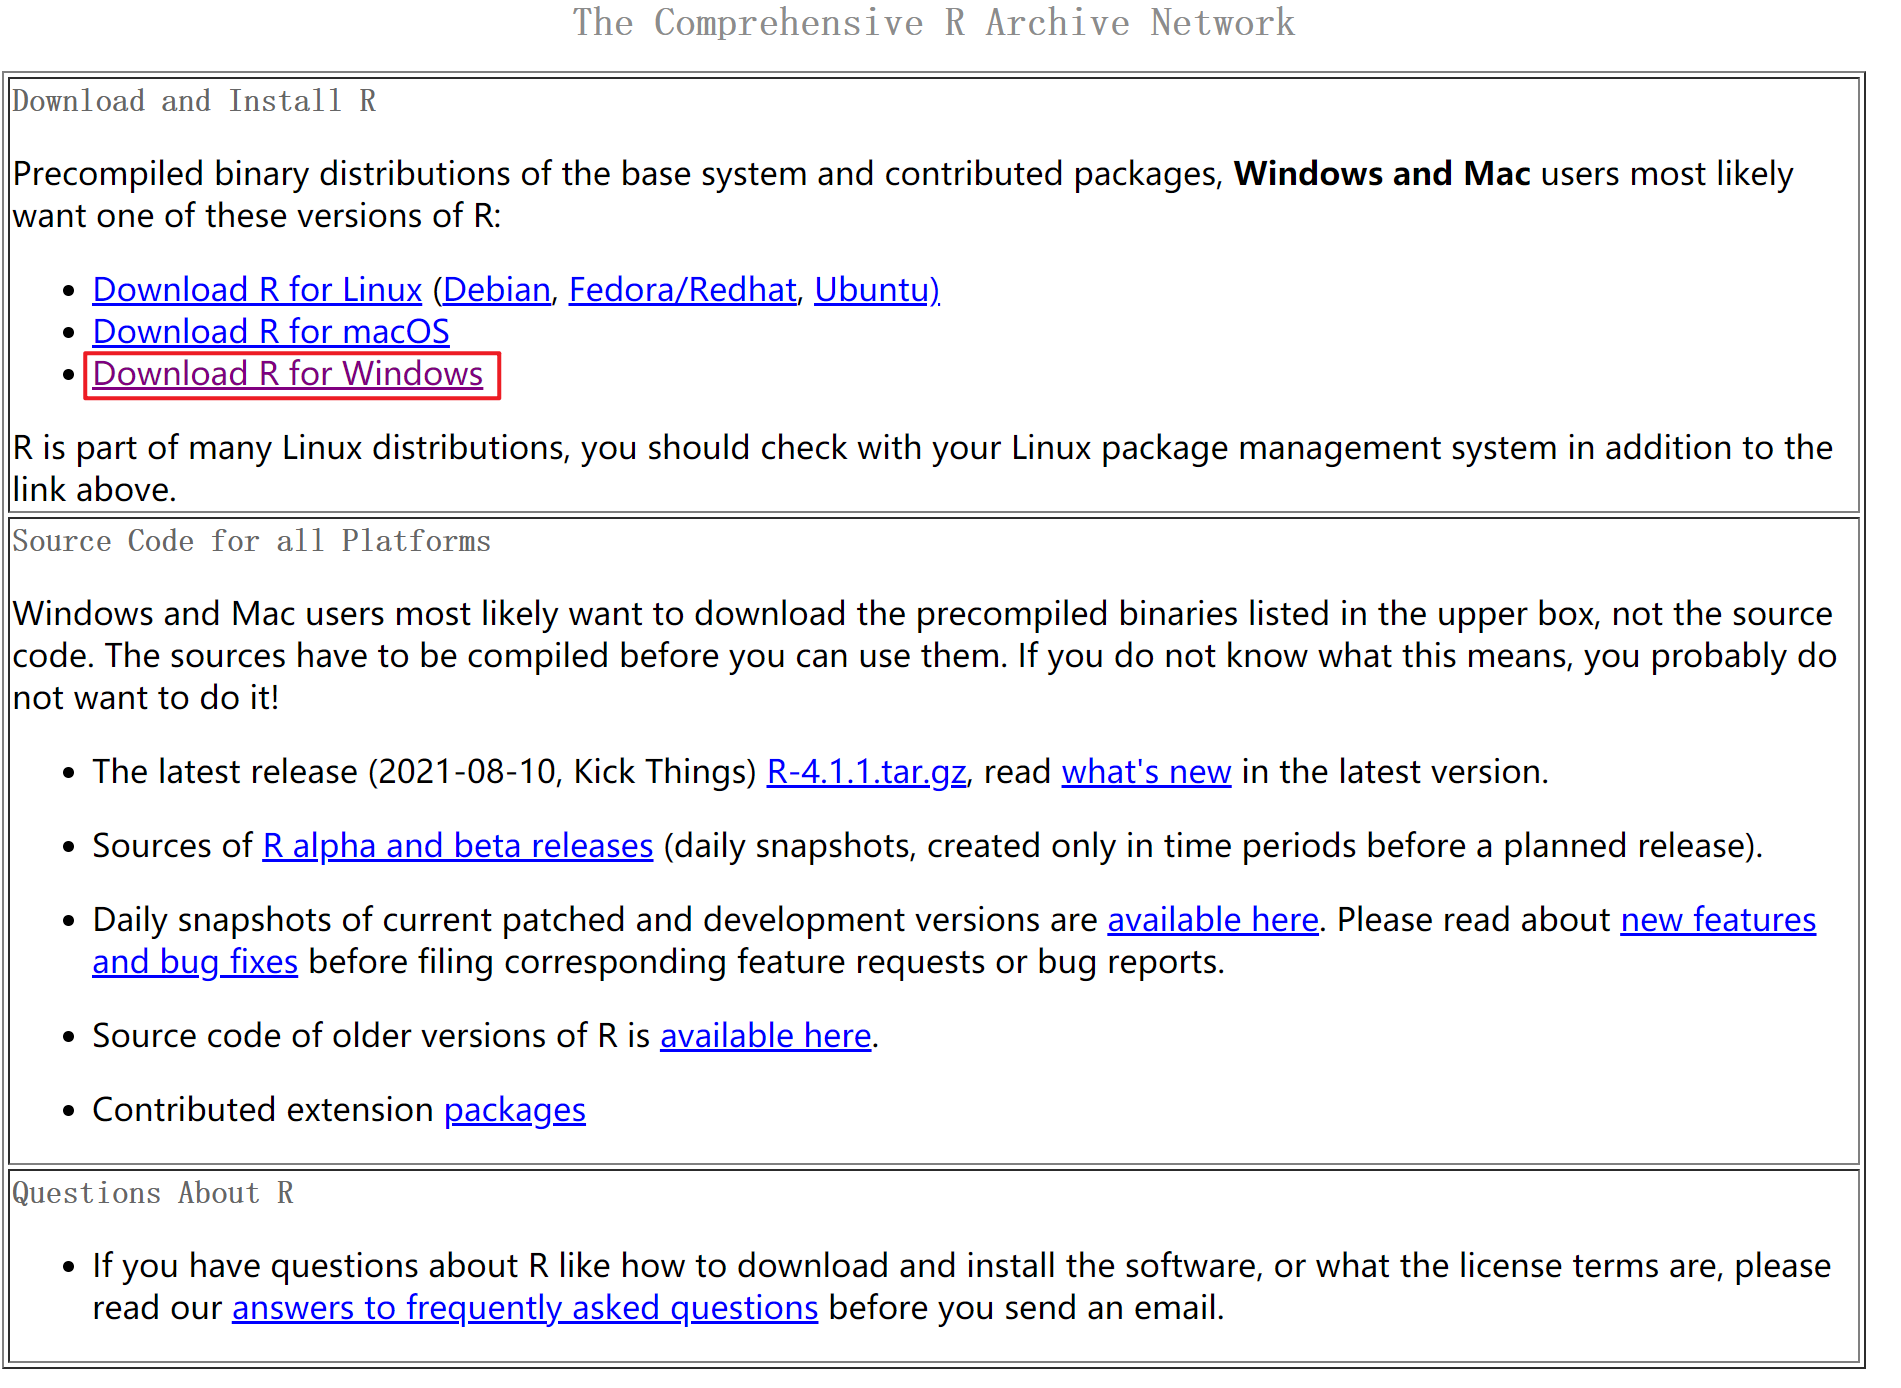
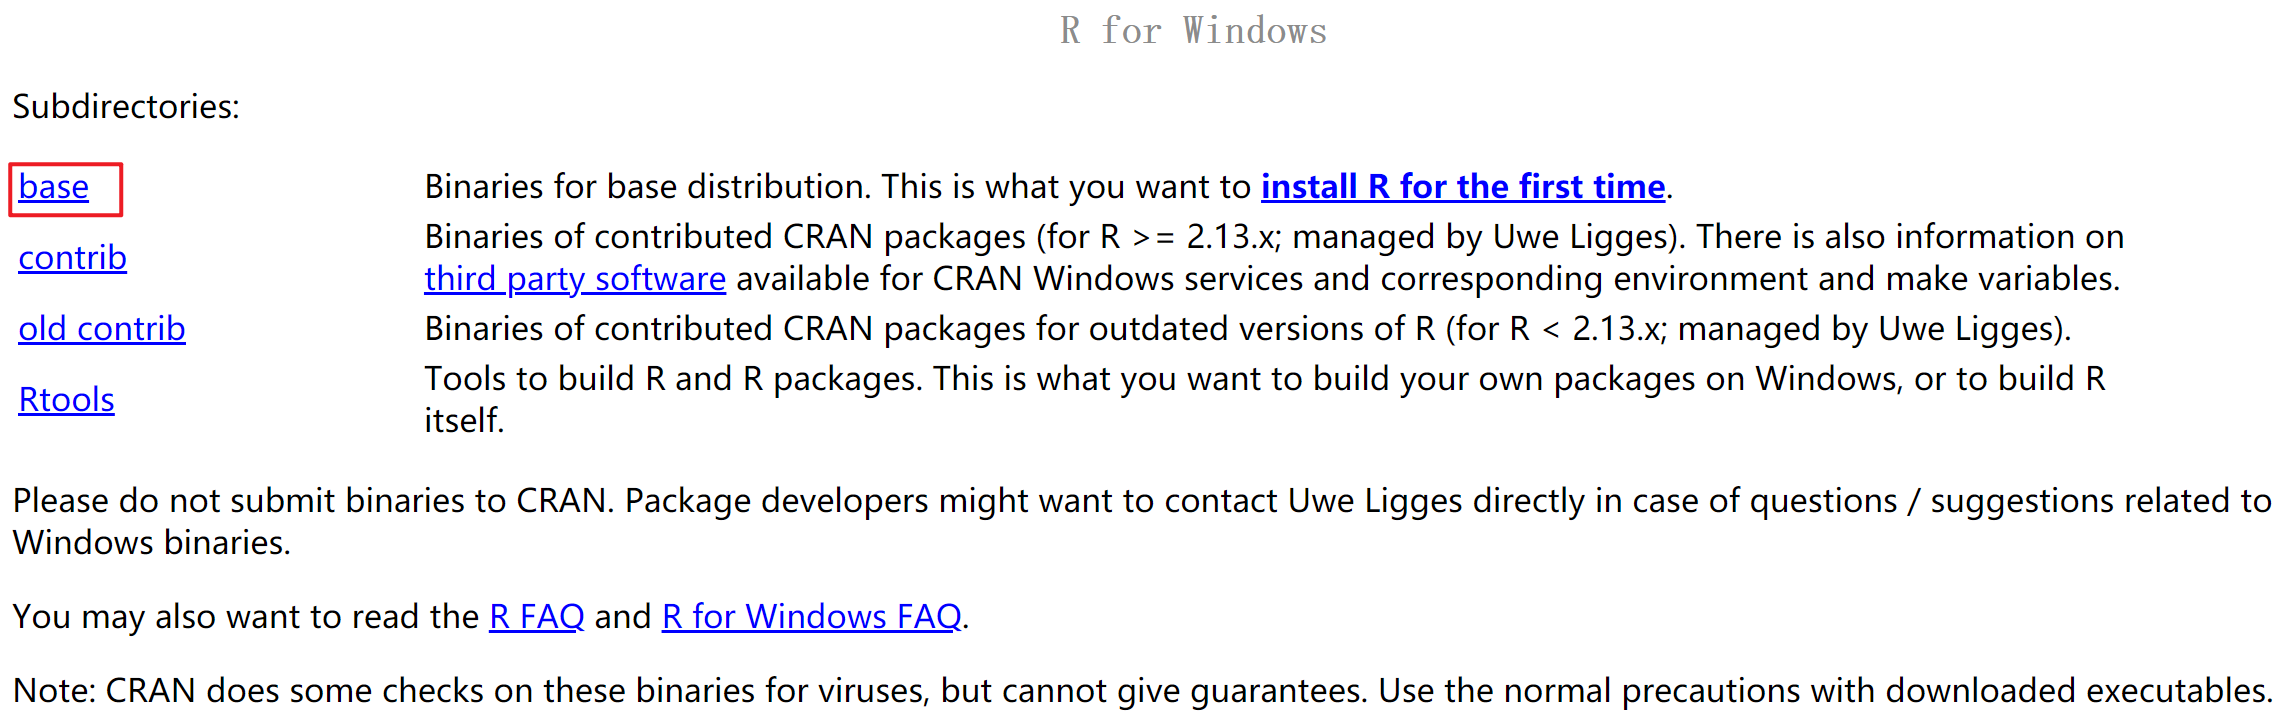
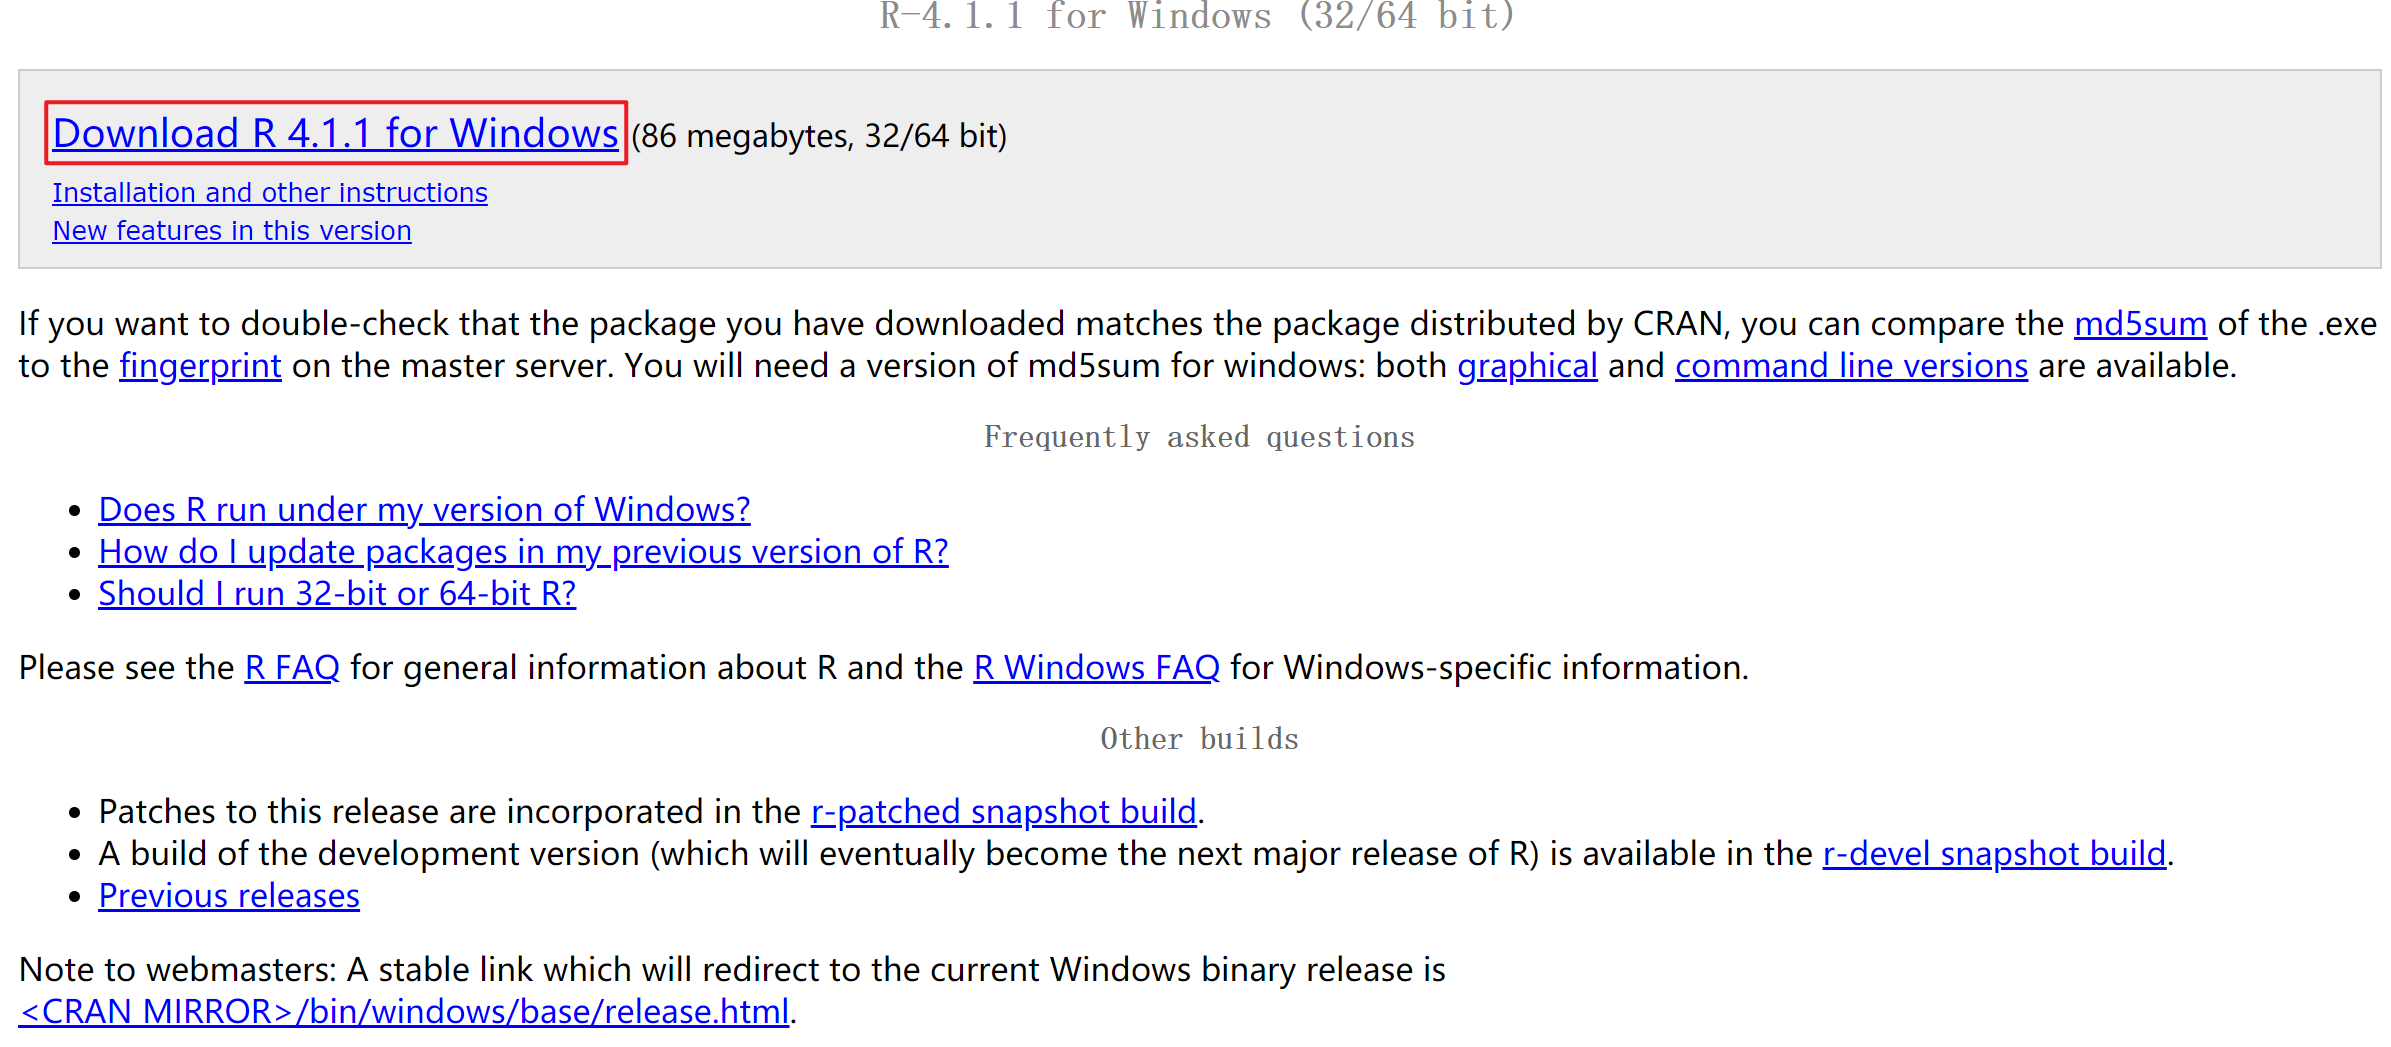
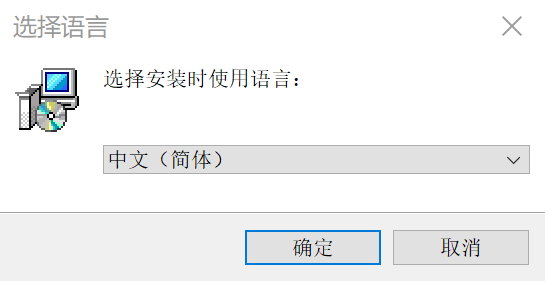
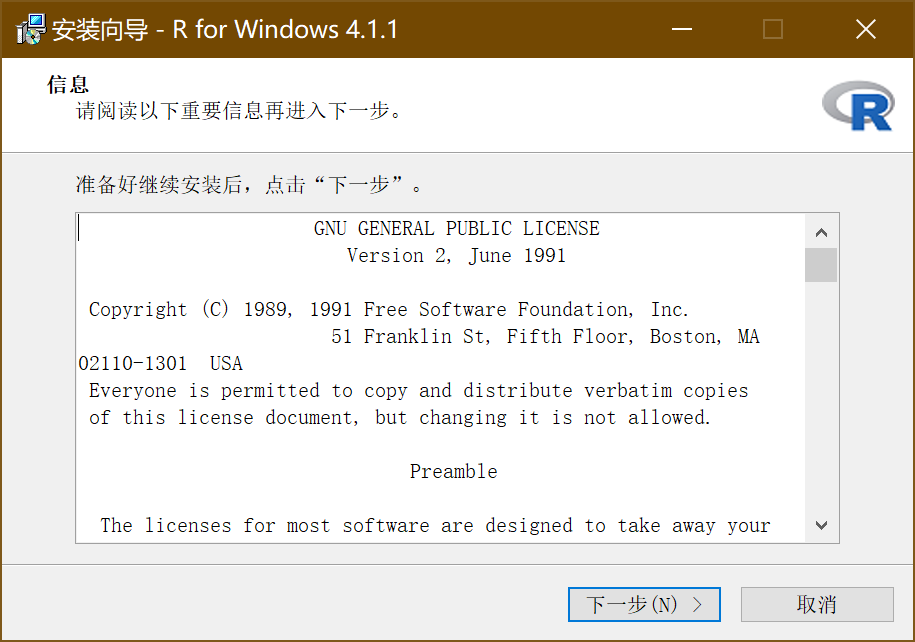
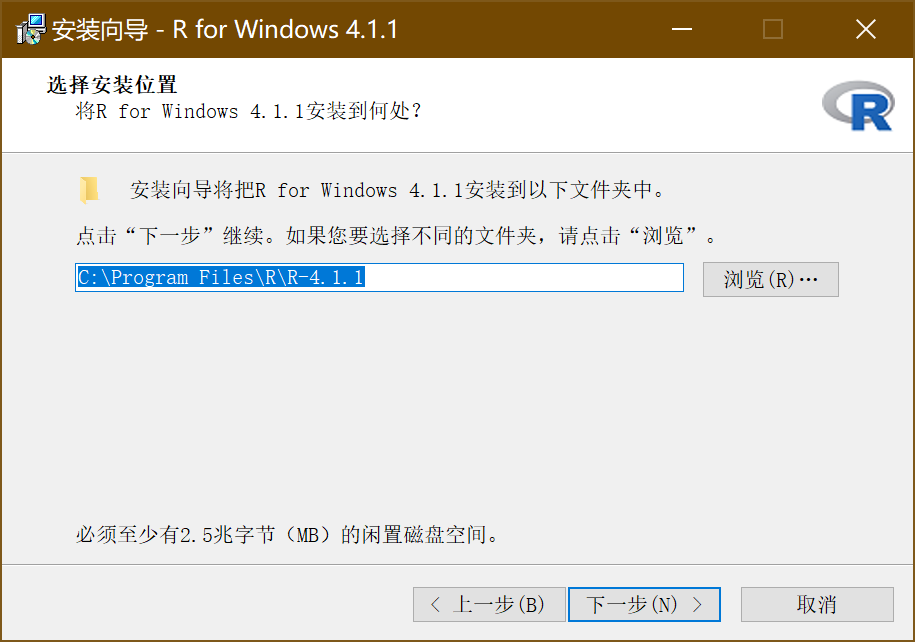
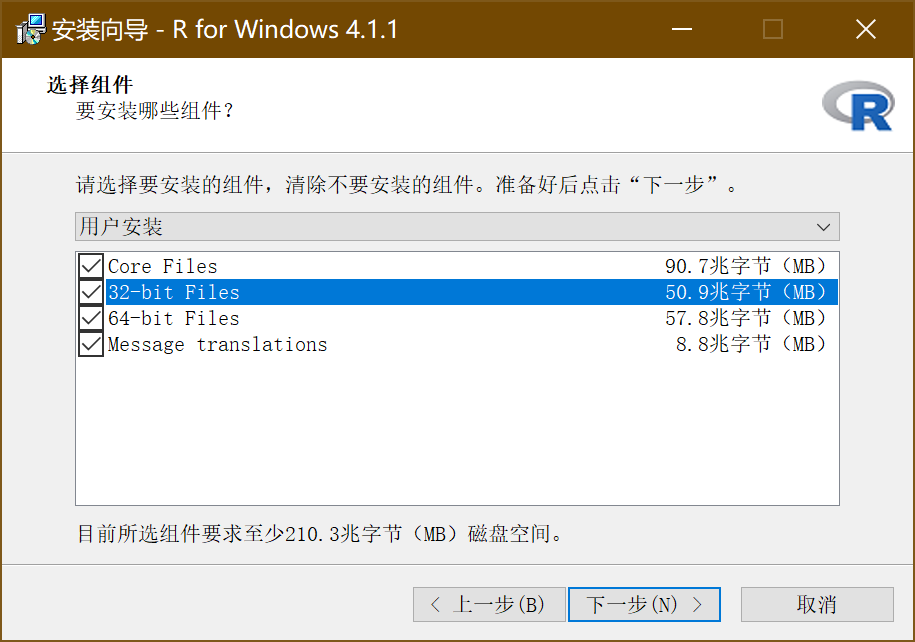
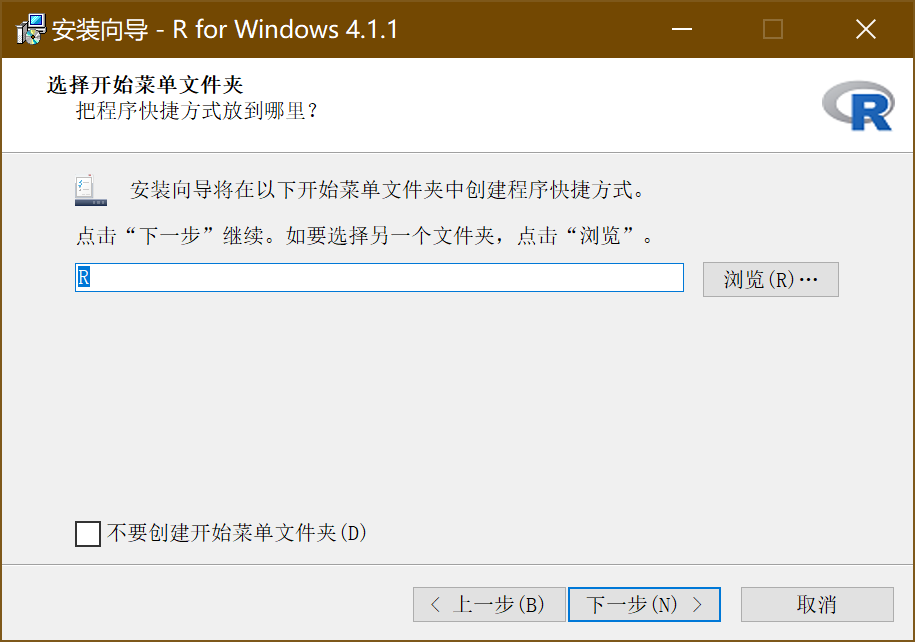
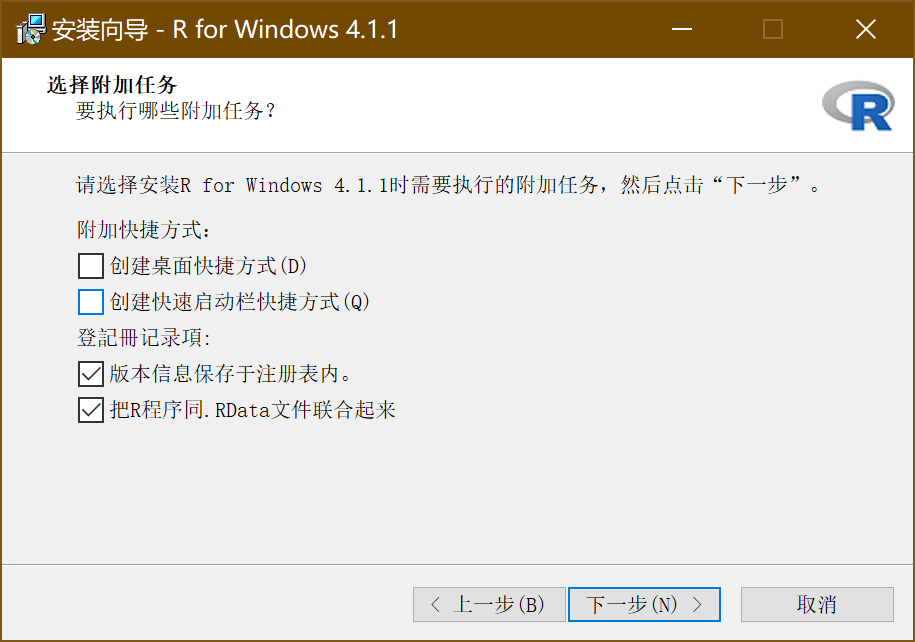
1.4 Installation

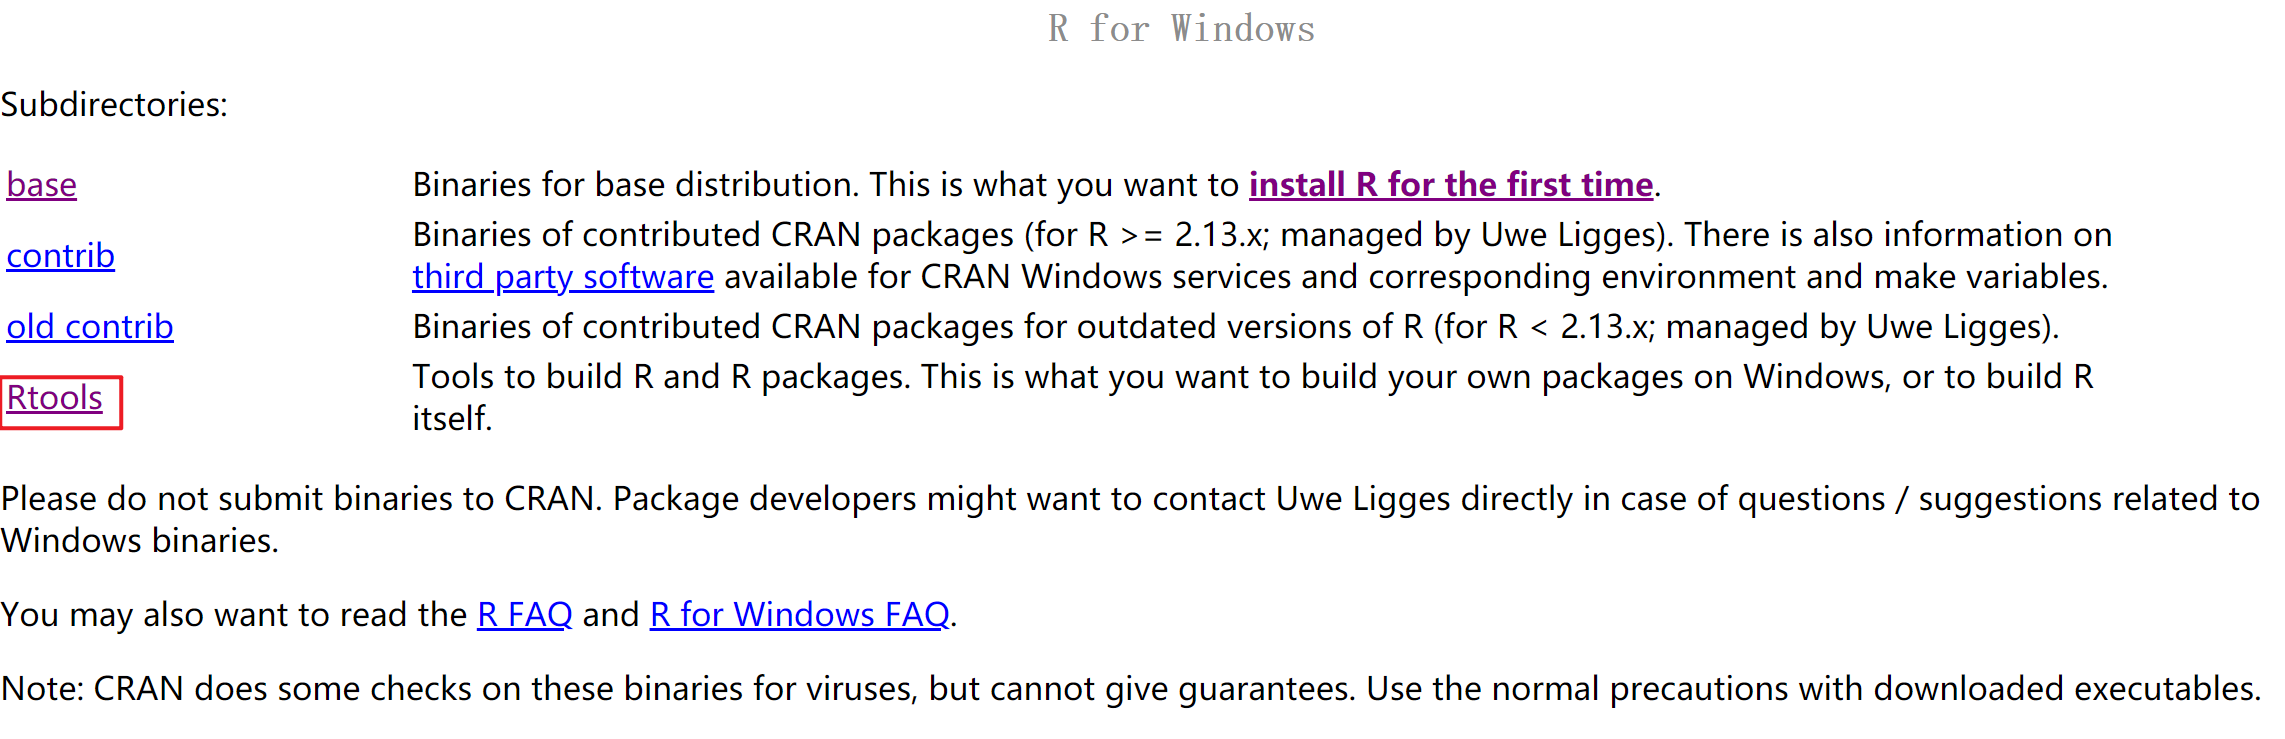
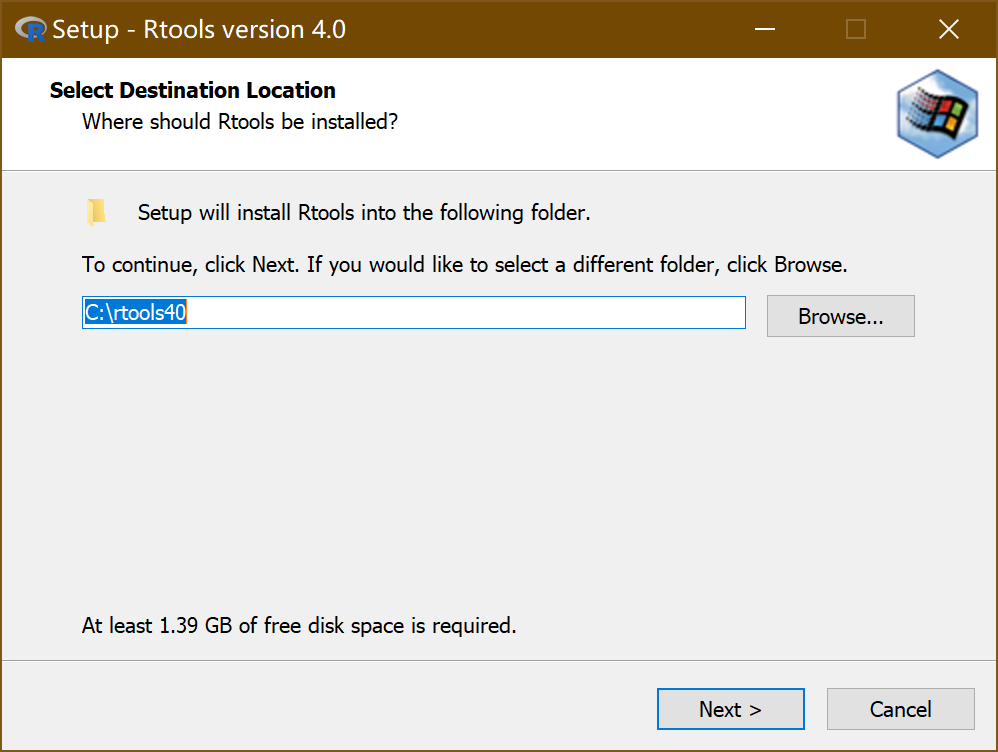
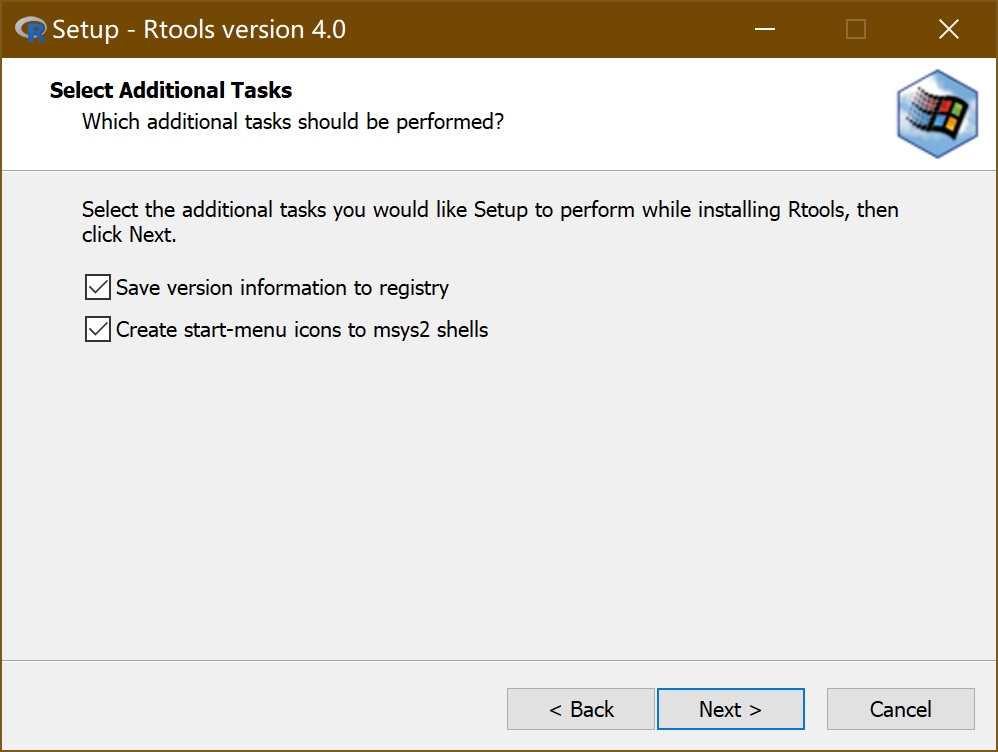
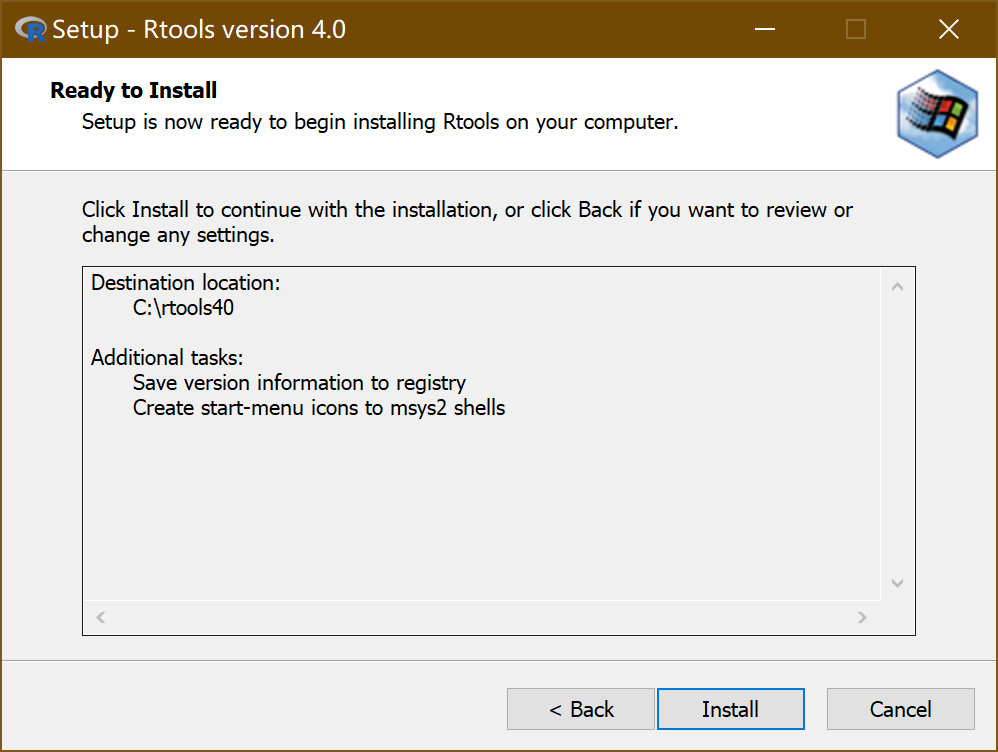
1.4.2 Rtools (optional)
当碰到诸如创建 R 包、下载一些尚处在开发阶段的 R 包等情况时,会要求使用者的电脑安装了 Rtools。
- 下载和系统位数(32 或 64)匹配的 Rtools
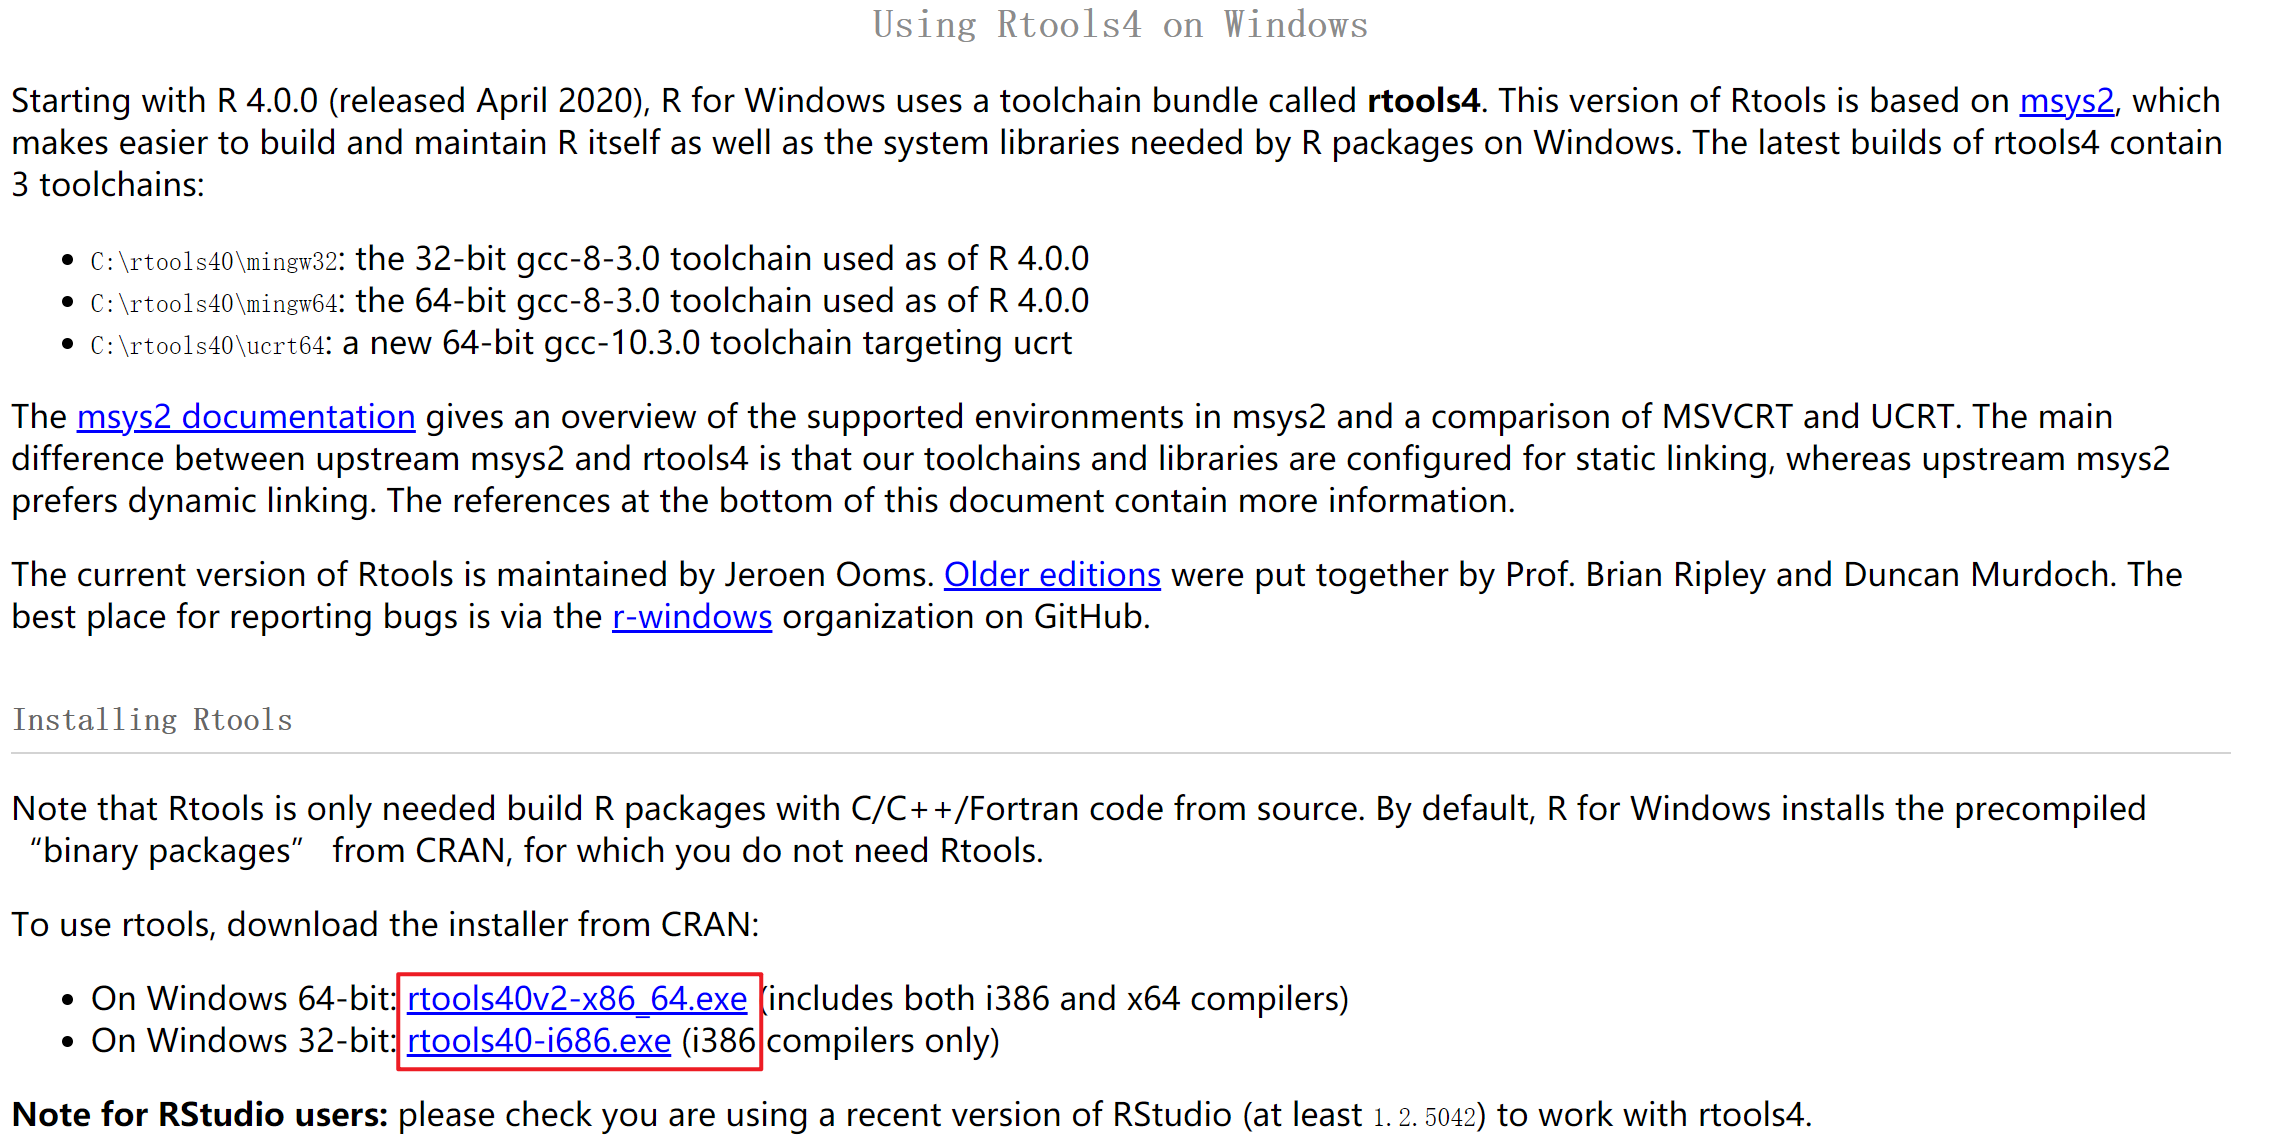
tips:如何确定电脑是 32 位还是 64 位?
桌面->此电脑->右键->属性
- 双击打开下载的安装包
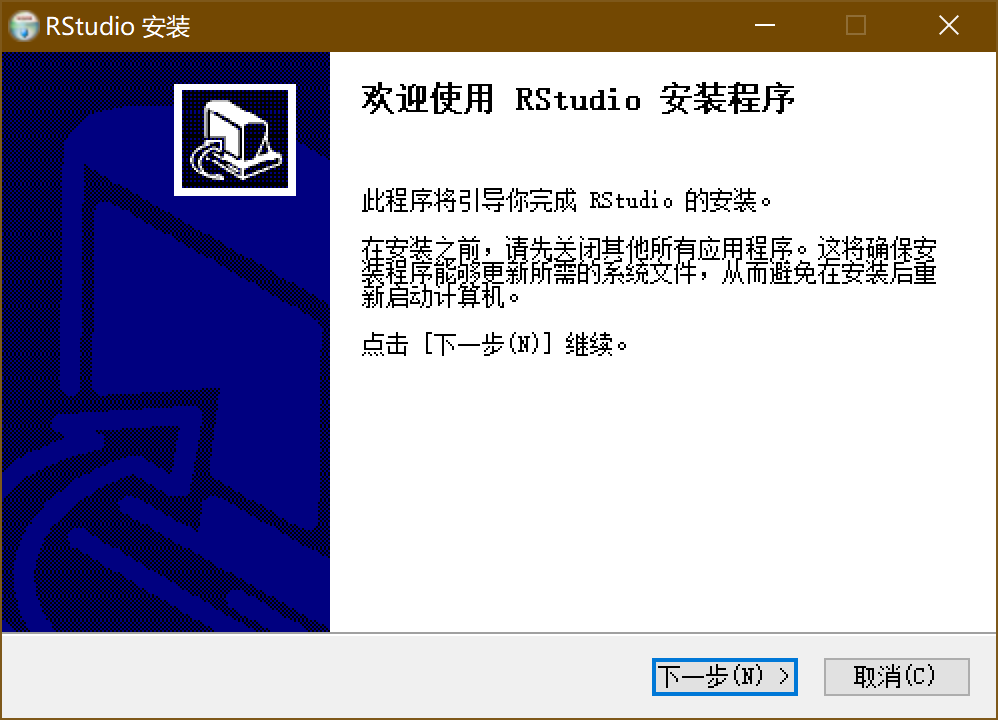
1.4.3 Rstudio
为什么要用 Rstudio?集成开发环境(integrated developing environment, IDE)。Rstudio 集成了很多便利的设定和功能,能够获得更好的 R 语言编程体验。好比都是做截图这同样的一件事(R 语言编程),windows 自带的截图工具(R 自带的图形界面编辑器:RGui)就是没有 QQ 截图(Rstudio)好用。
当然还有其他的泛文本编辑器,如 Visual Studio Code, Visual Studio, Atom, Eclipse, 等等,都可以作为 R 的编辑器,但最常用的、最好上手的是还是 Rstudio。

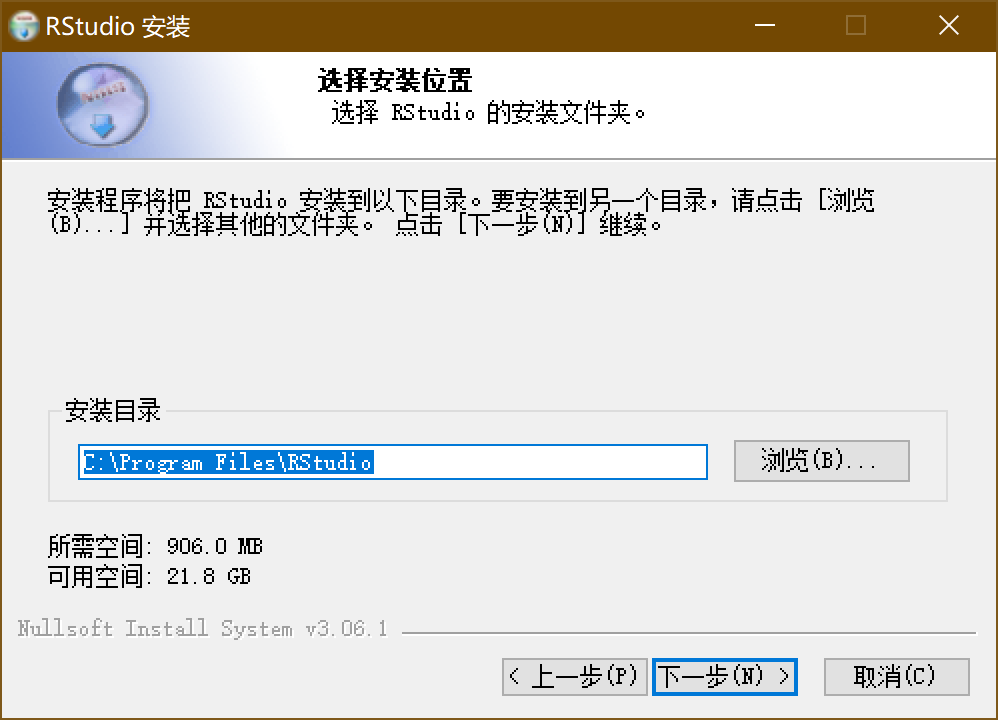
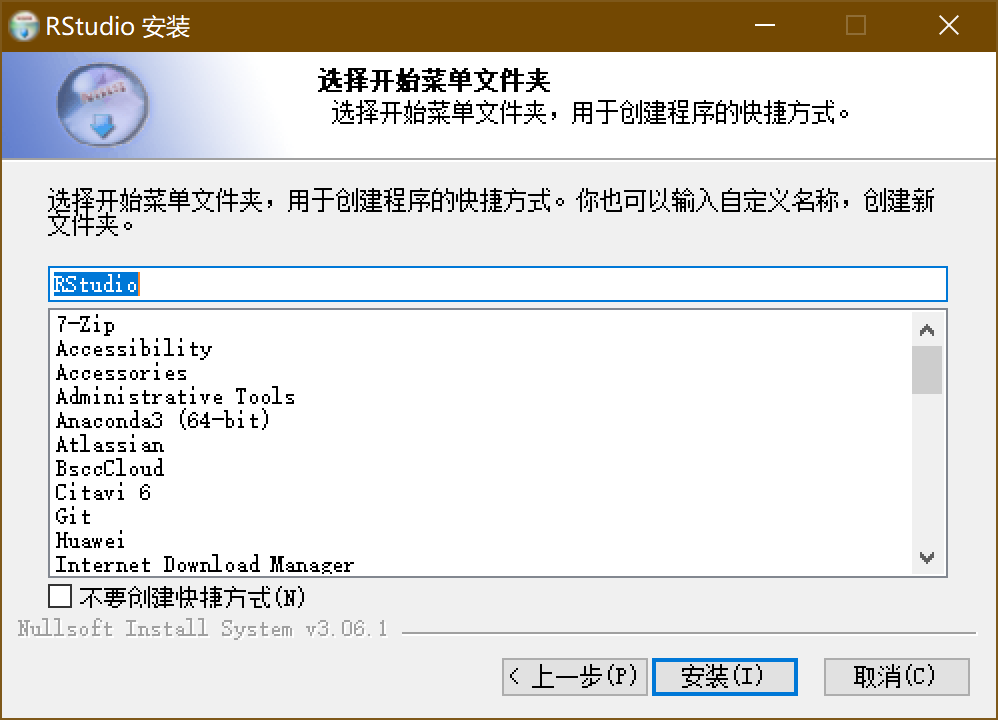
- 双击打开下载的安装包
Rstudio有 4 个主要和常用的版块如下图所示,各板块的具体用法将在Rstudio简介这一节详细介绍。
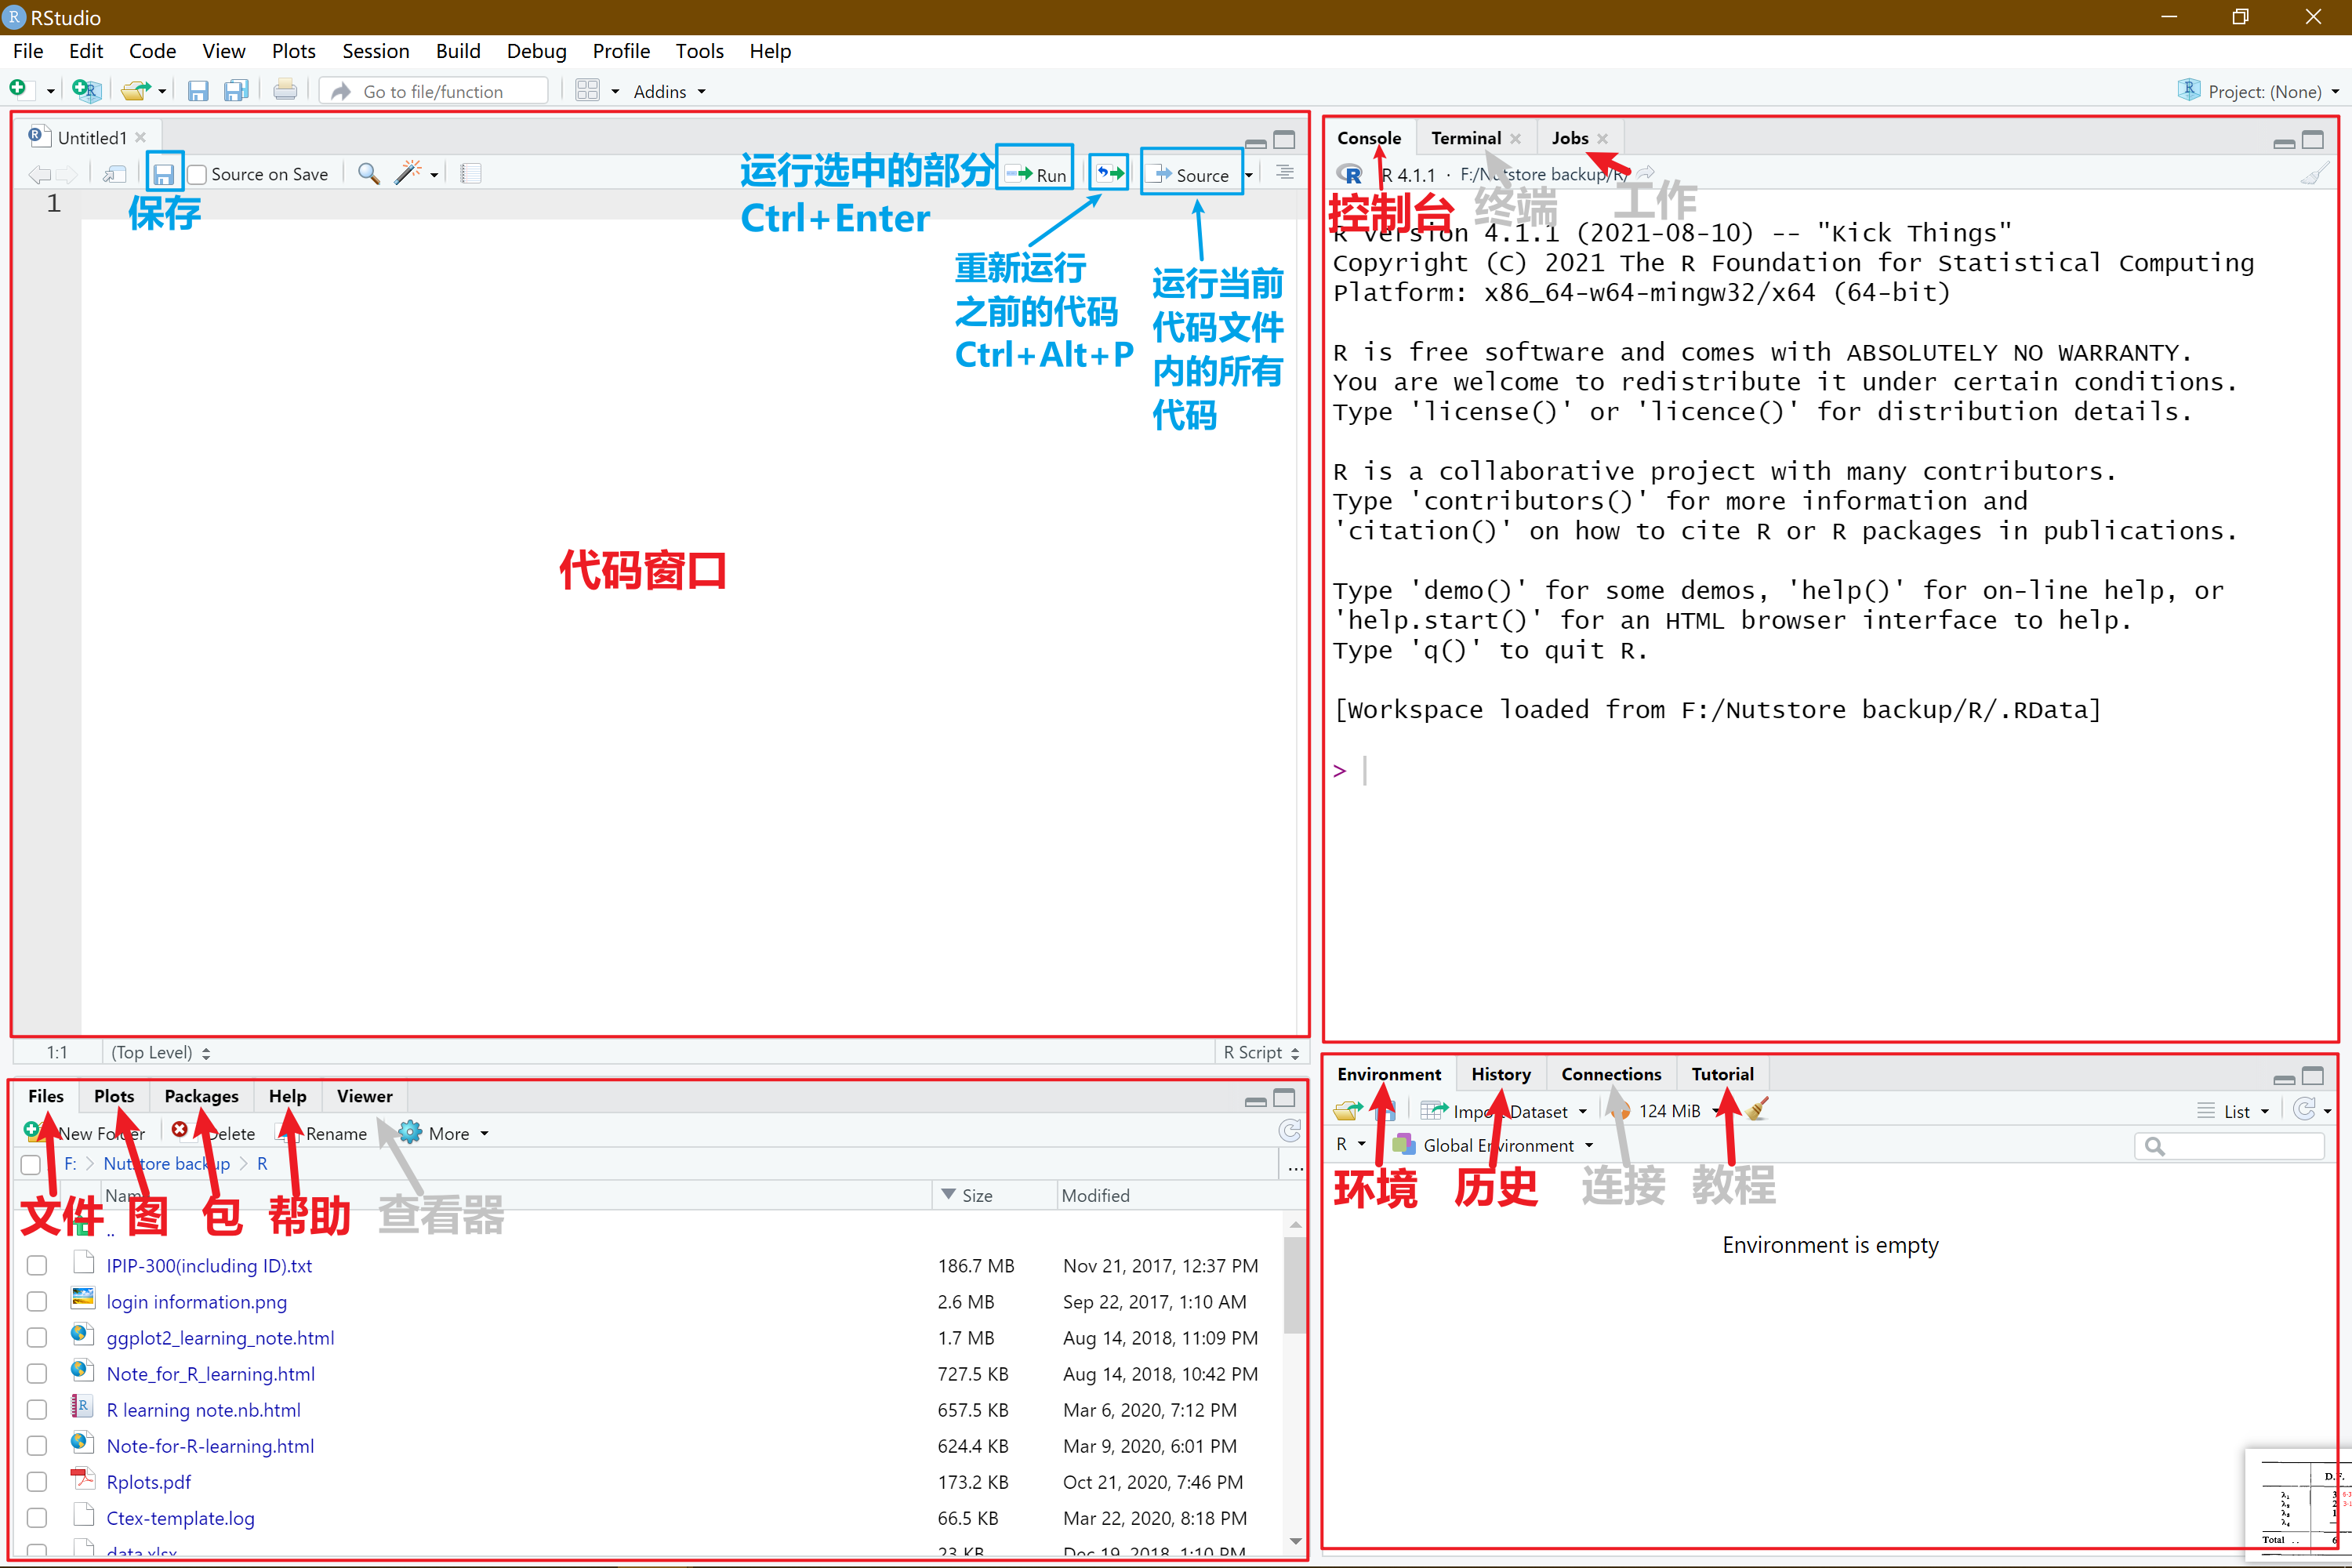
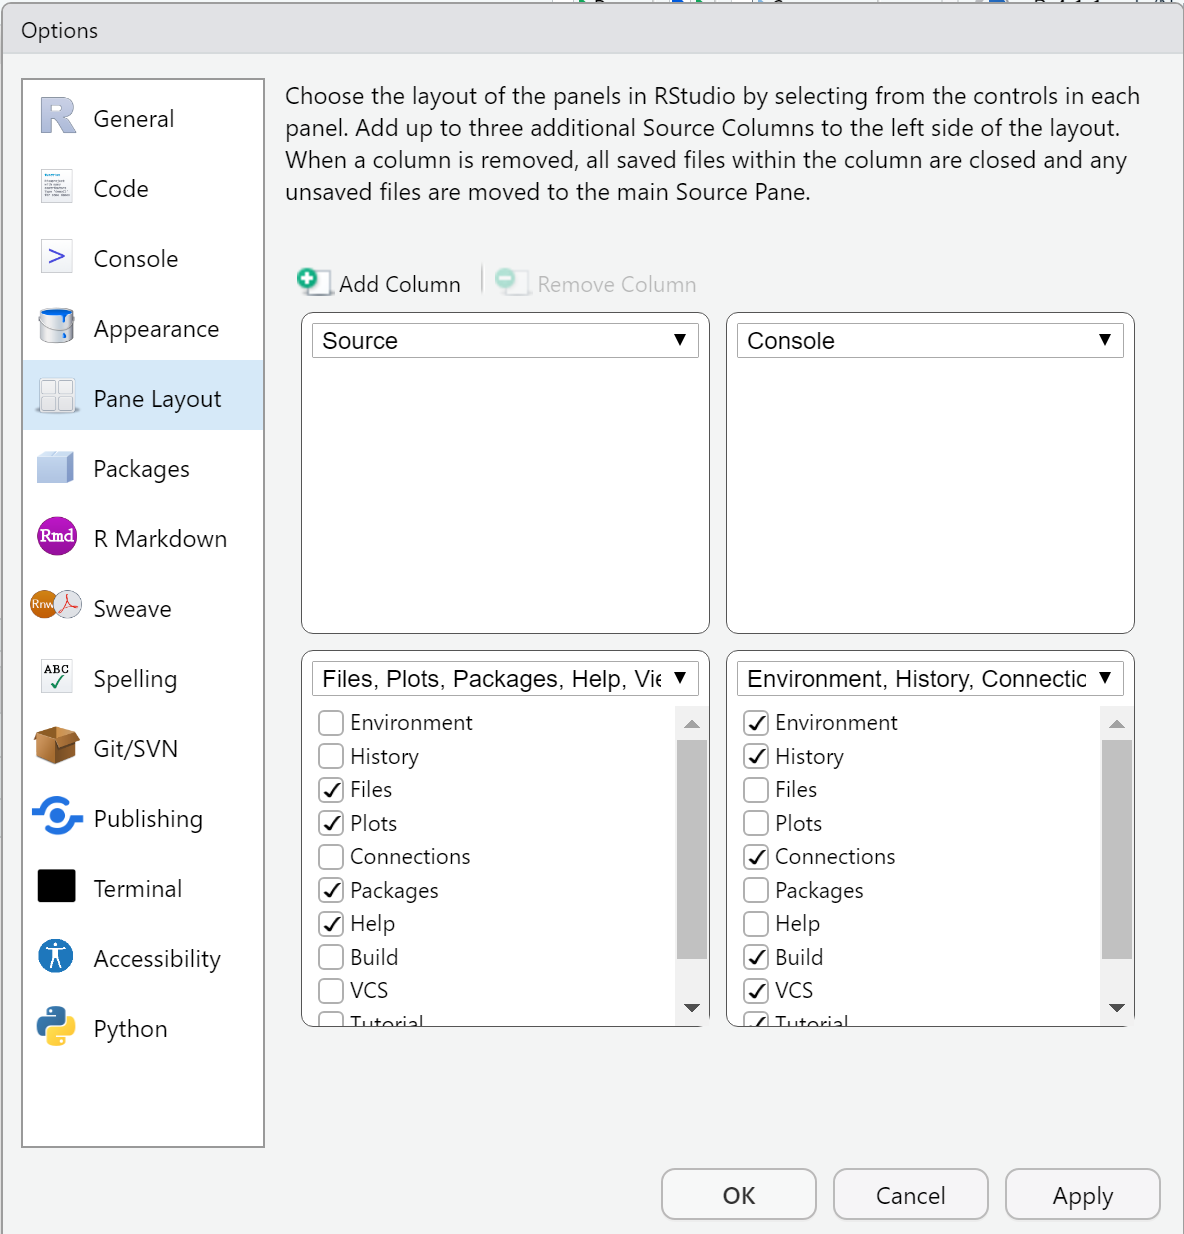
如果要更改各版块的位置和版块内呈现的具体内容,使用 Rstudio的顶部菜单中的”View”,具体为:View->Panes->Pane Layout
注意:请先安装 R 再安装 Rstudio,不然容易出现打开 Rstudio,Rstudio 提示找不到 R。
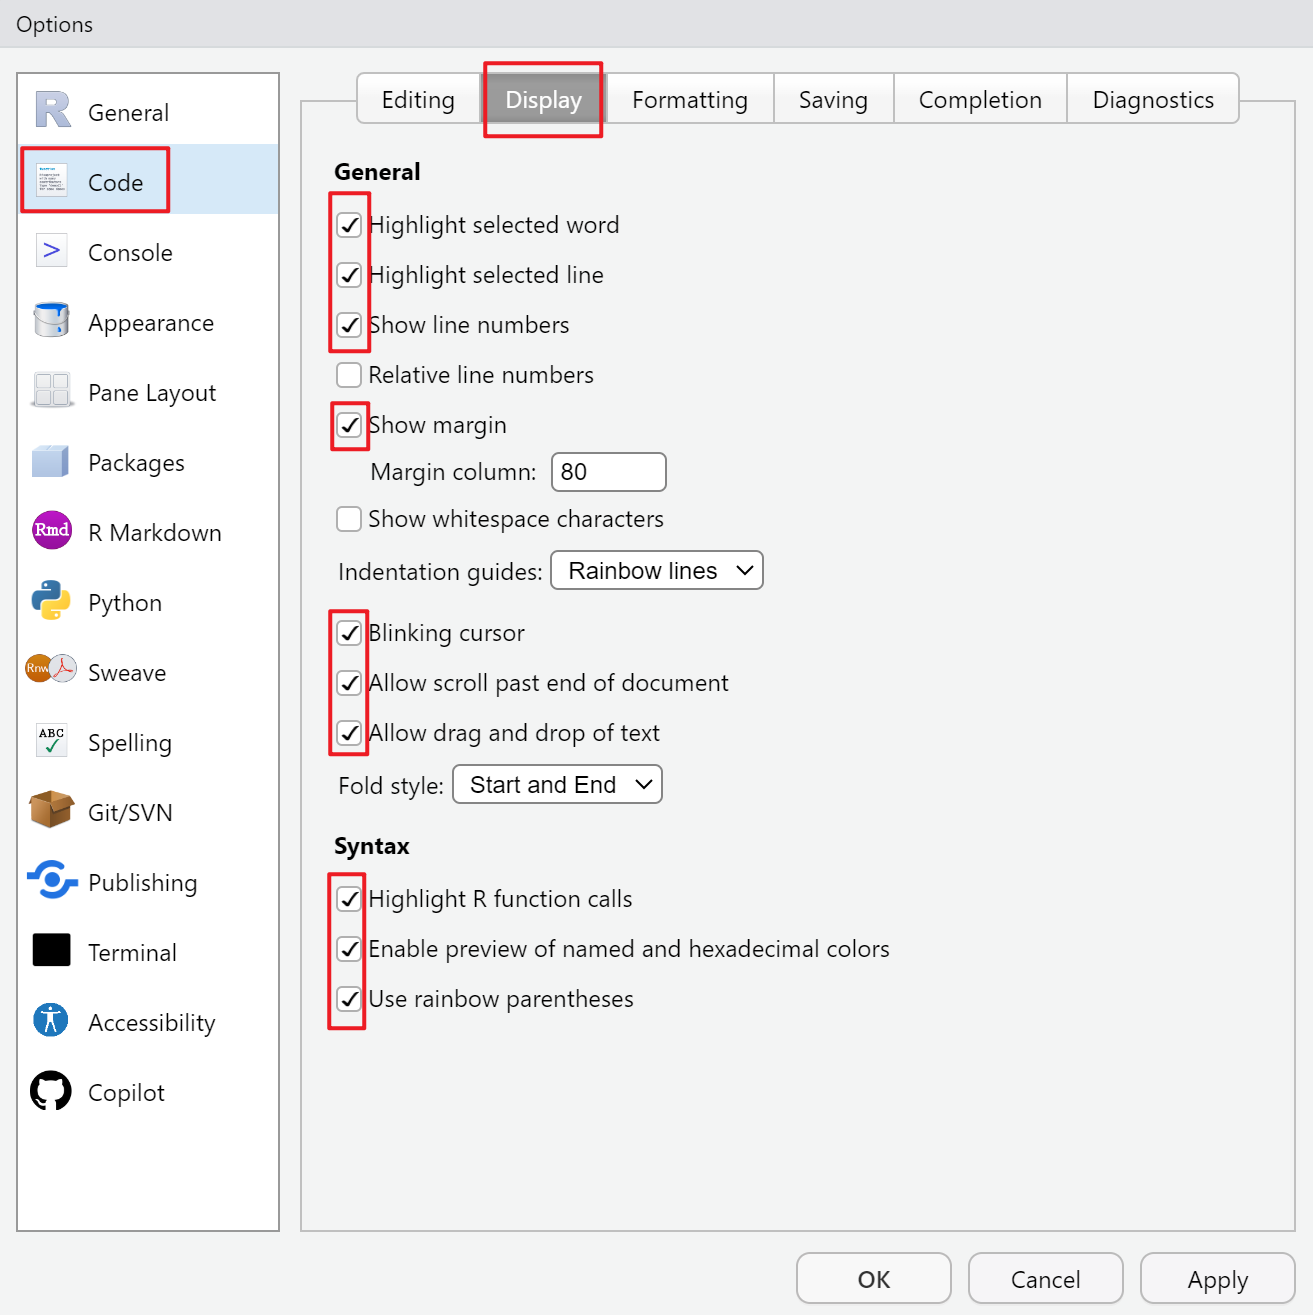
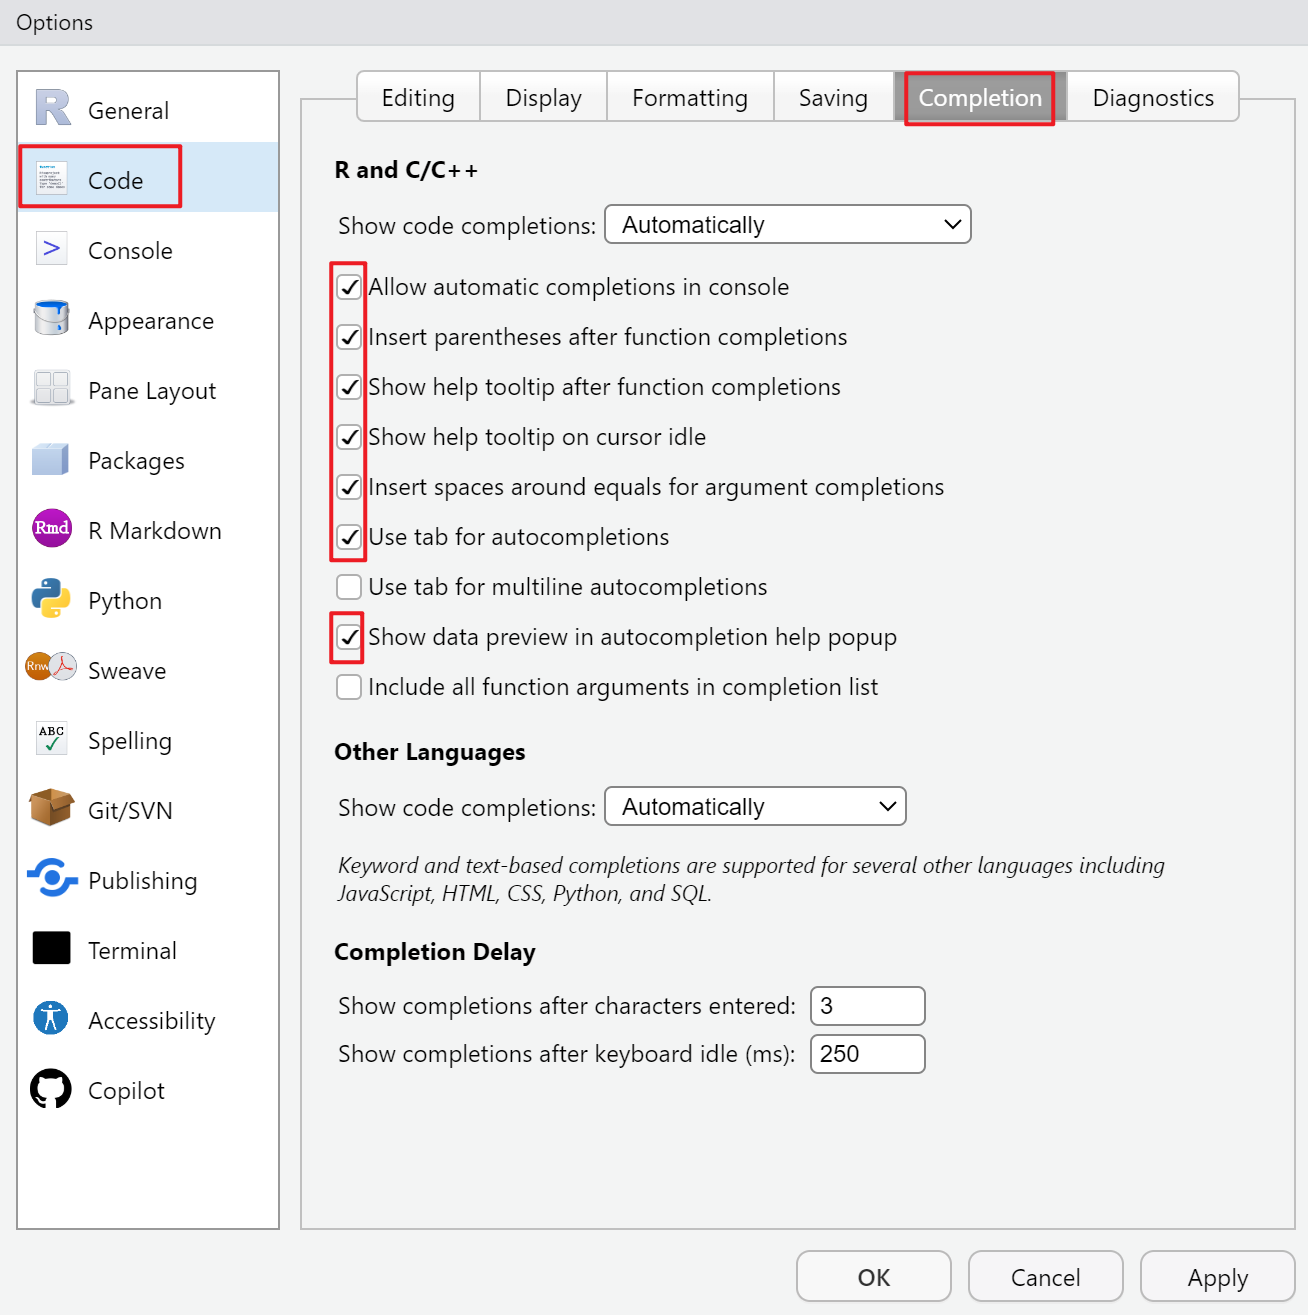
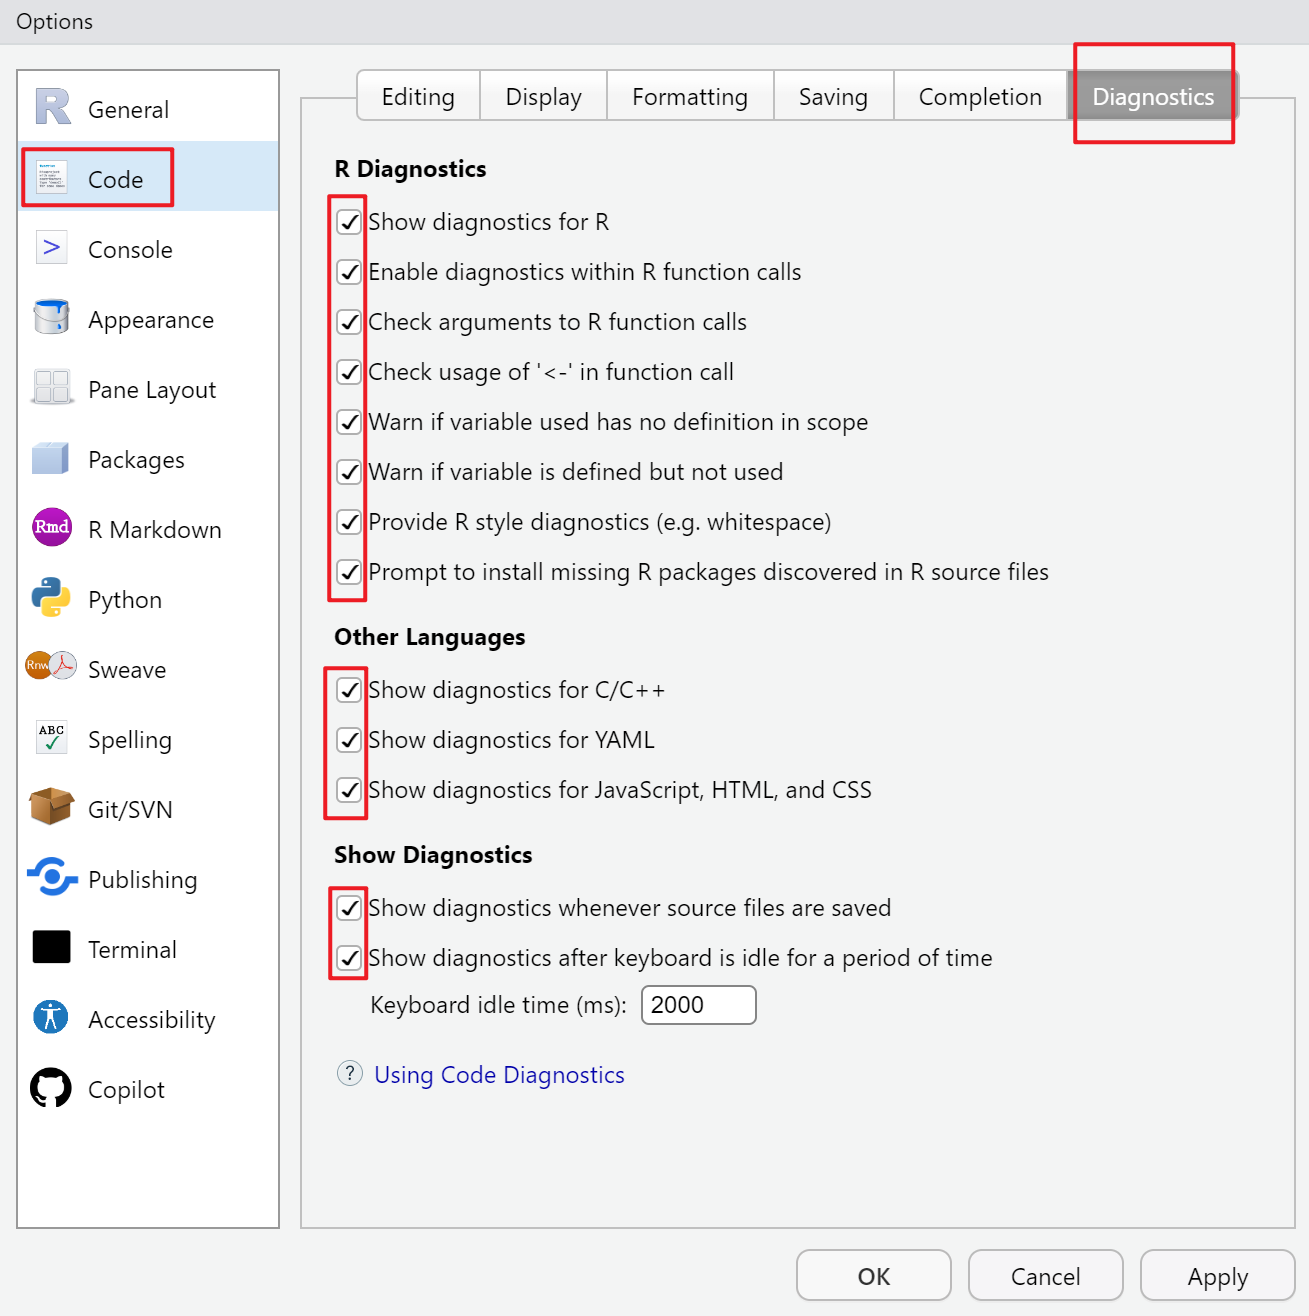
1.4.3.1 Recommended settings
Rstudio 的所有设置都在顶部菜单”Tools”中,具体为:Tools->Global Options
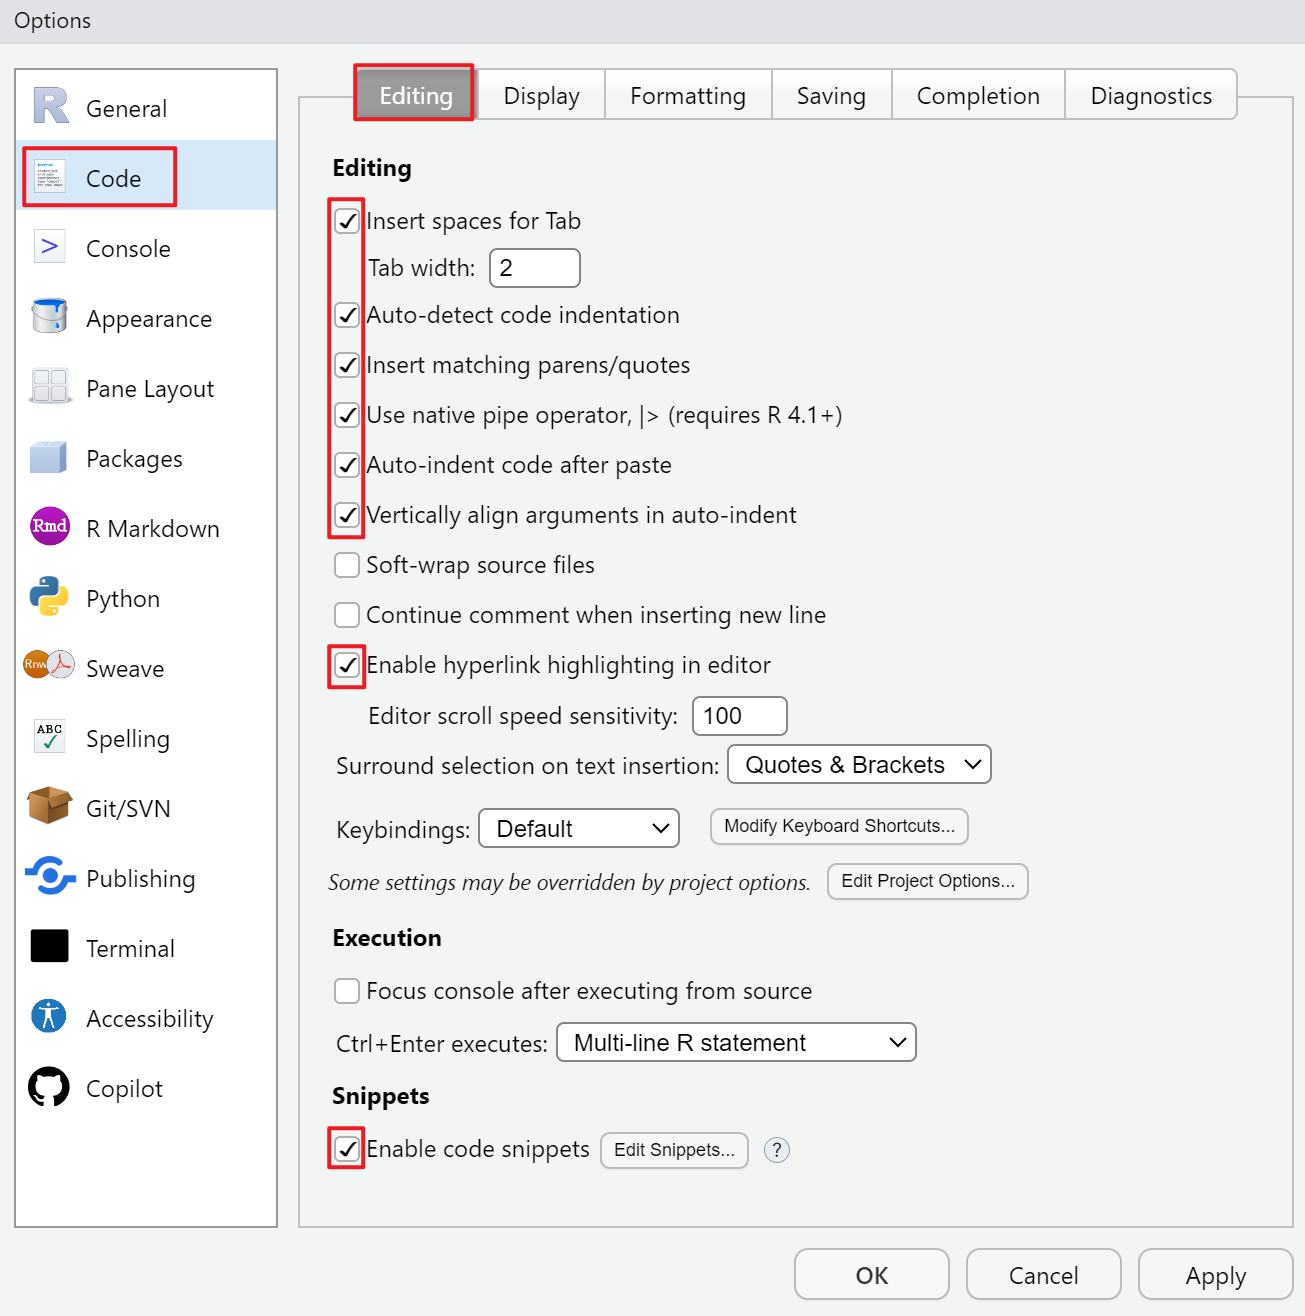
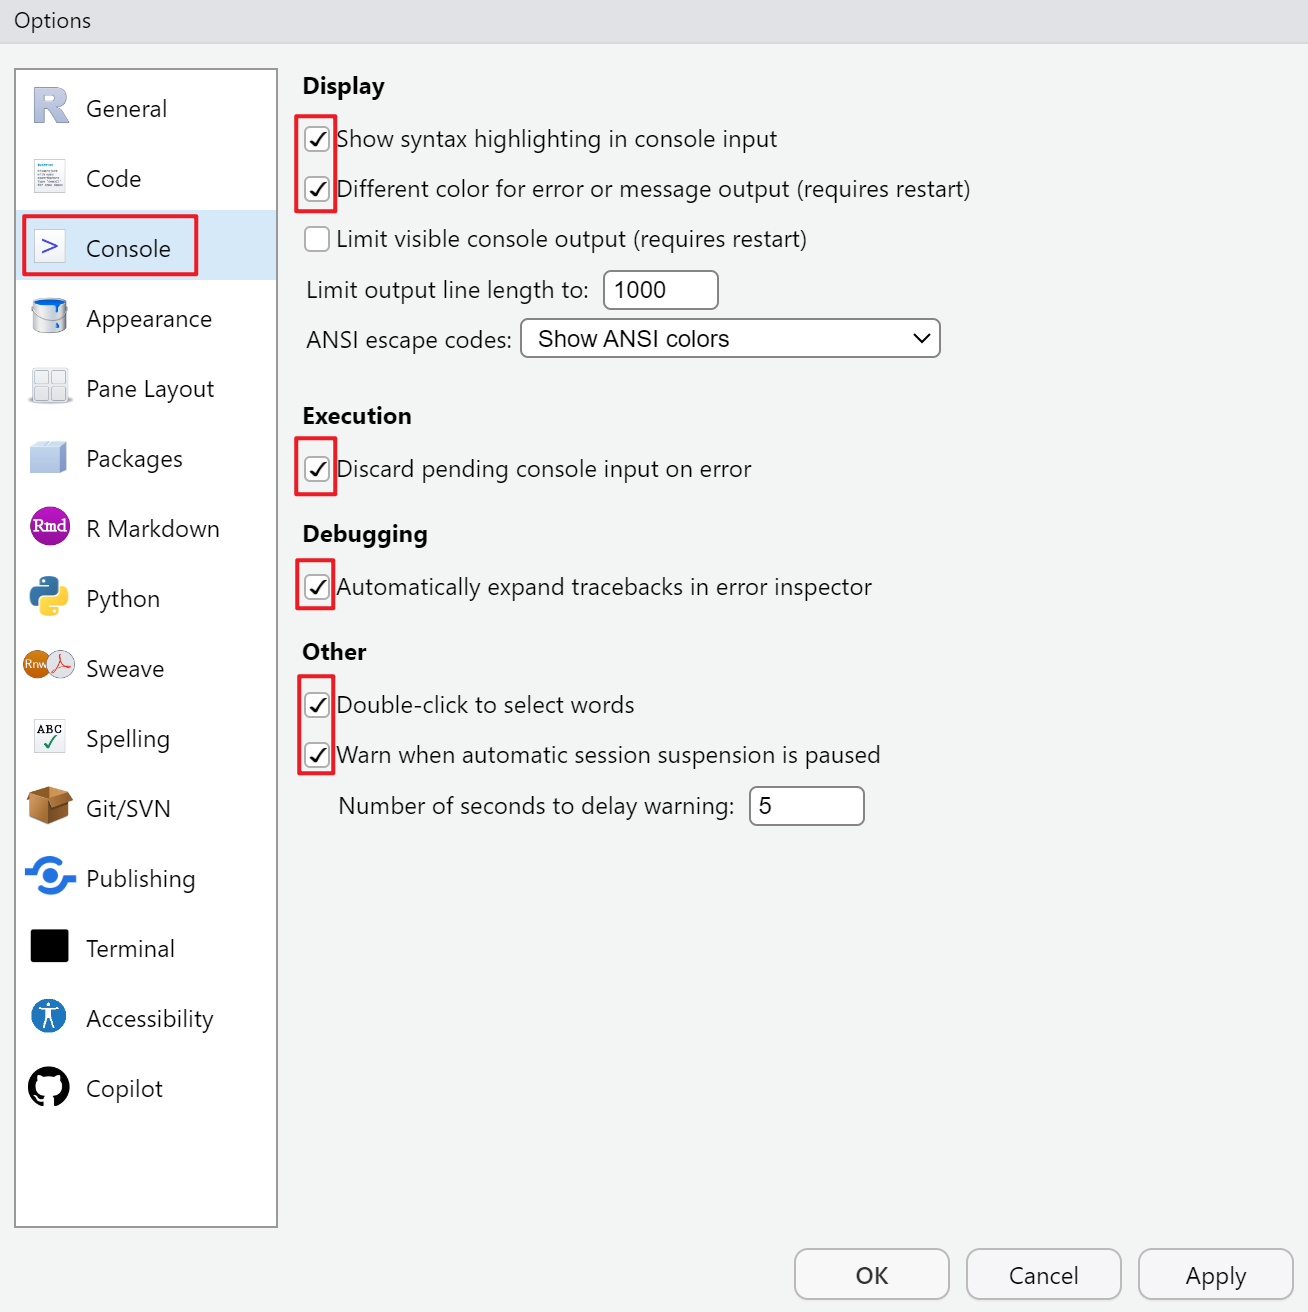
延伸阅读:Customizing Rstudio
1.5 A few tips
- 将 R 的显示语言调整为英语,并设置为启动配置。具体方式如下:
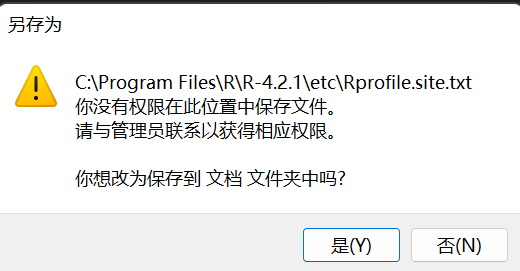
- 在确保 R 关闭的情况下,找到 R 的安装路径下的etc文件夹,一般是”盘符:\Program Files\R\R-版本号\etc\”
- 找到”Rprofile.site”文件,右键->打开方式->记事本
- 在末尾添加
Sys.setenv(LANG = "en"),保存并关闭
如果发现采取了上述步骤以后依旧是中文,将末尾添加的代码改为 Sys.setenv(LANG = "en_US")。
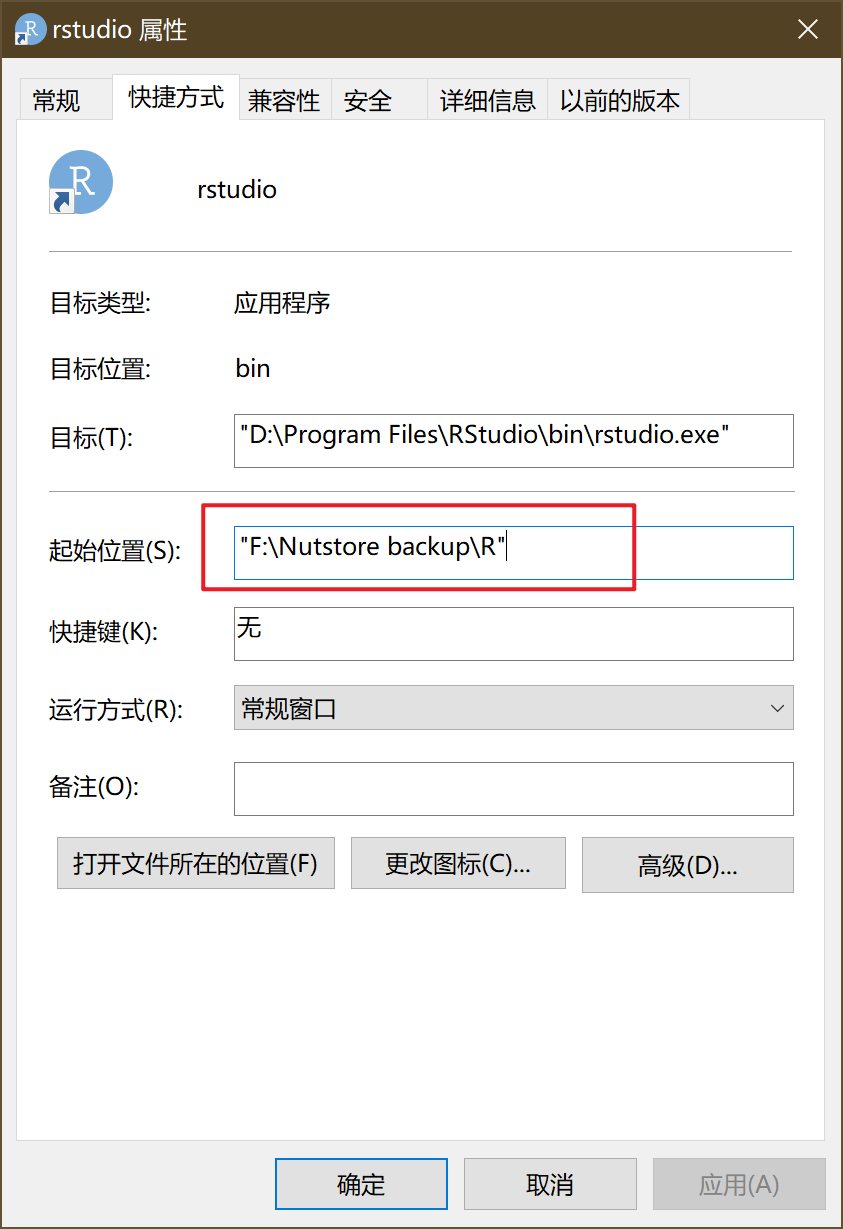
- 设定一个专门存放 R 代码的文件夹(不要放在 C 盘),并设置 Rstudio 启动时自动定位到该目录。
- 在桌面新建一个 Rstudio 快捷方式,如果已经有了则跳过此步
- 复制专门存放 R 代码的文件夹路径
- 在该快捷方式上右键->属性->起始位置->粘贴复制的路径到引号内
- 在该快捷方式上右键->固定到任务栏