# THIS CREATES THE USER INTERFACE
ui <- fluidPage(
# Application title
titlePanel("My first shiny app :-)"),

# CHOOSE LAYOUT
sidebarLayout(

  # DEFINE SIDEBAR PANEL
    sidebarPanel(

      # THE WIDGET
      selectInput("selection", label = h3("Select box"),
        choices = list("Fertility" = "Fertility",
                       "Agriculture" = "Agriculture",
                       "Examination" = "Examination",
                       "Education" = "Education",
                       "Catholic" = "Catholic",
                       "Infant.Mortality" = "Infant.Mortality"),
        selected = 1) # Q: What could selected mean?
      ),

  # DEFINE MAIN PANEL
    mainPanel( # Draw main panel
      plotOutput("distPlot") # Put the output - a plot - into the main panel

    ))
)

server <- function(input, output) {
      # shinyServer(function(input, output) {}: Provide server.R with code
      # R components for app are defined between {}


# DEFINE WHAT IS RENDERED (plot, table, text etc.)
  output$distPlot <- renderPlot({ # RENDER A PLOT
      x    <-   swiss[, input$selection] # Dataset called swiss
      # output$distPlot: Save R component in output list
      # renderPlot(): creates a plot as shiny UI component
      # input$<widget name> = input$varname: Insert widget value here
      # Example based on the dataset "swiss"

      hist(x, col = 'darkgray', border = 'white', xlab=input$selection,
           main="Swiss French Provinces Fertility and Socioeconomic Indicators (1888) Data")
      # hist(): draw the actual plot - a histogram
      # xlab=input$varname: What happens here?
  }) # close renderPlot()
}


# Create Shiny app objects from either an explicit UI/server pair
shinyApp(ui = ui, server = server)Shiny (IDV)
- Learning outcomes: Learn…
- …how to setup a very simple shiny app.
- …how shiny apps fundamentally work.
1 What is Shiny?
A web application framework for R to turn analyses into interactive web applications. What does that mean?
The userinterface is a webpage
On this webpage you can manipulate things
Behind the webpage there is a computer (your computer or a server)
That computer/server runs R and your r-script
When you change something on the webpage, the information is send to the computer
Computer runs the script with the new inputs (input functions)
Computer sends back outputs to the webpage (output functions)
Examples: Shiny Gallery, some my own
2 Example for starters (local)
- Install the shiny package:
install.packages("shiny")and load itlibrary(shiny). - In Windows/MAC create a directory/folder where you save the shiny app R file and any necessary files, e.g., using
setwd("C:/Users/Paul/Google Drive/12_ADV_Workshop/live_code/myshinyapp")- e.g., using
dir.create("./myshinyapp/", recursive = TRUE)to do that in the working directory.
- e.g., using
- Set your working directory to this (app) directory, e.g., using
setwd("myshinyapp")(check withgetwd())- A shiny app requires one source file (several if you want)
- This file includes the user interface (UI) and the server (SERVER, code to evaluate inputs and generate outputs)
- File(s) must be saved in app directory
myshinyapp(better use one directory for each app as file upload is less complicated)
- Create one script (“File -> New File -> R script”) in which you paste the code below and save that script under the name
app.R(use this file name!). In this example there is just one reactive output, namely a plot.
- Open script and run the app locally (e.g. paste in console, push run or paste code below)
- If that works…
- Deploy app online: Push blue button “publish” in app window (you need an shinyapps.io account first!).
3 Setting up shinyapps.io
- Install R on your computer
- Shinyapps.io (account) allows you to run shiny apps online
- To set up the shinyapps.io account we follow this description.
- shinylive: Run shiny apps in the browser (without R server)
4 Basic steps
- Remember the steps!
- Create and set directory for your app
- Create app source file
- Run the app locally and if it works…
- …upload and run it on the server!
- Make sure that all necessary packages are installed and loaded, both at your local machine but also online on the server!
- Q: What are the central components of a shiny app again?
5 User Interface (UI)
5.1 UI Layout
- Apps consist of
ui,serverandshinyApp(ui=ui, server = server) fluidPage(): Creates a display that automatically adjusts to the dimensions of a user’s browser window (smartphone!)- Lay out your app by placing elements in the fluidpage function
- Below a user interface with a title panel and a sidebar panel
titlePanelandsidebarLayoutcreate a basic Shiny app/layout with a sidebarsidebarLayouttakes two functionssidebarPanel: Includes content displayed in the sidebarmainPanel: Includes content displayed in the main panel
- Try the code below by pasting it into your console and running it. It will only create a user interface.
- Change
sidebarLayout(...tosidebarLayout(position = "right",...
5.2 UI Layout advanced
5.2.1 tabsetPanel and tabPanel
tabsetPanel()+tabPanel()- Allows for using sidebar layout but dividing main panel into tabs
- Users can switch between tabs
- Tabs can be used to display various outputs simultanously (rather than putting them all on one page)
# ui.R
ui <- fluidPage(

  # Application title
  titlePanel("User interface with several tabs in the main panel"),

  sidebarLayout(
    sidebarPanel(

      selectInput("var1", label = "Y-Variable:",
                  choices = c("trust.2003.2004","trust.2004.2005"),
                  selected = "trust.2003.2004"),
      #
      selectInput("var2", label = "X-Variable:",
                  choices = c("threat.2004", "threat.2005"),
                  selected = "threat.2004"),
      #
      sliderInput("trustrange",
                  label = "Range of initial trust level:",
                  min = 0, max = 10, value = c(0, 10))
    ),

    mainPanel(
      tabsetPanel(type = "tabs",
                  tabPanel("3d Frequency Plot", "plot here"),
                  tabPanel("Histogram", "another plot here"),
                  tabPanel("Model Summary", h4("estimation results here")),
                  tabPanel("Data Summary", h4("Variable summaries (1)")),
                  tabPanel("Explanation", p("This ShinyApp represents a quick example to illustrate the usefulness of Shiny for robustness analysis. The outcome variable is the change in trust between two panel waves (e.g. 2003 and 2004). The treatment variable is a victimization experience (threat or insult) that happened during that time period. The model is a simple bivariate OLS model (Y = trust change; X = victimization experience). There are no control variables."))

))))

server <- function(input, output) {}

shinyApp(ui=ui, server = server)navbarPage(): Create a multi-page user-interface that includes a navigation barfluidRow()andcolumn(): Build layout up from grid system
5.2.2 HTML tag functions
- Shiny’s HTML tag functions translate input into html code
- Paste
h2("A NEW HOPE", align = "center")into your console
- Paste
- Here we just do a quick example but in this tutorial you find more information
ui <- fluidPage(
  titlePanel("My Shiny App"),
  sidebarLayout(
    sidebarPanel("blablblab"),
    mainPanel(
      h2("A NEW HOPE", align = "center"),
              h5("It is a period of civil war.", align = "center"),
      p("p creates a paragraph of text."),
      p("A new p() command starts a new paragraph. Supply a style attribute to change the format of the entire paragraph.", style = "font-family: 'times'; font-si16pt"),
      strong("strong() makes bold text."),
      em("em() creates italicized (i.e, emphasized) text."),
      br(),
      code("code displays your text similar to computer code"),
      div("div creates segments of text with a similar style. This division of text is all blue because I passed the argument 'style = color:blue' to div", style = "color:blue"),
      br(),
      p("span does the same thing as div, but it works with",
        span("groups of words", style = "color:blue"),
        "that appear inside a paragraph.")
    )
  )
)

server <- function(input, output) {}

shinyApp(ui=ui, server = server)
5.2.3 Images
img()function places an image- Store image locally
- Store in extra folder
www wwwfolder stores all sorts of additional files(images, data etc.)- If working directory = app directory create with:
dir.create("www")
- Store in extra folder
5.2.4 Exercise: UI + Images
- Create a new app (using the example codes above) that only includes a user interface
- The title (title panel) is “A big name in science”
- Download an image of Marie Curie from the web, e.g., here.
- Store the image in the
wwwfolder or use the URL in your code. - Build a UI that contains the image (stored in the
wwwfolder or taken from the website) in the main panel. - Add the caption “Marie Curie” in bold and blue.
Exercise solution
ui <- fluidPage(
  titlePanel("A big name in science"),
  sidebarLayout(
    sidebarPanel(),
    mainPanel(
      img(src='https://upload.wikimedia.org/wikipedia/commons/thumb/c/c8/Marie_Curie_c._1920s.jpg/220px-Marie_Curie_c._1920s.jpg'), strong(div("Marie Curie", style = "color:blue"))
)))

server <- function(input, output) {}
shinyApp(ui=ui, server = server)

# WHAT COULD BE THE PROBLEM HERE?
5.3 UI Control widgets/inputs (1)
- More lengthy explanation in the shiny tutorial
- Widget = Web element the user can interact with (Shiny widget gallery)
- Users can send messages to the SERVER/Computer (e.g. “I want to choose this variable”)
- Widgets can be added everywhere
- Example for a widget below…
selectinput()widget
- Example for a widget below…
ui <- fluidPage(
  selectInput("select", label = h3("Select box"),
              choices = list("Choice 1" = 1,
                                         "Choice 2" = 2,
                                         "Choice 3" = 3),
              selected = 1),
  hr(),
  fluidRow(column(3, verbatimTextOutput("value")))
  # fluidRow() creates a row,
  #colum() divides row into columns
)

server <- function(input, output) {
    # You can access the value of
      # the widget with input$select, e.g.
  output$value <- renderPrint({ input$select })
}
shinyApp(ui=ui, server = server)- Widget functions requires arguments
selectInput("select", label = h3("Select box"),
    choices = list("Choice 1" = 1, "Choice 2" = 2),
selected = 1)- Underlying logic is the same for all widgets
- User uses widget to give input
- Input is inserted into the functions in the SERVER:
server <- function(input, output) {}
5.4 UI Control widgets/inputs Exercise (2)
- Read the code below and try to understand the different elements. Explain them to the others in the workshop.
- Tipp: Widgets have to be separated by commas.
#ui.R
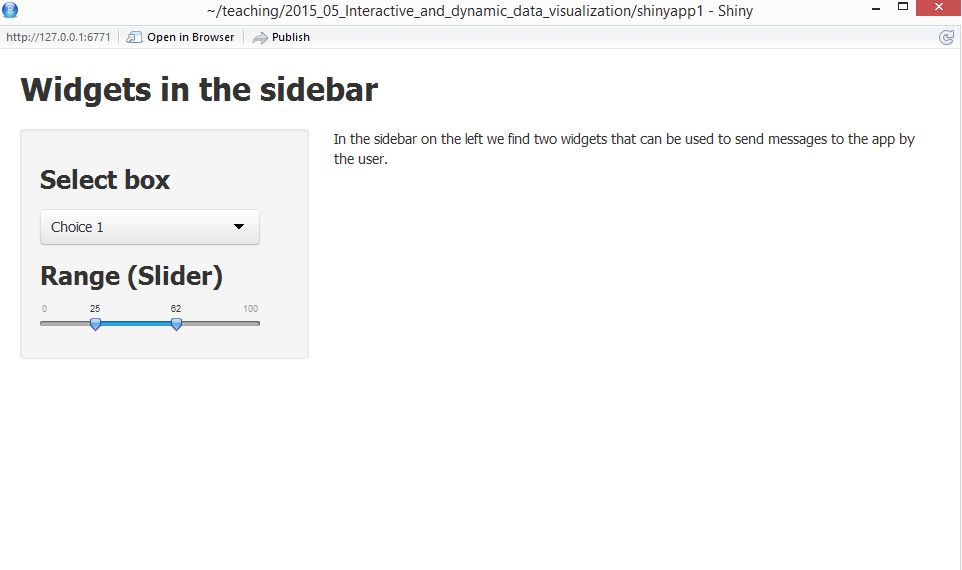
ui <- fluidPage(
titlePanel("Widgets in the sidebar"),
sidebarLayout(
sidebarPanel(
selectInput("select", label = h3("Select box"),
choices = list("Choice 1" = 1,
"Choice 2" = 2,
"Choice 3" = 3),
selected = 1),
sliderInput("slider",
label = h3("Range (Slider)"),
min = 0, max = 100,
value = c(25, 75))
),
mainPanel("In the sidebar on the left we find two widgets that can be used to send input to the server by the user.")
)
)
server <- function(input, output) {}
shinyApp(ui=ui, server = server)5.5 UI Outputs (reactivity)
- Shiny provides a family of functions that turn R objects into output for your user-interface
- Output functions
htmlOutput()… creates raw HTMLimageOutput()… creates imageplotOutput()… creates plottableOutput()… creates tabletextOutput()… creates textuiOutput()… creates raw HTMLverbatimTextOutput()… creates textdataTableOutput()… creates a data table (interactiv)
- A closer look at the example from the beginning… (run the code if you want!)
ui <- fluidPage(
titlePanel("Displaying reactive output"),
sidebarLayout(
    sidebarPanel(
      selectInput("selection", label = h3("Select box"),
        choices = list("Fertility" = "Fertility",
                       "Agriculture" = "Agriculture",
                       "Examination" = "Examination",
                       "Education" = "Education",
                       "Catholic" = "Catholic",
                       "Infant.Mortality" = "Infant.Mortality"),
        selected = 1) # Selection is a variablename!
      ),
    mainPanel( # Draw main panel
      plotOutput("distPlot") # Put the output - a plot - into the main panel
    )
  )
)


server <- function(input, output) {
  output$distPlot <- renderPlot({
      x    <-   swiss[, input$selection]
      hist(x, col = 'darkgray', border = 'white',
           xlab=input$selection,
           main="Swiss French Provinces Fertility and Socioeconomic Indicators (1888) Data")
  })
}

shinyApp(ui=ui, server = server)
6 SERVER
Reactive output automatically responds when users change widget input values
BUT we need to tell the server what to do with the input values
server <- function(input, output) {**construction of output objects in here**})Describe to server how to build the object
- The object will be reactive if the code that builds it calls a widget value
output$distPlot <- renderPlot({...})(store in output list)- render functions wrap outputs and correspond to the type or reactive output
renderImage({...})creates images (saved as a link to a source file)renderPlot({...})creates plotsrenderPrint({...})creates any printed outputrenderTable({...})creates data frame, matrix, other table like structuresrenderText({...})creates character stringsrenderUI({...})creates a Shiny tag object or HTML
6.1 SERVER: Example
ui <- fluidPage(
titlePanel("Displaying reactive output"),
sidebarLayout(
    sidebarPanel(
      selectInput("selection", label = h3("Select box"),
        choices = list("Fertility" = "Fertility",
                       "Agriculture" = "Agriculture",
                       "Examination" = "Examination",
                       "Education" = "Education",
                       "Catholic" = "Catholic",
                       "Infant.Mortality" = "Infant.Mortality"),
        selected = 1) # Selection is a variablename!
      ),
    mainPanel( # Draw main panel
      plotOutput("distPlot") # Put the output - a plot - into the main panel
    )
  )
)

server <- function(input, output) {

  output$distPlot <- renderPlot({
      x    <-   swiss[, input$selection] # USING WIDGET VALUE
      hist(x, col = 'darkgray', border = 'white',
           xlab=input$selection,
           main="Swiss French Provinces Fertility and Socioeconomic Indicators (1888) Data")
  })
}

shinyApp(ui=ui, server = server)
6.2 Exercise: SERVER
- Use the code below (we saw that before).
- Add another reactive output that displays the selection made in the select box as text, e.g. “Infant.mortality”, below the plot in the mainpanel.
- Tipp: You will need add the output function
textOutput(...)to the UI and the functionrenderText({...})to build the output on the server.
- Tipp: You will need add the output function
- If you like add another another output.
ui <- fluidPage(
  titlePanel("Displaying reactive output"),
  sidebarLayout(
    sidebarPanel(
      selectInput("selection", label = h3("Select box"),
                  choices = list("Fertility" = "Fertility",
                                 "Agriculture" = "Agriculture",
                                 "Examination" = "Examination",
                                 "Education" = "Education",
                                 "Catholic" = "Catholic",
                                 "Infant.Mortality" = "Infant.Mortality"), selected = 1)
    ),

    mainPanel(
      plotOutput("distPlot")
    )
  )
)

server <- function(input, output) {
  output$distPlot <- renderPlot({
    x    <-   swiss[, input$selection]
    hist(x, col = 'darkgray', border = 'white', xlab=input$selection, main="Swiss French Provinces Fertility and Socioeconomic Indicators (1888) Data")
  })

}

shinyApp(ui=ui, server = server)
Exercise solution
ui <- fluidPage(
  titlePanel("Displaying reactive output"),
  sidebarLayout(
    sidebarPanel(
      selectInput("selection", label = h3("Select box"),
                  choices = list("Fertility" = "Fertility",
                                 "Agriculture" = "Agriculture",
                                 "Examination" = "Examination",
                                 "Education" = "Education",
                                 "Catholic" = "Catholic",
                                 "Infant.Mortality" = "Infant.Mortality"), selected = 1)
    ),

    mainPanel(
      plotOutput("distPlot"),
      textOutput("text1")
    )
  )
)

server <- function(input, output) {
  output$distPlot <- renderPlot({
    x    <-   swiss[, input$selection]
    hist(x, col = 'darkgray', border = 'white', xlab=input$selection, main="Swiss French Provinces Fertility and Socioeconomic Indicators (1888) Data")
  })
  output$text1 <- renderText({
    input$selection
  })
}
shinyApp(ui=ui, server = server)
7 Summary
To build reactive shiny apps…
- Use
*Outputfunctions to place reactive objects in the UI (webpage) - Use
render*functions to let R build output objects (on the server)- Render functions are located in
server <- function(input, output) {...}) - R expressions are surrounded by braces,
{}inrender*functions - Outputs of
render*are saved in theoutputlist, with one entry for each reactive object in your app - Reactivity by including an
inputvalues in arender*expression
- Render functions are located in
- Often times you will adapt/modify examples that you find online
8 Loading things
8.1 Loading things (1)
- When is code in a shiny app run?
- So where shall we put the function to load the dataset?
- Where shall we put a function that creates an interactive graph?
8.2 Loading things (2)
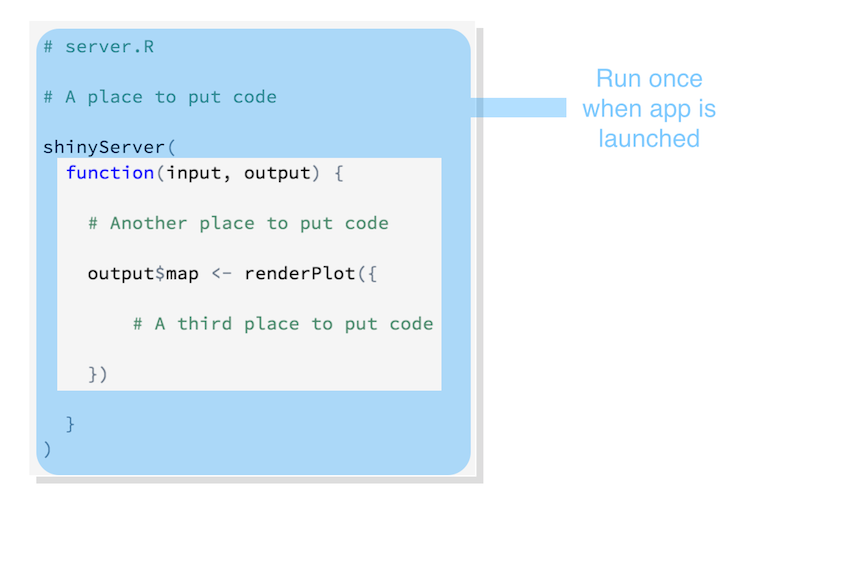
Code outside
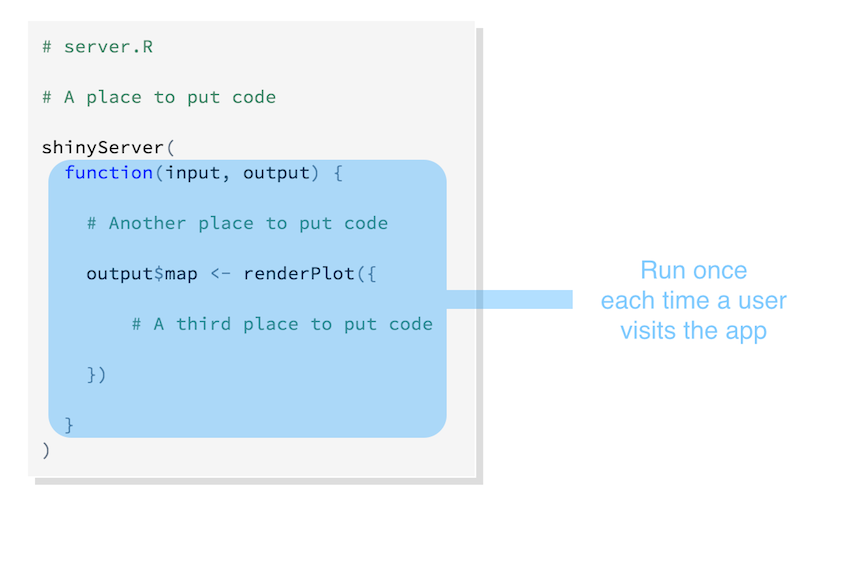
server <- function(input, output) {}is run once, when you launch your appCode inside
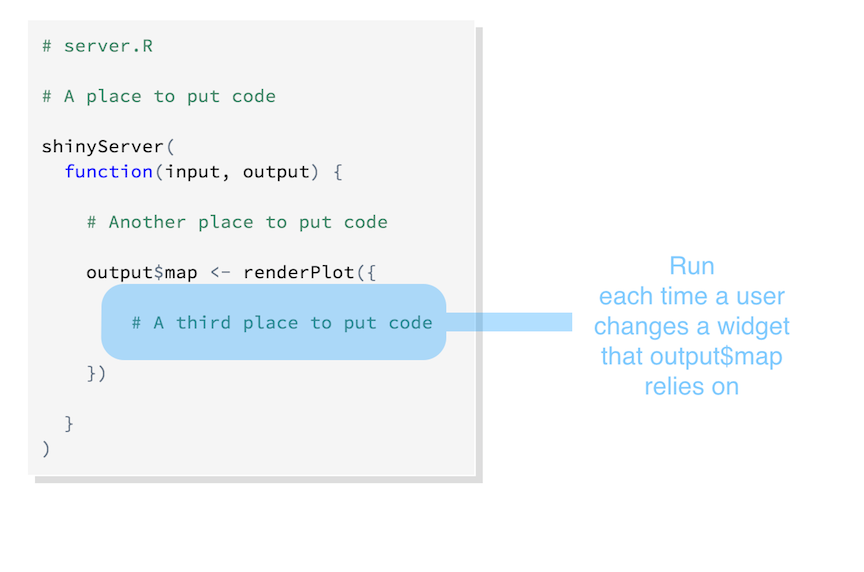
server <- function(input, output) {}is run once each time a user visits your appCode inside
render*functions is rerun constantly (not only when user changes widget value, see reactivity])That means…
- Load Source scripts, libraries, and data outside of
serverfunction (at the beginning)- Store data in
www/folder in your app directory - Access with
read.table("www/swiss.csv", sep=",") - Access online data by inserting the url into the
read*function (e.g.read.table())
- Store data in
- User specific objects (e.g. object that records user’s session information) are defined inside shinyServer’s unnamed function, but outside of any render* calls
- e.g. user registers himself, user data as input data (compare income)
- Code/objects that are affected by choices in widgets must be placed witin the a
render*function- Shiny reruns code in a
render*chunk each time a user changes a widget mentioned in the chunk
- Shiny reruns code in a
- Load Source scripts, libraries, and data outside of
Avoid placing code within render function that does not need to be there… for performance reasons!
Example
data <- read.table("http://paulcbauer.eu/wp-content/uploads/2016/10/swiss.csv", sep=",")
# data <- read.table("data/swiss.csv", sep=",")

ui <- fluidPage(

  titlePanel("Displaying reactive output"),
  sidebarLayout(
    sidebarPanel(
      selectInput("selection", label = h3("Select box"),
                  choices = list("Fertility" = "Fertility",
                                 "Agriculture" = "Agriculture",
                                 "Examination" = "Examination",
                                 "Education" = "Education",
                                 "Catholic" = "Catholic",
                                 "Infant.Mortality" = "Infant.Mortality"), selected = 1)
    ),

    mainPanel(
      plotOutput("distPlot"),
      textOutput("text1")
    )))


server <- function(input, output) {

  output$distPlot <- renderPlot({
    x    <-   data[, input$selection]
    hist(x, col = 'darkgray', border = 'white', xlab=input$selection, main="Swiss French Provinces Fertility and Socioeconomic Indicators (1888) Data")
  })
  output$text1 <- renderText({
    input$selection
  })
}
shinyApp(ui = ui, server = server)
9 Exercise
- Take your own data.
- Use the code below.
- Built a simple app that let’s the user select variables in your dataset and plot them (Tipp: First test whether the plot works normally in R, e.g., if the data is non-numeric)
- Think of possible extensions to the app.
# THIS CREATES THE USER INTERFACE
ui <- fluidPage(
titlePanel("My first shiny app :-)"),
sidebarLayout(
    sidebarPanel(
      selectInput("selection", label = h3("Select box"),
        choices = list("Fertility" = "Fertility",
                       "Agriculture" = "Agriculture",
                       "Catholic" = "Catholic"),
        selected = 1)
      ),
    mainPanel(
      plotOutput("distPlot")
    )
    )
)

server <- function(input, output) {

  output$distPlot <- renderPlot({
      x    <-   swiss[, input$selection]
      hist(x, col = 'darkgray', border = 'white', xlab=input$selection,
           main="Swiss French Provinces Fertility and Socioeconomic Indicators (1888) Data")
  })
}

shinyApp(ui = ui, server = server)
10 Example: A simple regression app
- A simply shiny app for a regression model based on the
swissdataset - We’ll use Shiny to…
- …choose which variables are included in the regression
- …display histograms of the outcome and explanatory variables
- …display the results of the estimation
- …draw a scatterplot
- Tip: Program without
input$*values first, i.e. with normal code and add them afterwards- If something doesn’t work you wanna be able to quickly replace
input$*values
- If something doesn’t work you wanna be able to quickly replace
ui <- fluidPage(
  titlePanel("Regression Model (Dataset: Swiss)"),
  sidebarLayout(
    sidebarPanel(
      selectInput("outcome", label = h3("Outcome"),
                  choices = list("Fertility" = "Fertility",
                                 "Agriculture" = "Agriculture",
                                 "Examination" = "Examination",
                                 "Education" = "Education",
                                 "Catholic" = "Catholic",
                                 "Infant.Mortality" = "Infant.Mortality"), selected = 1),

      selectInput("indepvar", label = h3("Explanatory variable"),
                  choices = list("Fertility" = "Fertility",
                                 "Agriculture" = "Agriculture",
                                 "Examination" = "Examination",
                                 "Education" = "Education",
                                 "Catholic" = "Catholic",
                                 "Infant.Mortality" = "Infant.Mortality"), selected = 1)

    ),

    mainPanel(

      tabsetPanel(type = "tabs",

tabPanel("Scatterplot", plotOutput("scatterplot")), # Plot
tabPanel("Distribution", # Plots of distributions
         fluidRow(
           column(6, plotOutput("distribution1")),
           column(6, plotOutput("distribution2")))
         ),
tabPanel("Model Summary", verbatimTextOutput("summary")), # Regression output
tabPanel("Data", DT::dataTableOutput('tbl')) # Data as datatable

      )
    )
    ))


# SERVER
server <- function(input, output) {

  # Regression output
  output$summary <- renderPrint({
    fit <- lm(swiss[,input$outcome] ~ swiss[,input$indepvar])
    names(fit$coefficients) <- c("Intercept", input$var2)
    summary(fit)
  })

  # Data output
  output$tbl = DT::renderDataTable({
    DT::datatable(swiss, options = list(lengthChange = FALSE))
  })


  # Scatterplot output
  output$scatterplot <- renderPlot({
    plot(swiss[,input$indepvar], swiss[,input$outcome], main="Scatterplot",
         xlab=input$indepvar, ylab=input$outcome, pch=19)
    abline(lm(swiss[,input$outcome] ~ swiss[,input$indepvar]), col="red")
    lines(lowess(swiss[,input$indepvar],swiss[,input$outcome]), col="blue")
  }, height=400)


  # Histogram output var 1
  output$distribution1 <- renderPlot({
    hist(swiss[,input$outcome], main="", xlab=input$outcome)
  }, height=300, width=300)

  # Histogram output var 2
  output$distribution2 <- renderPlot({
    hist(swiss[,input$indepvar], main="", xlab=input$indepvar)
  }, height=300, width=300)
}

shinyApp(ui = ui, server = server)
11 COMBINING Shiny and Plotly
- …the best of two worlds
- Plotly graphs offer more functionality than R base graphs
11.1 A simple example
library(plotly)
library(shiny)

ui <- fluidPage(
titlePanel("My first shiny app :-)"),

sidebarLayout(
    sidebarPanel(
      selectInput("selection", label = h3("Select box"),
        choices = list("Fertility" = "Fertility",
                       "Agriculture" = "Agriculture",
                       "Examination" = "Examination",
                       "Education" = "Education",
                       "Catholic" = "Catholic",
                       "Infant.Mortality" = "Infant.Mortality"),
                  selected = 1)
      ),
    mainPanel(plotlyOutput("distPlot"))
    ))


server <- function(input, output) {
  output$distPlot <- renderPlotly({

      x    <-   swiss[, input$selection]
      plot_ly(x = x, type = "histogram") %>% layout(xaxis = list(title=input$selection), title="Swiss French Provinces Fertility and Socioeconomic Indicators (1888) Data")

})}

shinyApp(ui = ui, server = server)
12 Shinylive
12.1 Shinylive vs. normal Shiny app server hosting
12.1.1 Shiny Live
- Execution: Runs in the browser using WebAssembly (Wasm).
- Server: No backend server needed; hosted as static files.
- Performance: Lower latency, but limited by user’s device.
- Scalability: Scales well since it doesn’t rely on server resources.
- Data: Processed locally unless sent to a remote service.
12.1.2 Normal Shiny App
- Execution: Runs on a remote server.
- Server: Requires a backend server (e.g., Shiny Server).
- Performance: Dependent on network and server load.
- Scalability: Limited by server capacity; may need resource scaling.
- Data: Processed and stored on the server; can handle larger datasets.
- Summary: Shiny Live is simpler to deploy and scales easily but is limited by client-side resources. Normal Shiny apps handle more complex tasks but need server management and scaling.
12.2 How to
- We will use the app we created above
- See the website for instructions
install.packages("shinylive")

# Change to the directory in which
# you have the folder with the app
    getwd() # get working directory

    # Change it to the right one
    setwd("C:/Users/Paul/Google Drive/12_ADV_Workshop/live_code")
    dir() # check if app folder is in there


# Turn the app in myshinyapp/ into a Shinylive app in site/:
    shinylive::export("myshinyapp", "site")


# Preview the app by running a web server and visiting it in a browser
    httpuv::runStaticServer("site/")