8 Soil physics
8.1 Motivation
Soil is the physical foundation of terrestrial ecosystems (Lal and Shukla 2004). The soil is composed by different layers and is the interface between the lithosphere and the biosphere. Several processes fundamental like decomposition and nutrient transport take place into the soil, hence studying soil physical, chemical and biological properties is crucial to understand ecosystems.
Soil temperature and water content have a direct impact on two key process in the ecosystem: photosynthesis and respiration, which are basis of carbon dynamics. The former takes place in the canopy, but it requires the transpiration of water that comes from the soil. Moreover the soil temperature influences the leaves energy balance. The majority of ecosystem respiration takes places in the soil (Yuste et al. 2005) and the soil temperature and humidity are the main variables that control the soil respiration. The respiration increases exponentially with temperature (Lloyd and Taylor 1994), however at high temperature it is often limited by water availability (Orchard and Cook 1983).
8.2 Background
Soil temperature and soil water content are both factors that alters soil respiration rate. Soil respiration is a process measured in \(\frac{\mu mol} {m^2 s}\) of \(CO_2\) (Courtois et al. 2018). Soil is an important environmental variable partly in charge of an efficient ecosystem activity. Soil moisture drives changes in stomata conductance, photosynthesis rate and energy partitioning. Water potential is the main reason of the movement of water through osmosis, gravity and air pressure.
Soil water potential is constitute by its matrix potential (adhesive force water-soil particles), osmotic potential (gradient of solute’s [C]), pressure potential(pressure of air) and gravitational potential (mass of water).
The matric potential is mainly influenced by the physical proprieties of the soil water potential, other factors from the soil are very important: particles size, pore volume or pore size. This varies depending on the type of soil, being sandy the soil with the thickest particles size with bigger pores and thus, less water retention capacity.
The soil can store energy as heat, which results in different temperature in the different layers of the soil. The heat flux in the soil depends both on the time and and temperature gradient.
This dependece on the temperature gradient is described by the Fourier’s law which illustrates how the heat transfer in soil with the conduction of its components, from higher to lower temperatures.
\[G = -k \frac{\partial T}{\partial z}\] where:
- \(k\): Thermal conductivity in \((W/mK)\)
- \(T\): Temperature in \(K\)
- \(z\): depth in \(m\)
If the time component is also included in the equation the following relation is true:
\[ \frac{\partial T}{\partial t} = \frac{1}{C_v} [\frac{\partial}{\partial z}(k\frac{\partial T}{\partial z})]\] where \(C_v\) is heat capacity in \(J\ m^{-3}K{-1}\)
The temperature along soil profile varies between day and night. During the day, the temperature of soil is higher than the temperature of air and thus starts to get more equally until night is set. After this occurs, the temperature of air is higher than the soil temperature, with this peak being more distinguish during midnight.
8.3 Sensors and measuring principle
8.3.1 Soil hydrology
For soil hydrology the main variable that are measured are the water content and the water potential.
To measure water content time domain reflectrometry it is used. The principle behind this sensor is that the dielectric constant of the soil depends on the amount of water present. The dielectric constant is estimated by measuring the travel time of a electromagnetic impulse between two rods inserted into the soil.
Water potential is measured using tensionmeters, that consists in a porous ceramic cap connect with a water reservoir under vacuum. The has a low water potential therefore attracts the water from the tensiometer, until an equilibrium point is reached. By measuring the, negative, pressure in the water filled tube the water potential of the soil can be estimated.
8.3.2 Soil temperature
Soil temperature is measured by temperature sensors placed at different depth. Usually a resistance sensor, like the Pt100, is used as long term stability is more important than high frequency response rate. The presence of multiple temperature sensor along the soil profile allows also to estimate the soil heat fluxes.
Soil heat flux can also be directly measured using heat flux plates, which using a series of thermocouple estimated the amount of heat transferred between the hot and the cold side.
8.4 Analysis
library(tidyverse)
library(lubridate)
library(FME)
library(kableExtra)
soil <- read_csv(here::here("Data_lectures/8_Soil_physics/Soil_temperature_bot_garden.csv"))8.4.1 Soil Heat flux
Calculate the soil heat flux in 5cm depth and the soil storage flux for the soil layer above from the soil temperature profile. Assume a thermal conductivity \(k=3.5 W/m K\) and a heat capacity \(c_p=3.5\times10^6 J/m^3K\). Compare your calculations with direct measurements of the soil heat flux. How do thermal conductivity and heat capacity affect your results?
We proceed with the calculation of soil heat flux at 5cm depth, suing the temperature difference between 5 and 10 cm in soil. Also, soil heat storage will be calculated.
c2k <- function(c) c + 273.15
k2c <- function(k) k - 273.15

#using as a reference the soil at 5 cm
d_T_space <- soil$Tsoil_5cm_degC - soil$Tsoil_10cm_degC
d_z_space <- - 0.05 # m


d_z_time <- - 0.03 # m
d_T_time <- c2k(lag(soil$Tsoil_5cm_degC)) - c2k(soil$Tsoil_5cm_degC)
d_t <- 600 # seconds manually calculated from the dataset (10 min)

Cv <- 3.5e6 # J m-3 K-1
k <- 3.5 # W m-1 K-1
soil <- soil %>%
mutate(
flux_time = d_z_time * d_T_time * Cv / d_t, # W m-2
flux_space = - k * (d_T_space / d_z_space), # W m-2
soil_flux = flux_time + flux_space)soil %>%
filter(week(Date)==15) %>%
ggplot(aes(Date, soil_flux)) +
geom_line(aes(col="Calculated"))+
geom_line(aes(y=SoilHeatFlux_Wm2, col="Measured")) +
scale_colour_colorblind() +
labs(y="Soil heat flux (W/m2)", col="Type heat flux")
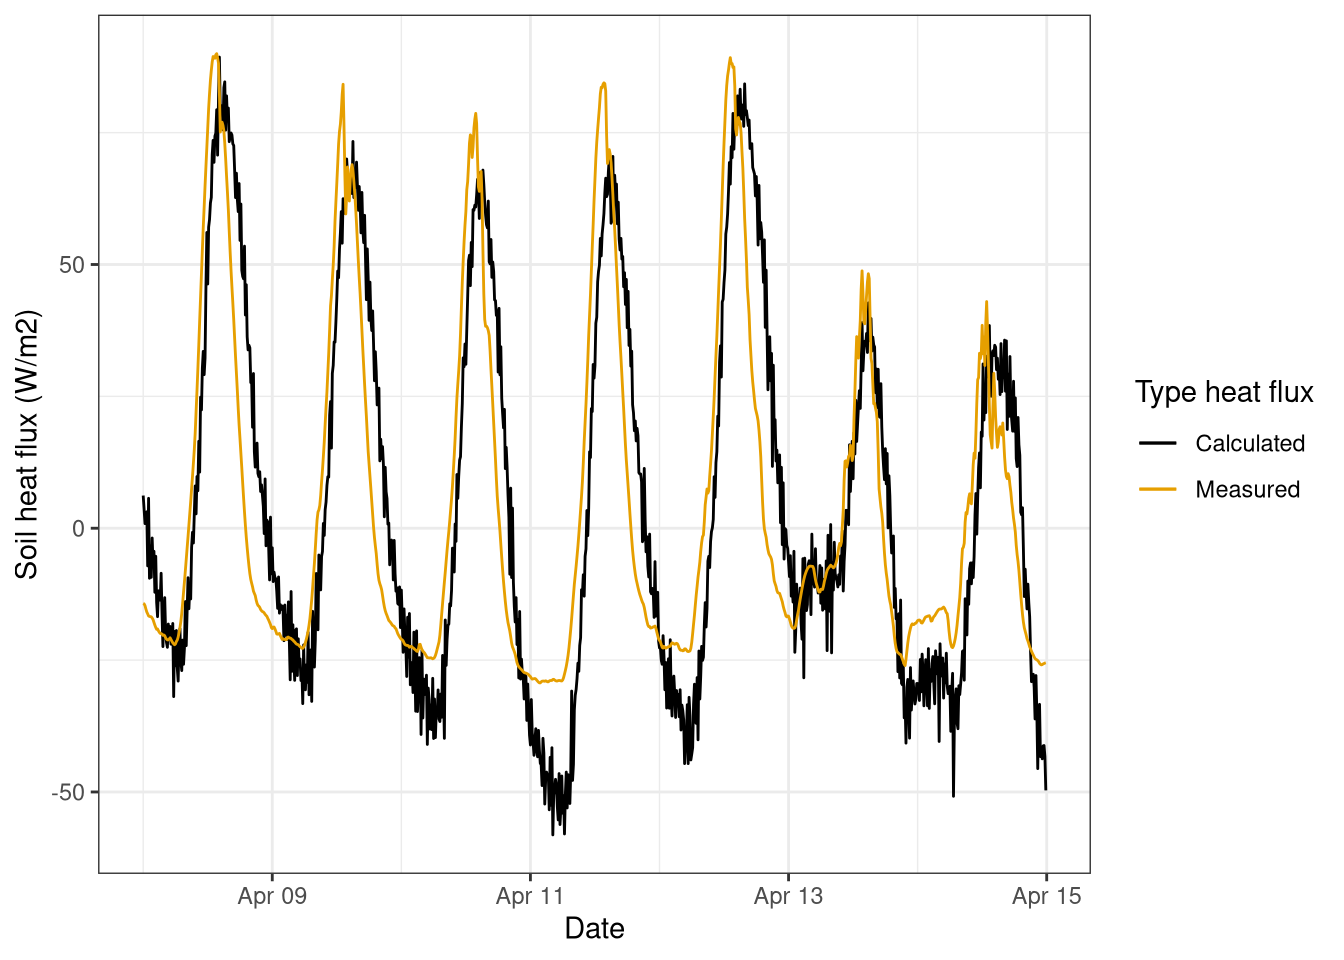
Figure 8.1: Comparison between heat flux measured (red) and calculated (black) over 1 week. Data collected at the botanical garden on the 8th-15th April 2021 at frequency of 10 minutes.
The heat flux measured at 5cm depth is compared with the one calculated in Figure 8.1. The two fluxes are overall comparable, with the exception of the early morning, when the measured flux stays constant at around -25 \(W/m^2\) while the calculated fluxes drops further.
8.4.1.1 Influence of Cv and K
calc_soil_flux <- function(pars){
  d_T_space <- soil$Tsoil_5cm_degC - soil$Tsoil_10cm_degC
  d_z_space <- - 0.05#m
  d_z_time <- - 0.03 # m
  d_T_time <- c2k(lag(soil$Tsoil_5cm_degC)) - c2k(soil$Tsoil_5cm_degC)
  flux_time = d_z_time * d_T_time * pars$Cv / d_t # W m-2
  flux_space = - pars$k * (d_T_space / d_z_space) # W m-2
  soil_flux <-  flux_time + flux_space
  tibble(soil_flux=soil_flux[-1]) #remove first row that is NA
}
pars <- list(Cv = 3.6e6, k=3.5)
sens <- sensFun(calc_soil_flux, pars, map=NULL)summary(sens) %>%
knitr::kable(
booktabs = TRUE,
digits = 2,
caption = 'Flux sensitivity'
) %>%
kable_styling(latex_options = "HOLD_position")| value | scale | L1 | L2 | Mean | Min | Max | N | |
|---|---|---|---|---|---|---|---|---|
| Cv | 3.6e+06 | 3.6e+06 | 0.72 | 4.44 | 0.16 | -216.0 | 86.4 | 5500 |
| k | 3.5e+00 | 3.5e+00 | 1.25 | 4.51 | 0.84 | -85.4 | 217.0 | 5500 |
A local sensitivity analysis (Soetaert and Petzoldt 2010) was made for the two parameters used in the flux calculation: thermal conductivity (\(k\)) and heat capacity (\(C_v\)). The thermal conductivity has the biggest influence on the the overall flux (Table 8.1).
8.4.2 Soil temperature profile
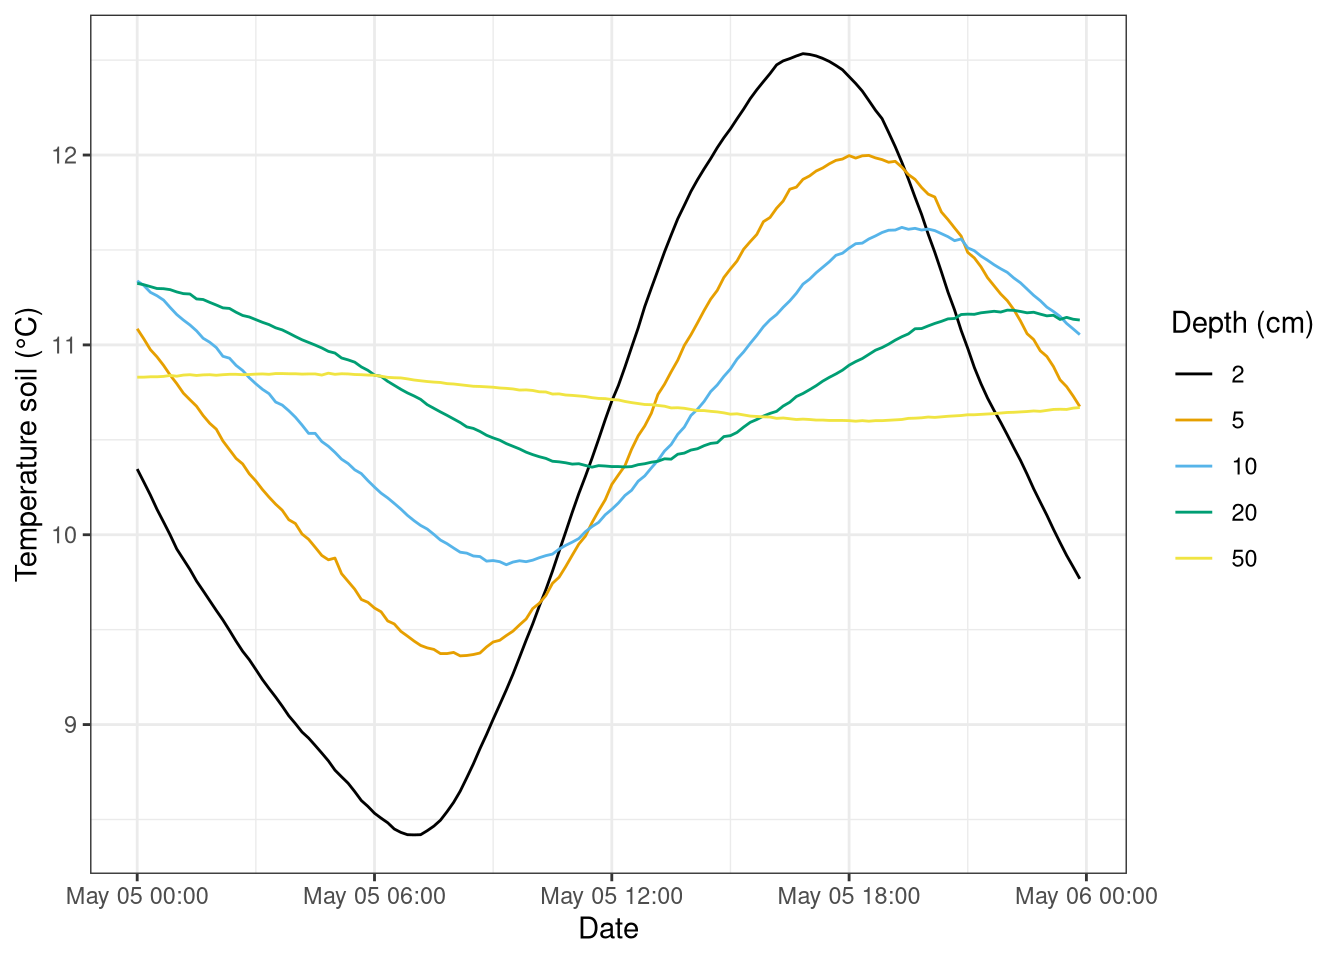
The Figure 8.2 shows the soil temperature for one day of may. It is possible to clearly see the difference of how at 0.5m depth the temperature of soil remains more stable regarding the other depths. During the changes of one day between day and night, at this depth the soil does not have enough time to change the temperature so fast. The opposite is happening at a depth of 2cm or 5cm in soil, where the variations of temperature are stronger. Just before the dawn in the morning, the soil reaches the lowest temperature values, between 8-9 °C at this depths. Then during the day, the highest temperature is reached (12-13 °C) around 6pm where the sun starts going down starting the sunset.
soil_g <- soil %>%
  gather("depth", "T_soil", starts_with("Tsoil")) %>%
  mutate(depth = str_extract(depth, "\\d+"))
soil_g %>%
# last day available to bet as close as possible to summer.
# Number 126 was got as `max(yday(soil$Date))`
filter(yday(Date)==126) %>%
ggplot(aes(Date, T_soil, col=as_factor(depth))) +
geom_line() +
labs(y="Temperature soil (°C)", colour="Depth (cm)") +
scale_color_colorblind()
Figure 8.2: Soil temperature at different depths for one day. Data from 5th of May 2020, forest botanical garden.