5 Precipitation
5.1 Motivation
Precipitation is a very important process in climatology or weather meteorology. Precipitation in relation with water, occurs when atmospheric conditions become saturated enhancing 100% of relative humidity and thus, water condensates and later, it precipitates. Besides, precipitation is a key process part of the water cycle. Its function is to provide with water the natural ecosystem in the planet. Water is the first component needed by plants, to allow the processes of photosynthesis and transpiration.
5.2 Background
The precipitation is usually in form of liquid water, but can also be solid in case of snow or hail. In the previous section, we referred to water condensation. Although this is important part, first needs to be a cloud formation. This takes place by the presence of a warm air flow, thus its cooler surrounding will rise due to a lower density. Together with an increase in height, the air parcel expands and cools down with the dry adiabatic lapse rate. Then, condensation occurs when air temperature and dew point temperature. During the condensation latent heat is released.
It is measured as a volume of water per unit area (\(m^3/m^2\)). The standard unit is the millimeters (mm) of rain, which corresponds to a liter per squared meter. The precipitation intensity is measured in millimeter per hour (\(mm/h\)).
5.3 Sensors and measuring principle
The precipitation sensors, pluviometers, measure the amount of rainfall on a know area.
The most common ones uses a tipping bucket that when gets filled with water it switch position and empty itself. By counting the number of swings of the bucket it is possible to calculate the amount of precipitation. This sensors are the most common one, as they are simple and relatively reliable, however they can produce inaccurate measurements if the amount of precipitation is very low that the buckets doesn’t fill or when there is an high rain intensity that the bucket cannot fill fast enough.
To overcome this limitation there are weighting pluviometers, which have a very sensitive scale under a bucket that collects all the precipitations.
A completely different type of sensors are the laser beam pluviometers, that can estimate the number, size and speed of water droplet and therefore produce an accurate measurement of rain.
Precipitation measurements present additional challenges, in presence of strong winds there is turbulence around the instrument that reduce the amount of rain collected. To mitigate this there are wind shield that can be installed around pluviometers. Moreover precipitation can be solid, hence heating may be required to properly measure it. Finally precipitation has an high spatial heterogeneity, which requires the use of several sensors.
5.4 Analysis
prec <- read_csv(here("Data_lectures/5_Precipitation/P_4sites.csv"))
et <- read_csv(here("Data_lectures/5_Precipitation/ET_4sites.csv"))
sites <- read_csv(here("5_precipitation/station_data.csv")) %>%
  rename(site=`Site-abb`, full_name = Site)
prec_avg <- prec %>%
select(-Date) %>%
gather("site", "prec") %>%
group_by(site) %>%
summarise(prec=mean(prec))
et_avg <- et %>%
select(-Date) %>%
gather("site", "et") %>%
group_by(site) %>%
summarise(et=mean(et))
sites_avg <- sites %>%
inner_join(et_avg, by="site") %>%
inner_join(prec_avg, by="site")5.4.1 ET and precipitation at different latitudes
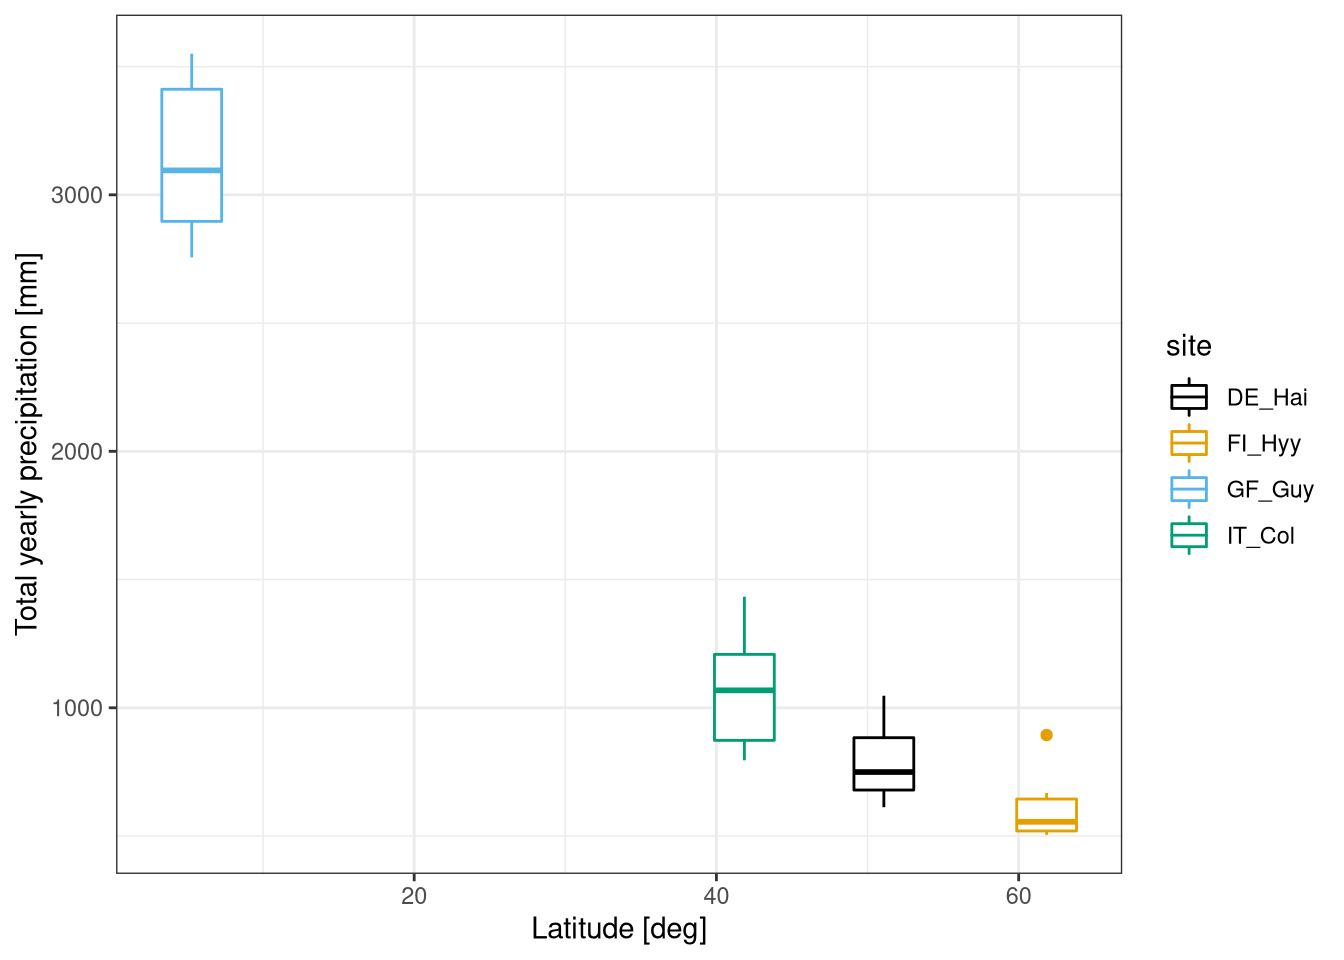
The latitude has an clear influence on precipitation, the closer to the equator the bigger the precipitation (Figure 5.1). This relation depends on the local conditions, for example is not true if deserts are included, but still show an important global pattern.
prec_t <- prec %>%
  gather("site", "prec", -Date)

et_t <- et %>%
  gather("site", "et", -Date)

prec_et <- left_join(prec_t, et_t, by=c("Date", "site"))

sites <- sites %>%
inner_join(prec_et, by="site") ggplot(sites, aes(Lat, prec, colour=site)) +
geom_boxplot() +
labs(y="Total yearly precipitation [mm]",
x="Latitude [deg]") +
scale_color_colorblind()
Figure 5.1: Cumulative yearly precipitation in relation to the latitide 2004-2009.
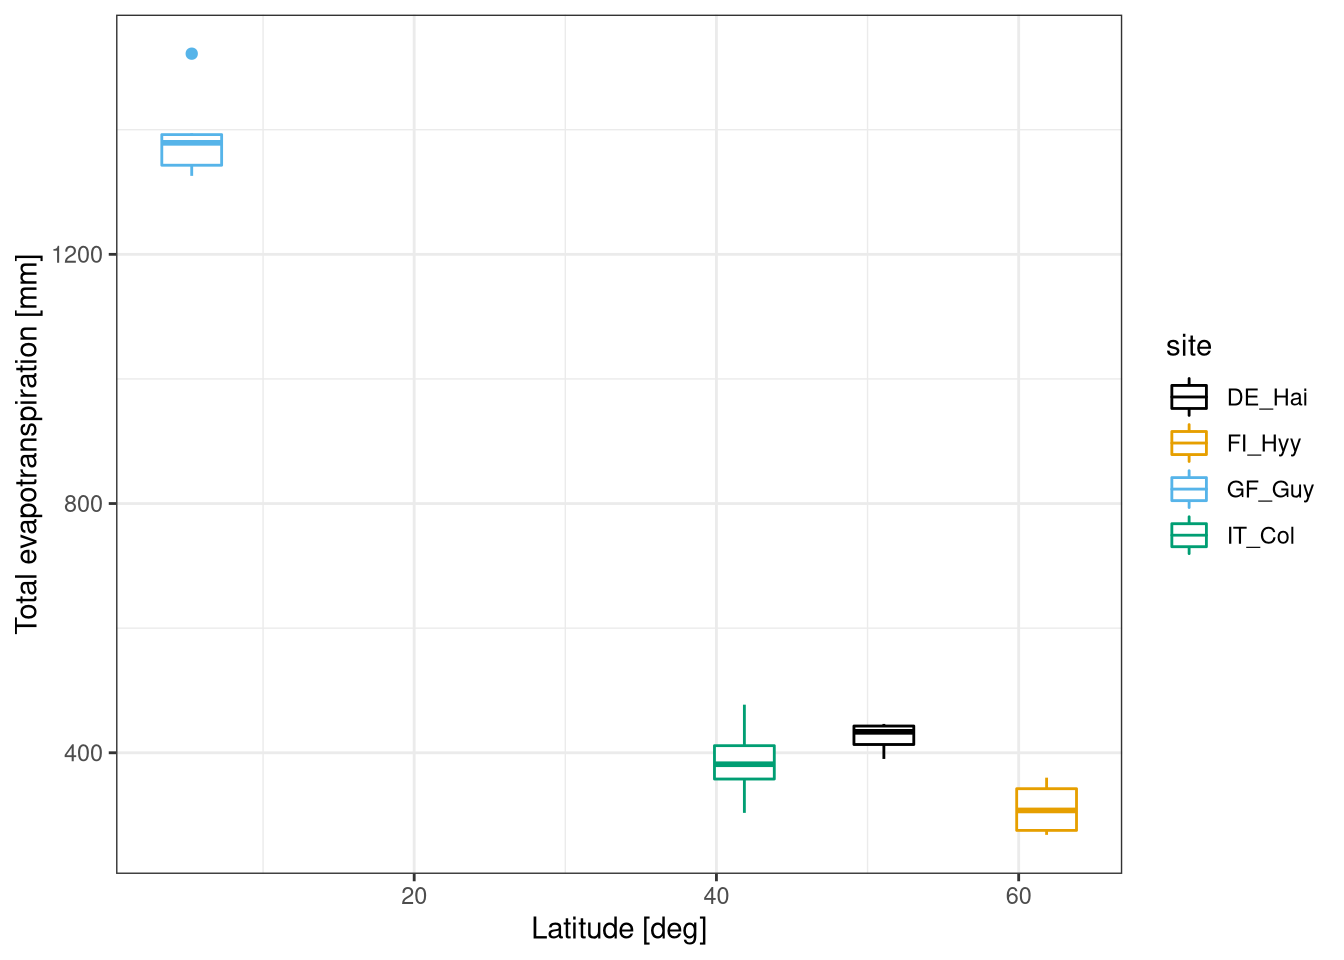
The evapotranspiration (ET) also shows a similar pattern (Figure 5.2). In the tropical forest the ET is much higher than the rest. The latitude pattern is not completely followed by the site in Italy, is likely due to the summer drought in the mediterran ecoesystem that limits the total ET as there is a lack of water.
(et_box <- ggplot(sites, aes(Lat, et, colour=site)) +
  geom_boxplot() +
    labs(y="Total evapotranspiration [mm]",
        x="Latitude [deg]")) +
  scale_color_colorblind()
Figure 5.2: Cumlative evapotranspiration at different latitudes. Data from Fluxnet database 2004-2009.
5.4.2 Evapotranspiration index
The ratio between evapotranspiration and precipitation (evapotranspiration index) is a very useful indicator how precipitation is used by plants during photosynthesis. Evapotranspiration index is the fraction between precipitation and what is coming back to atmosphere through evapotranspiration.
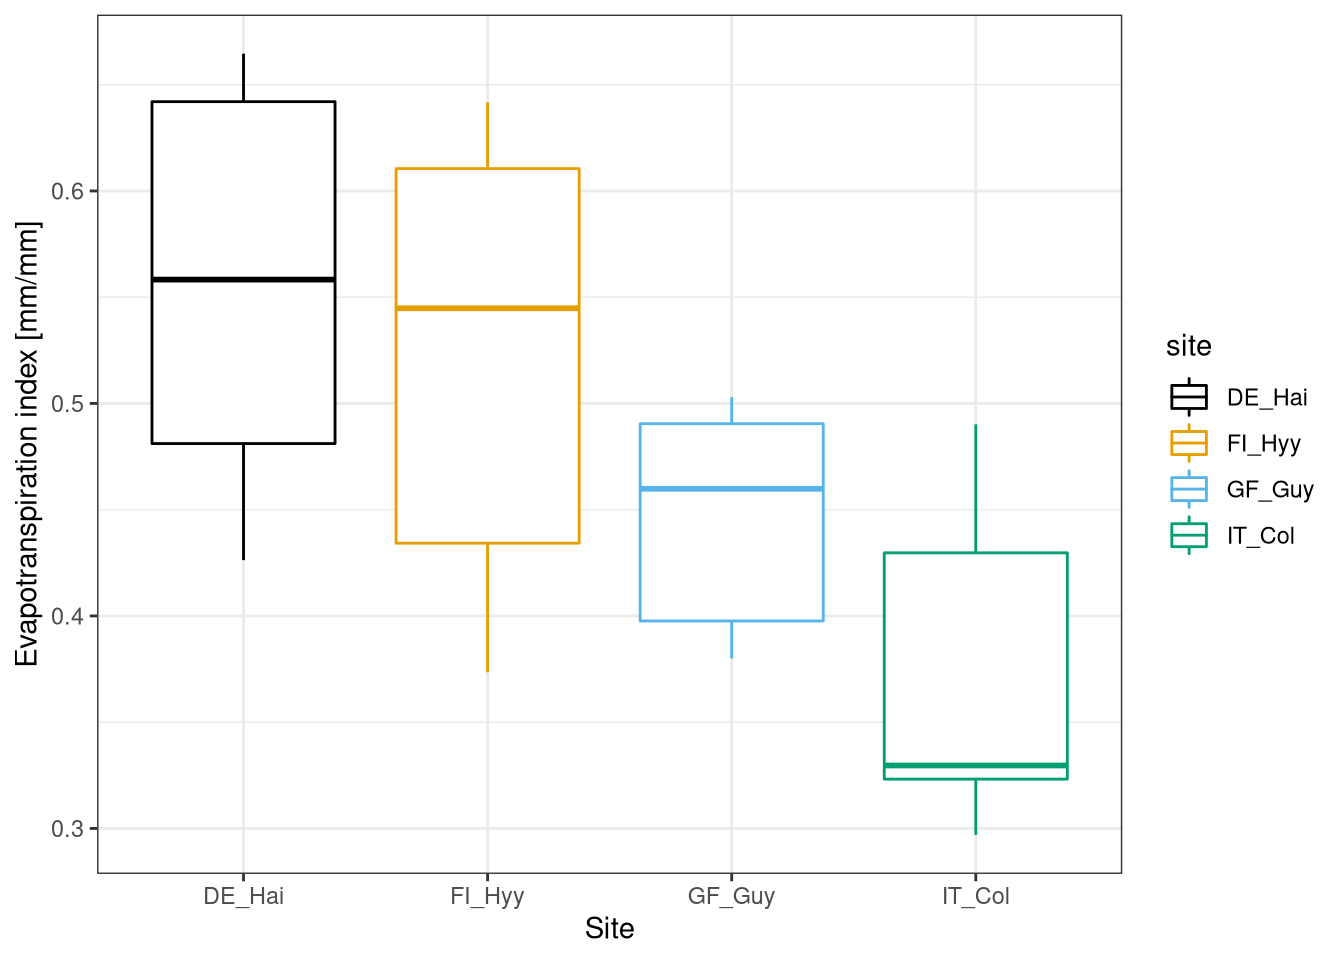
The evapotranspiration index shows have a more interesting pattern (Figure 5.3). The sites in Germany and and Finland have similar values of ET_idx and and overall good efficiency in using water. For the site in French Guyana that ET_idx is lower and this probably due to the fact that the ecosystem is energy limited, the amount of radiation coming from the sun is not enough to evaporate all the available water.
The lowest ET_idx is Italy and its value is probably connected to the water stress of plants, that close stomata and reduce the transpiration even if there may be some water available. Moreover the precipitations are concentrated in the winter when the potential ET is lower and the plant cannot effectively use all the water.
sites$et_idx <- sites$et/sites$prec

sites %>%
ggplot(aes(site, et_idx, colour = site))+
         geom_boxplot()+
         labs( x="Site", y="Evapotranspiration index [mm/mm]") +
  scale_color_colorblind()
Figure 5.3: Evapotranspiration index for different sites. Data from Fluxnet database 2004-2009.