8.3 The Output Interface
8.3.1 body()
dashboardBody(
    shinyjs::useShinyjs(),
    shinyjs::extendShinyjs(text = jsRefreshCode, functions = "refresh"),
    shinyalert::useShinyalert(),
    br(),
    fluidRow( uiOutput("boxes")),br(),
    fluidRow(column(width = 6,uiOutput("plot")),
             column(width = 6,uiOutput("plot_area"))),
    fluidRow(column(width = 10, offset = 1,uiOutput("plot_line")))

  )
These are stock symbol templates, which contain the stock, latest trade price, price change and percentage change in price, return date and volume. In the next chapter, we will learn more about creating templates.
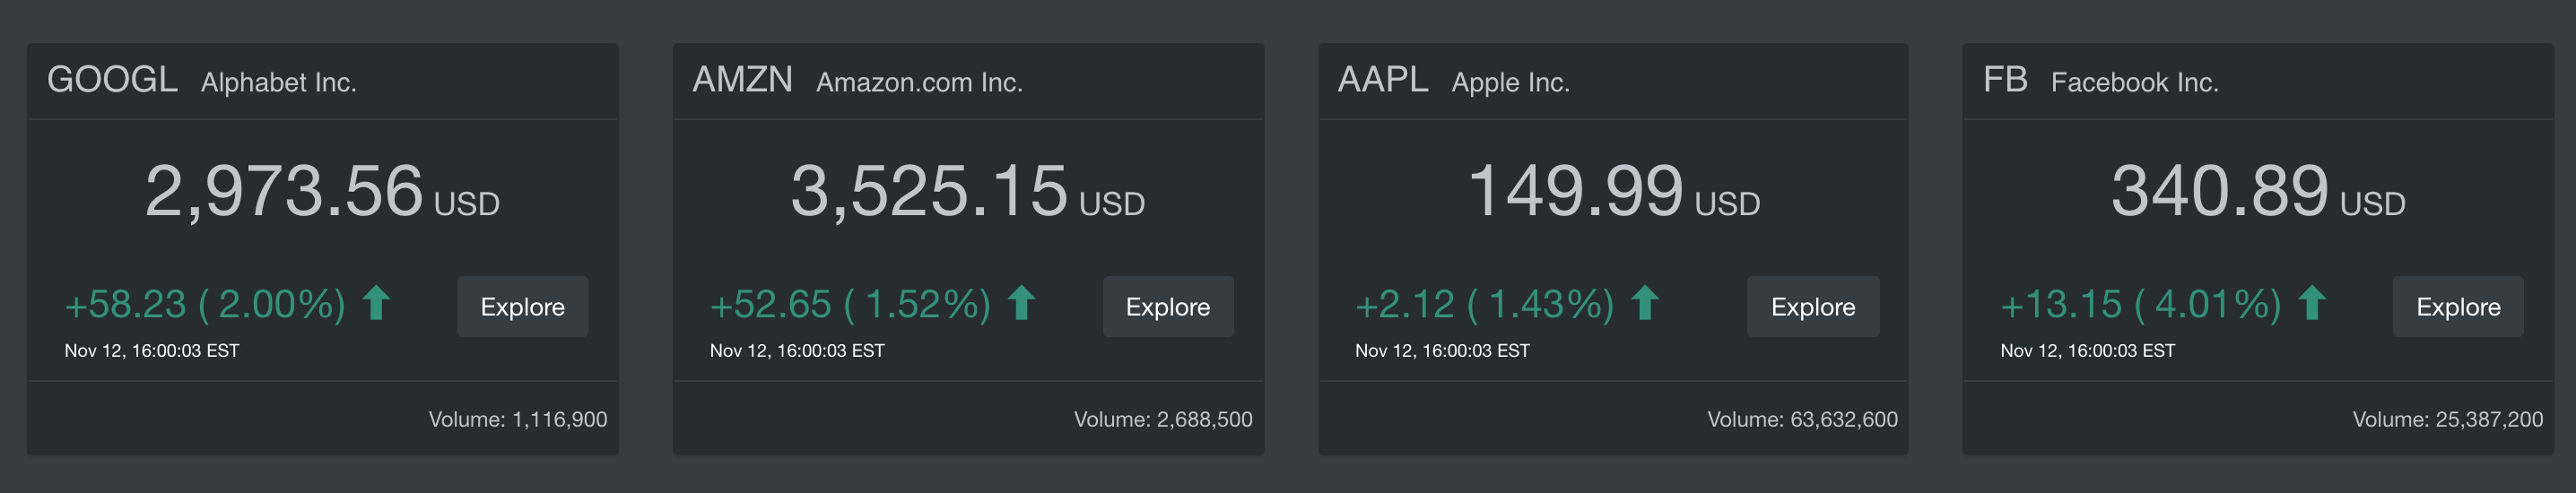
Figure 8.5: The Output Templates
The following charts are the charts of the single stock symbols, the user can explore another sticker by clicking the Explore button. For those plots, I used Plotly to create the interactive plot andggplot2 to create a static plot, but we will learn how to use the gradient color for this.
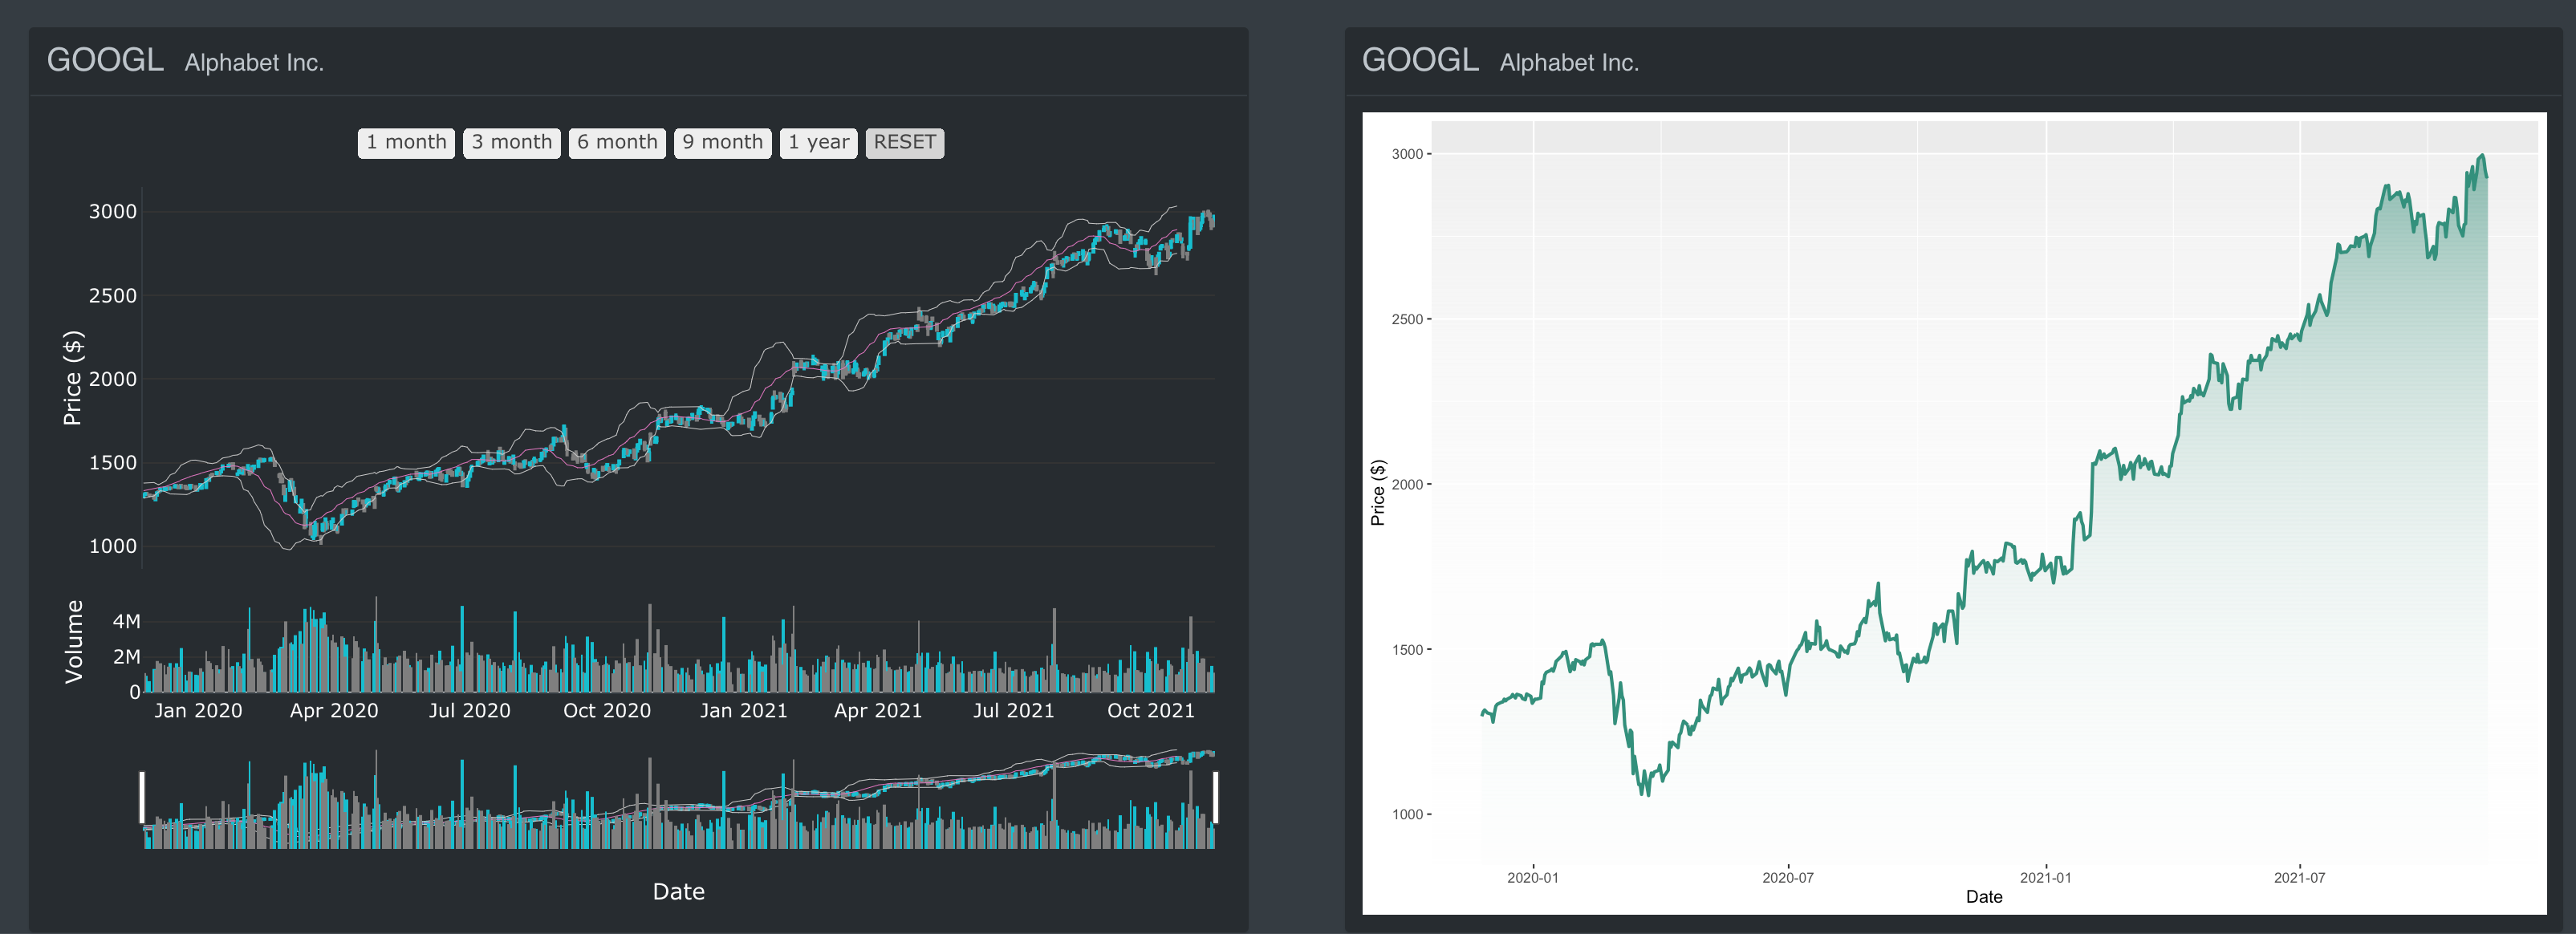
Figure 8.6: The Indiviual Output
The last chart is a line chart that compares all stock symbols.
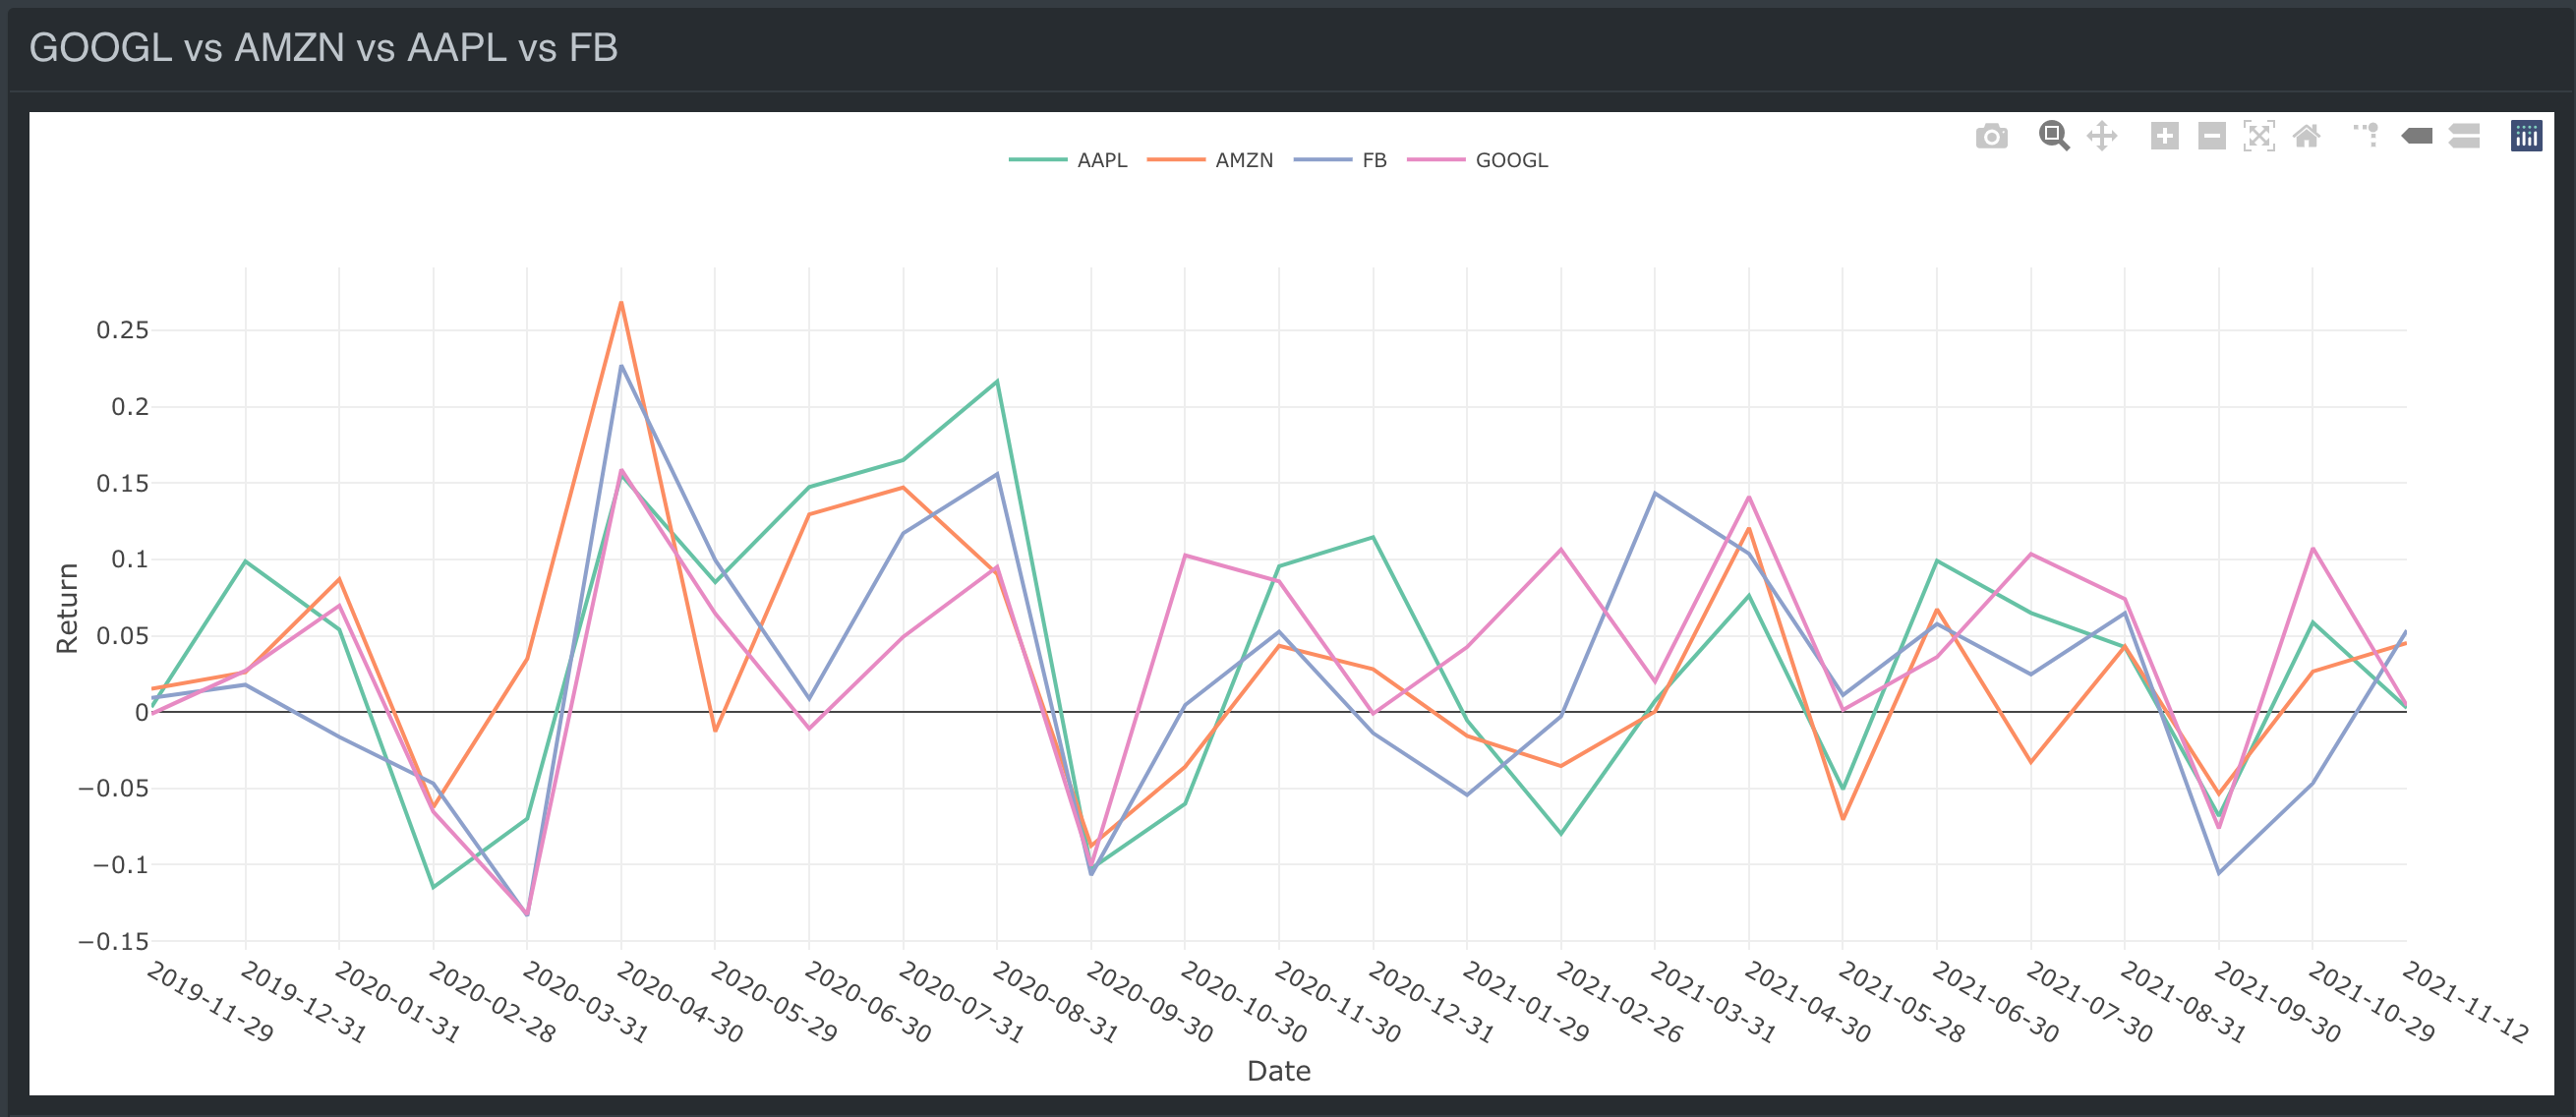
Figure 8.7: Stock Symbols Comparision