3.2 sidebarLayout()
There are 2 components in sidebarLayout(), namely sidebarPanel() and mainPanel(). Later you will see that I have used different layouts like fluidRow,box, etc.
3.2.1 sidebarPanel()
sidebarPanel() is the left panel of the app.
# sidebarPanel
sidebarPanel(
  selectInput("dt", "Select Dataset", choices = c("mtcars", "iris")),
  uiOutput("var"),
  actionButton("submit", "Plot"),
  hr()
)
You see there are three input controls selectInput() , uiOutput(), actionButton() and hr().
selectInput()
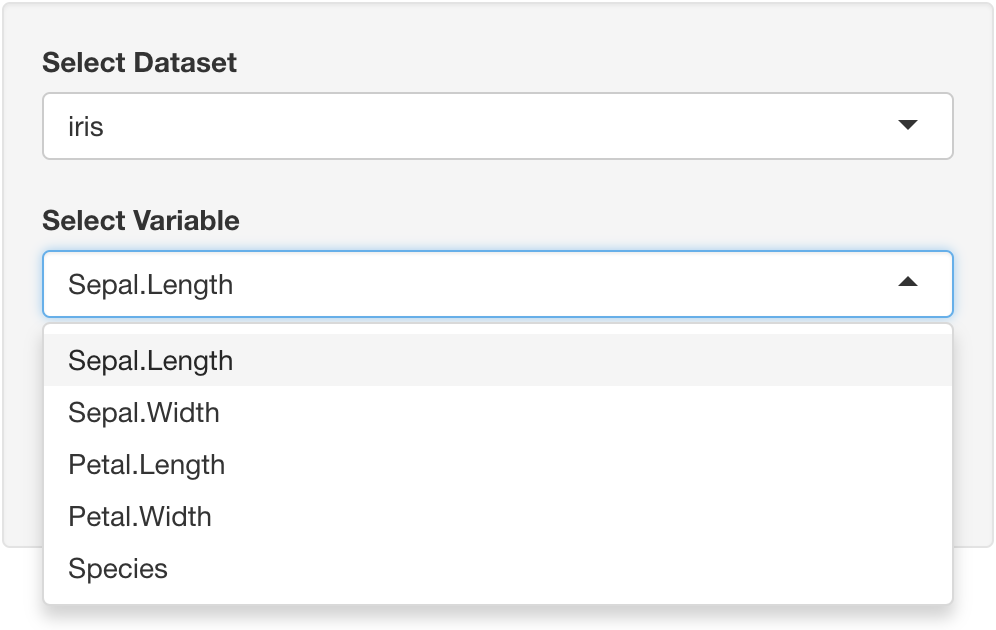
Figure 3.2: Basic Shiny Application Structure - Interface UI
Users can select different datasets, I used "mtcars", and "iris" datasets from this application.
This is the selectInput() function selectInput(inputId, label, choices, selected = NULL, multiple = FALSE,selectize = TRUE, width = NULL, size = NULL). For this function inputId is"dt",label is " Select Dataset " and choices isc ("mtcars", "iris")
uiOutput()
Users can select the variables to be plotted. The choices were variable names from the selected dataset. uiOutput is dynamic UI, it is intended to be used with renderUI on the server side. This is uiOutput() function uiOutput(outputId, inline = FALSE, container = if (inline) span else div, ...). We will go over renderUI next session of Chapter 4
# Select Variable for plot
output$var <- renderUI({
  req(dt())
  selectInput(
    "var_plot",
    label = "Select Variable",
    choices = names(dt()),
    multiple = FALSE
  )
})
actionButton()
This is the actionButton() function actionButton(inputId, label, icon = NULL, width = NULL, ...), executed the Plot action of the selected variable, theinputId argument is " submit ", and label is"Plot".
hr()is a horizontal line.
3.2.2 mainPanel()
mainPanel() is the application’s right panel
There is a
tabsetPanel()function that creates a tabset containingtabPanelelements. Tabsets are useful for dividing output into several independently viewable sections.This is the function tabsetPanel()
tabsetPanel(..., id = NULL, selected = NULL, type = c("tabs", "pills"), position = NULL)- I set
idto"tab_id", my recommendation is to setidfortabsetPanel ()andvaluefortabPanel ()to be easier to use if you have a complex app
I created two
tabPanel():tabPanel("Data Review",value = "data_tab", br(), br(), DT::DTOutput("dtable"), br(), br()). This is Data Review Tab withvalue="data_tab". This tab contained the dataset table, named `DT :: DTOutput (" dtable ") ’.tabPanel (" Plot ", value =" plot_tab ", br (), br (), plotOutput (" plot_out ", width =" 70% ", height =" 550px "), br (), uiOutput (" dl_butt ")). This is the Plot tab withvalue="plot_tab". This tab contained the plot, named" plot_out "and the download button, named" dl_butt "
Note: br()is a line break.