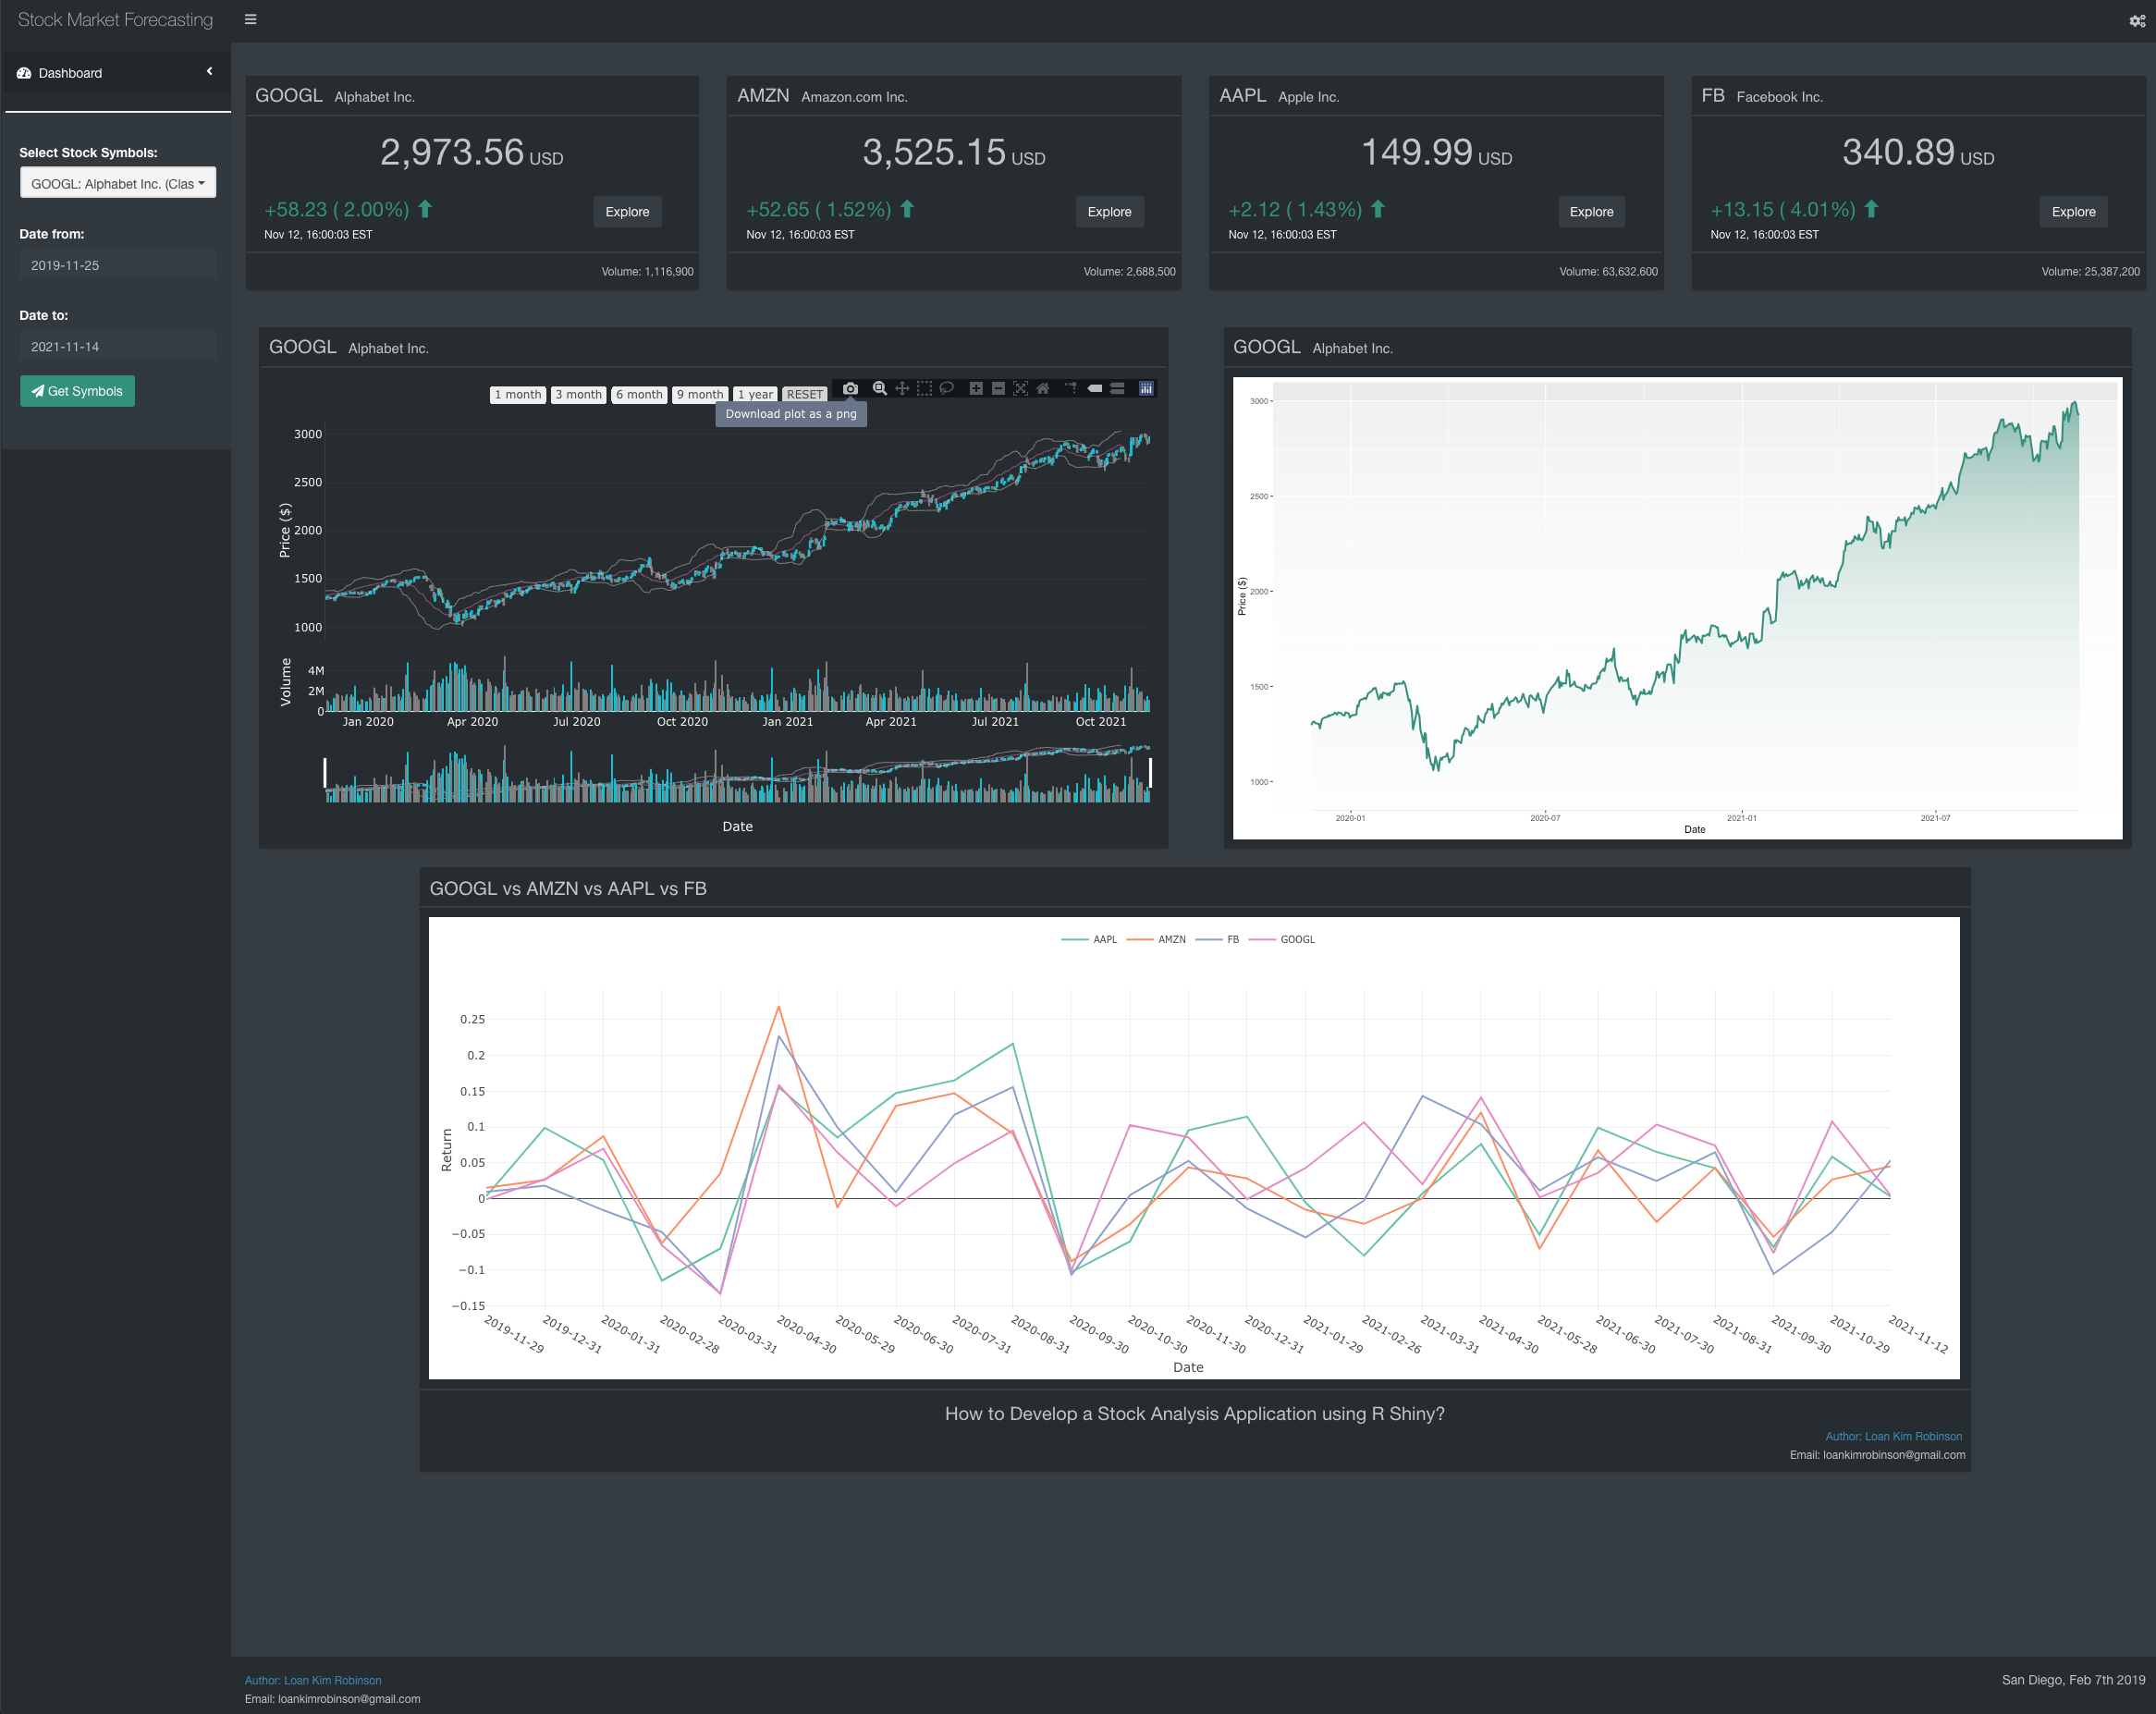
8.1 ShinyDashboard Structure
A “shinydashboard” (https://rstudio.github.io/shinydashboard/) consists of three parts: a header, a sidebar and a body.
Let’s take a look at a simple dashboard, you can see that dashboardHeader () contains the title, dashboardSidebar () contains a sidebarMenu () and dashboardBody () contains output.
library(shiny)
library(shinydashboard)


ui <- dashboardPage(
  dashboardHeader(title = "Basic dashboard"),
  dashboardSidebar(
      sidebarMenu(
    menuItem("Dashboard", tabName = "dashboard", icon = icon("dashboard"))
    )
  ),
  dashboardBody(
    # Boxes need to be put in a row (or column)
    fluidRow(
      box(plotOutput("plot", height = 250)),

      box(
        title = "Controls",
        sliderInput("slider", "Number of observations:", 1, 100, 50)
      )
    )
  )
)

server <- function(input, output) {
  set.seed(122)
  histdata <- rnorm(500)

  output$plot <- renderPlot({
    data <- histdata[seq_len(input$slider)]
    hist(data)
  })
}

shinyApp(ui, server)
But let’s focus on shinydashboardPlus, we are using this package for this application. “shinydashboardPlus” is an extension of “shinydashboard” with “AdminLTE2” components. “AdminLTE2” is a free “Bootstrap 3” dashboard template available at (https://adminlte.io). Customize boxes, add timelines and much more. You can learn more here (https://rinterface.com/shiny/shinydashboardPlus/)
There are six main elements in the dashboardPage () function

Figure 8.1: Stock Market Forcasting Application - Interface UI