4.1 Outputs - render()

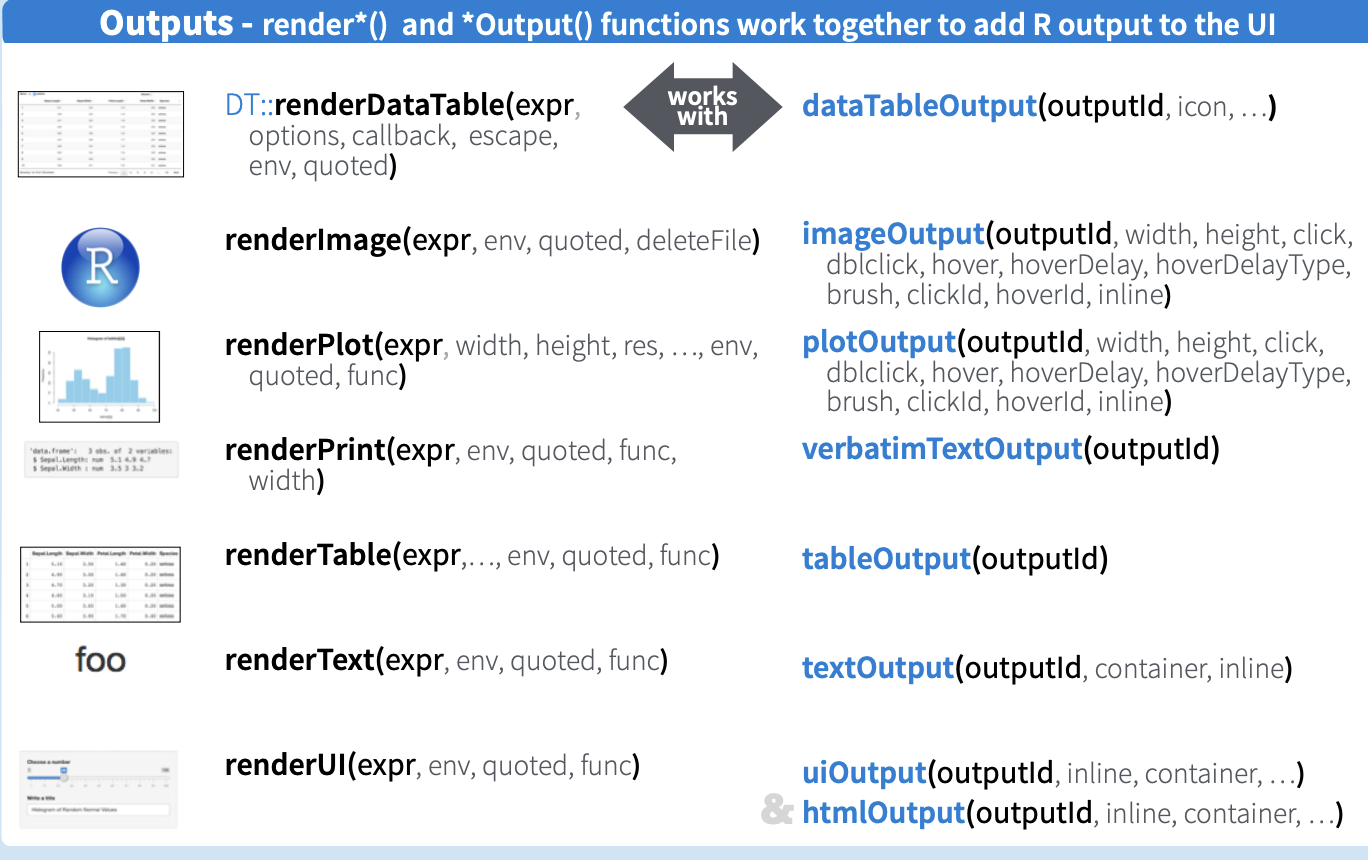
Figure 4.1: Basic Shiny Application Server - Output
4.1.1 renderUI()
This is the renderUI function renderUI(expr, env = parent.frame(), quoted = FALSE,outputArgs = list()). It reactives HTML using the Shiny UI library.
Using uiOutput() and renderUI() to render selected parts of the UI with code. You can see that we had 2 “renderUI” on the server of this app.
# Select Variable for plot
output$var <- renderUI({
  req(dt())
  selectInput(
    "var_plot",
    label = "Select Variable",
    choices = names(dt()),
    multiple = FALSE
  )
})

# create downloadButton to download the plot
output$dl_butt <- renderUI({
  downloadButton("download", "Download The Plot")
})
The first
renderUIcreates aselectInput(), and the output id isvar. So in theuiyou will calluiOutput("var")to create theuiThe second
renderUIcreates adownloadButton(), and the output id isdl_butt. So in theuiyou will calluiOutput("dl_butt")to create theui
4.1.2 renderPlot()

Figure 4.2: Basic Shiny Application Server - Reactivitiy
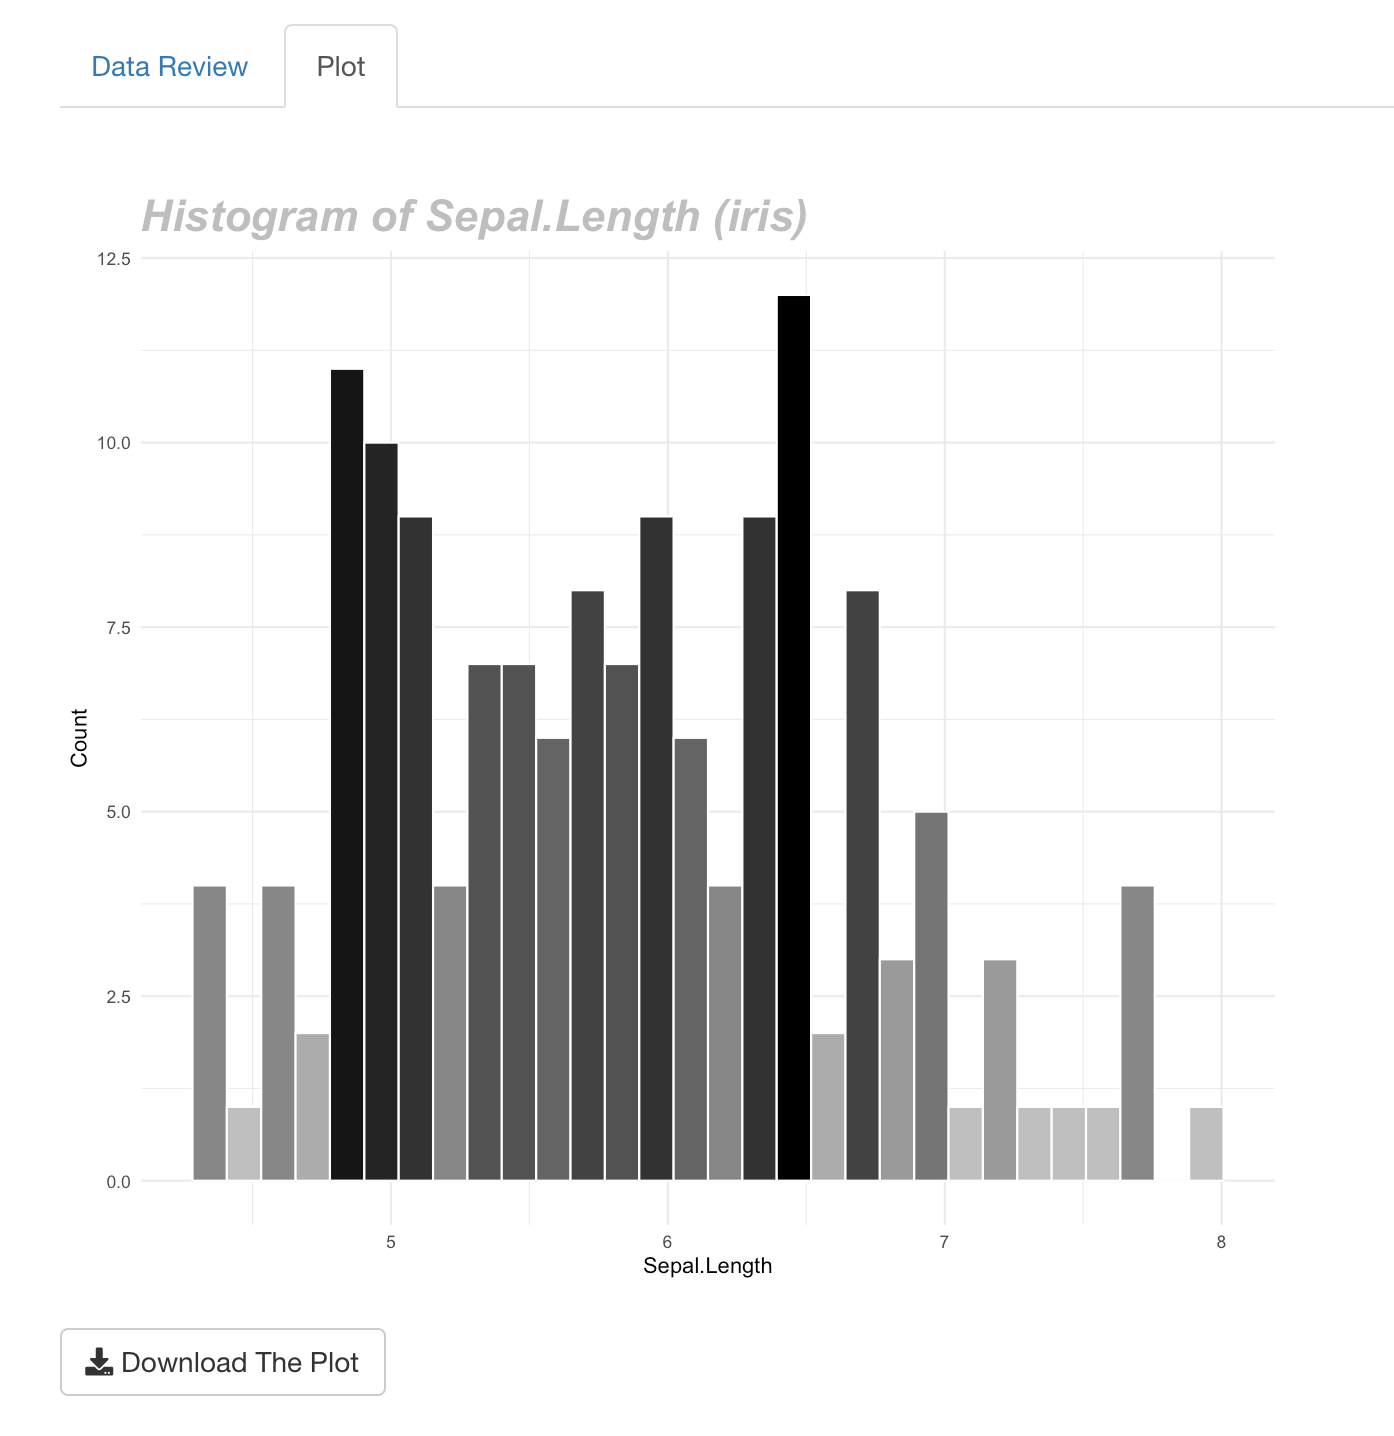
renderPlot() renders a responsive plot suitable for assignment to an output location. Then in the ui, call plotOutput()
Example:
I want to create the histogram chart when the user has selected a continuous variable, or the bar chart when the variable is a character or a factor. To do this I need to create a plot, in this case I saved the plot using the values$plot object, then I want to render a plot responsive, I need to call the renderPlot function ", after that I used plotOutput() in ui to display the output in the desired tab.
4.1.3 renderDT()
renderDT() renders a responsive table widget. This is the renderDT() function renderDT(expr, server = TRUE, env = parent.frame(), quoted = FALSE, funcFilter = dataTablesFilter, ...).
Example:
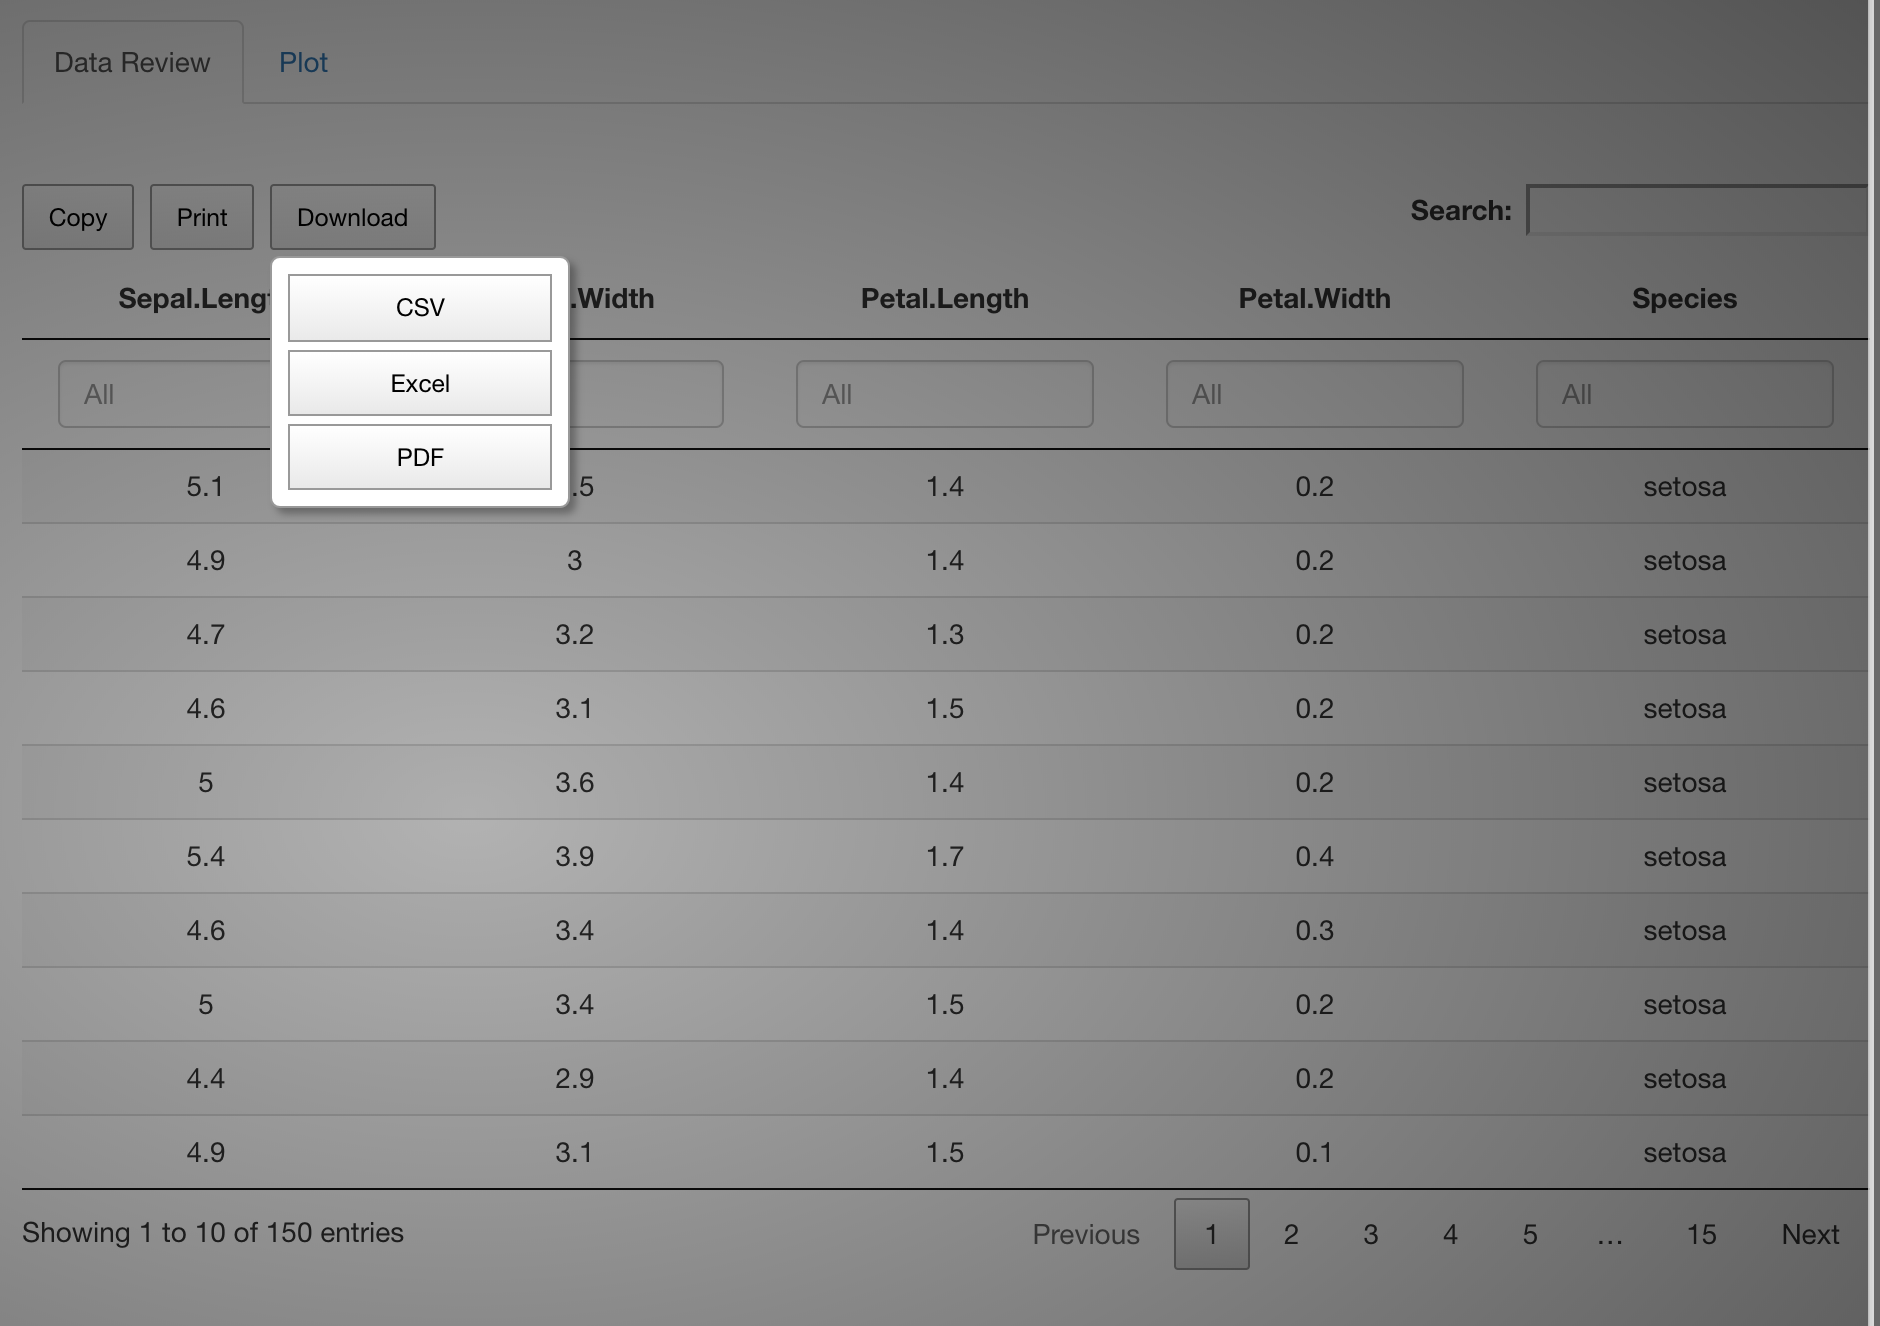
I want to generate a table, which includes the following:
- Filter function.
- 3 buttons: copy, print and download. There is a drop down option for the Download button, the user can download in csv, excell or pdf format.
- The table has a page length of only 10 rows

Figure 4.3: Basic Shiny Application renderDT - DTOutput
# Dt out
output$dtable <- DT::renderDT(server = FALSE, {
  datatable(
    dt(),
    rownames = FALSE,
    filter = 'top',
    # filter option
    extensions = 'Buttons',
    # add buttons feature
    options = list(
      dom = "Blfrtip",
      columnDefs = list(list(
        className = 'dt-center', targets = "_all"
      )),
      ordering = F,
      orientation = 'landscape',
      lengthChange = FALSE,
      pageLength = 10,
      # 10 rows in 1 page
      infor = FALSE,
      autoWidth = FALSE,
      # List of button here
      buttons = list(list(
        extend = 'copy',
        exportOptions = list(
          modifier = list(page = "all") # set list(page = "current") for current page)),
          list(
            extend = 'print',
            exportOptions = list(modifier = list(page = "all"))
          ),
          list(
            extend = 'collection',
            text = 'Download',
            # Change label of button from Collection to Download
            buttons = list(
              list(
                extend = "csv",
                filename = input$dt,
                title = input$dt,
                exportOptions = list(modifier = list(page = "all"))
              ),
              list(
                extend = "excel",
                filename = input$dt,
                title = input$dt,
                exportOptions = list(modifier = list(page = "all"))
              ),
              list(
                extend = "pdf",
                filename = input$dt,
                title = input$dt,
                orientation = 'landscape',
                exportOptions = list(modifier = list(page = "all"))
              )
            )
          )# end button with collection
        )# end button)
      )
}
)
In the ui, call DTOutput()
4.1.4 downloadHandler()
# create downloadButton to download the plot
output$dl_butt <- renderUI({
  downloadButton("download", "Download The Plot")
})

# Download the plot
output$download <- downloadHandler(
  filename = function() {
    paste("plot_", input$var_plot, '.png', sep = '')
  },
  content = function(file) {
    ggsave(file, plot = values$plot)
  }
)