Chapter 7 Stock Market Forcasting Application
Stock Market Forcasting Application is the second application in this book, the purpose of this application helps user to explore the quantmod package (https://www.quantmod.com/), how to use it to transfer data to the app to instrument. Then we will learn how to create the “Stock symbols” templates and add the “Explore” button to visualize that sticker with two different plots. In the end, we will learn how to use the line chart to compare the sticker list.
In the right panel the user can select multiple
Select Stock Symbols, then selectDate fromandDate to, andGet Symbolsbutton.On the left panel, the ouput of multiple
Stock Symbolswas selected, it is the templates, The output of multiple ‘Stock Symbols’ is selected in the left pane, these are the templates, which contains theTitleofStock Symbols, thePrice, theReturnswith theLast Day Return Information,Explore Buttonand theVolume.At the end of the app is a footer app.
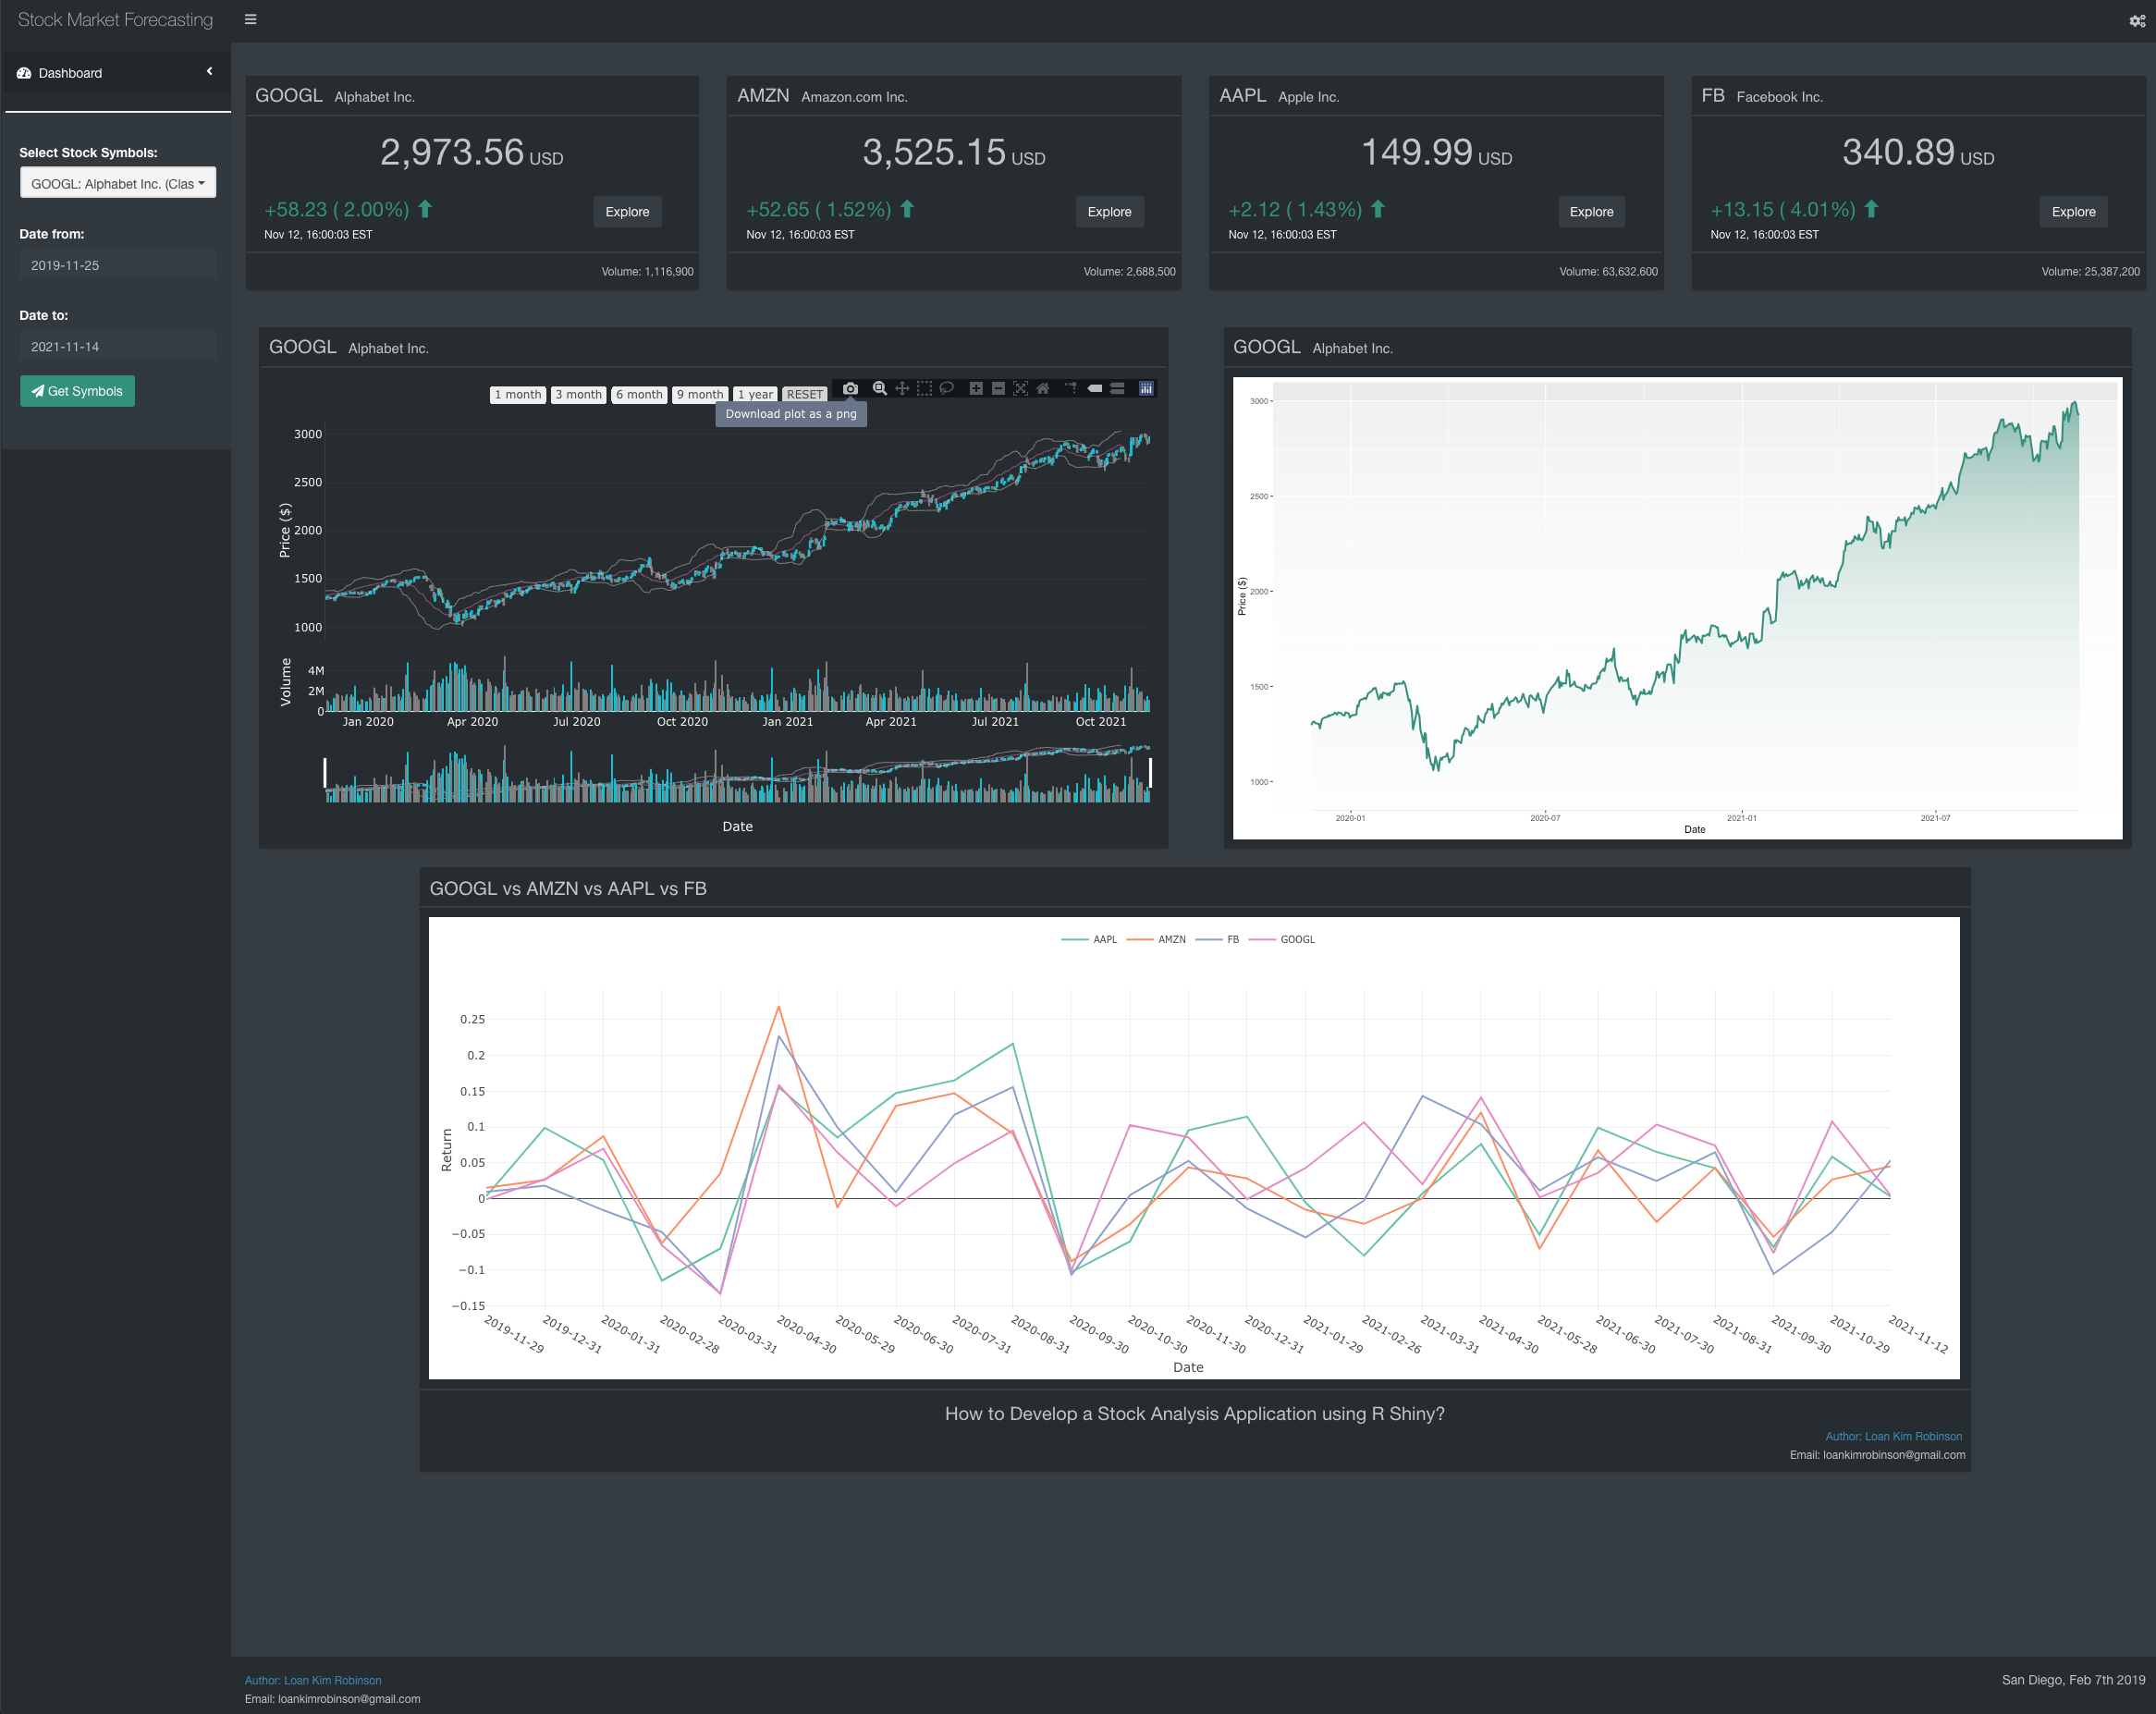
Figure 7.1: Stock Market Forcasting Application - Interface UI