Chapter 11 Google Trend Visualization Application
Google Trend Visualization Application is the third application in this book, the purpose of this application help the user explores the gtrendsR package (https://github.com/PMassicotte/gtrendsR). It is an interface for retrieving and displaying the information returned online by Google Trends is provided. Trends (number of hits) over the time as well as geographic representation of the results can be displayed.
We will practice how to implement Google trend data into the app, create the information boxes with complex function, an US map, and 3D networks plot.
These are the features we cover in this chapter.
- User Inputs.
- Add a search term with
textInput() - Google Product with
selectInput() - Time Period with
selectInput() - Specific Date with
dateRangeInput() Add, Remove, Explore, Close, Download buttons with
actionButtonanddownloadButton- The outputs.
- Display the list of information boxes, which include the range of date, name of the key word, which date has the maximum of hits, the average of hits, and ranking between the keywords users provide.
- There is an icon, which contains 2 buttons, one is Remove and another one is Explore. You either remove or explore more the subject you select.
- US map represents the compare of the subjects by region. You will learn how to apply US map, add different colors, the hoover, and so on.
- 3D relative network plot, this is my favor plot, you will learn a lot about how the keywords connect.
- The bar plot and line plot.
- The last outputs contain the data table.
At the bottom of the application, there is a footer application.
- The layout of the app
The user inputs is on the right panel, the output is on the left panel.
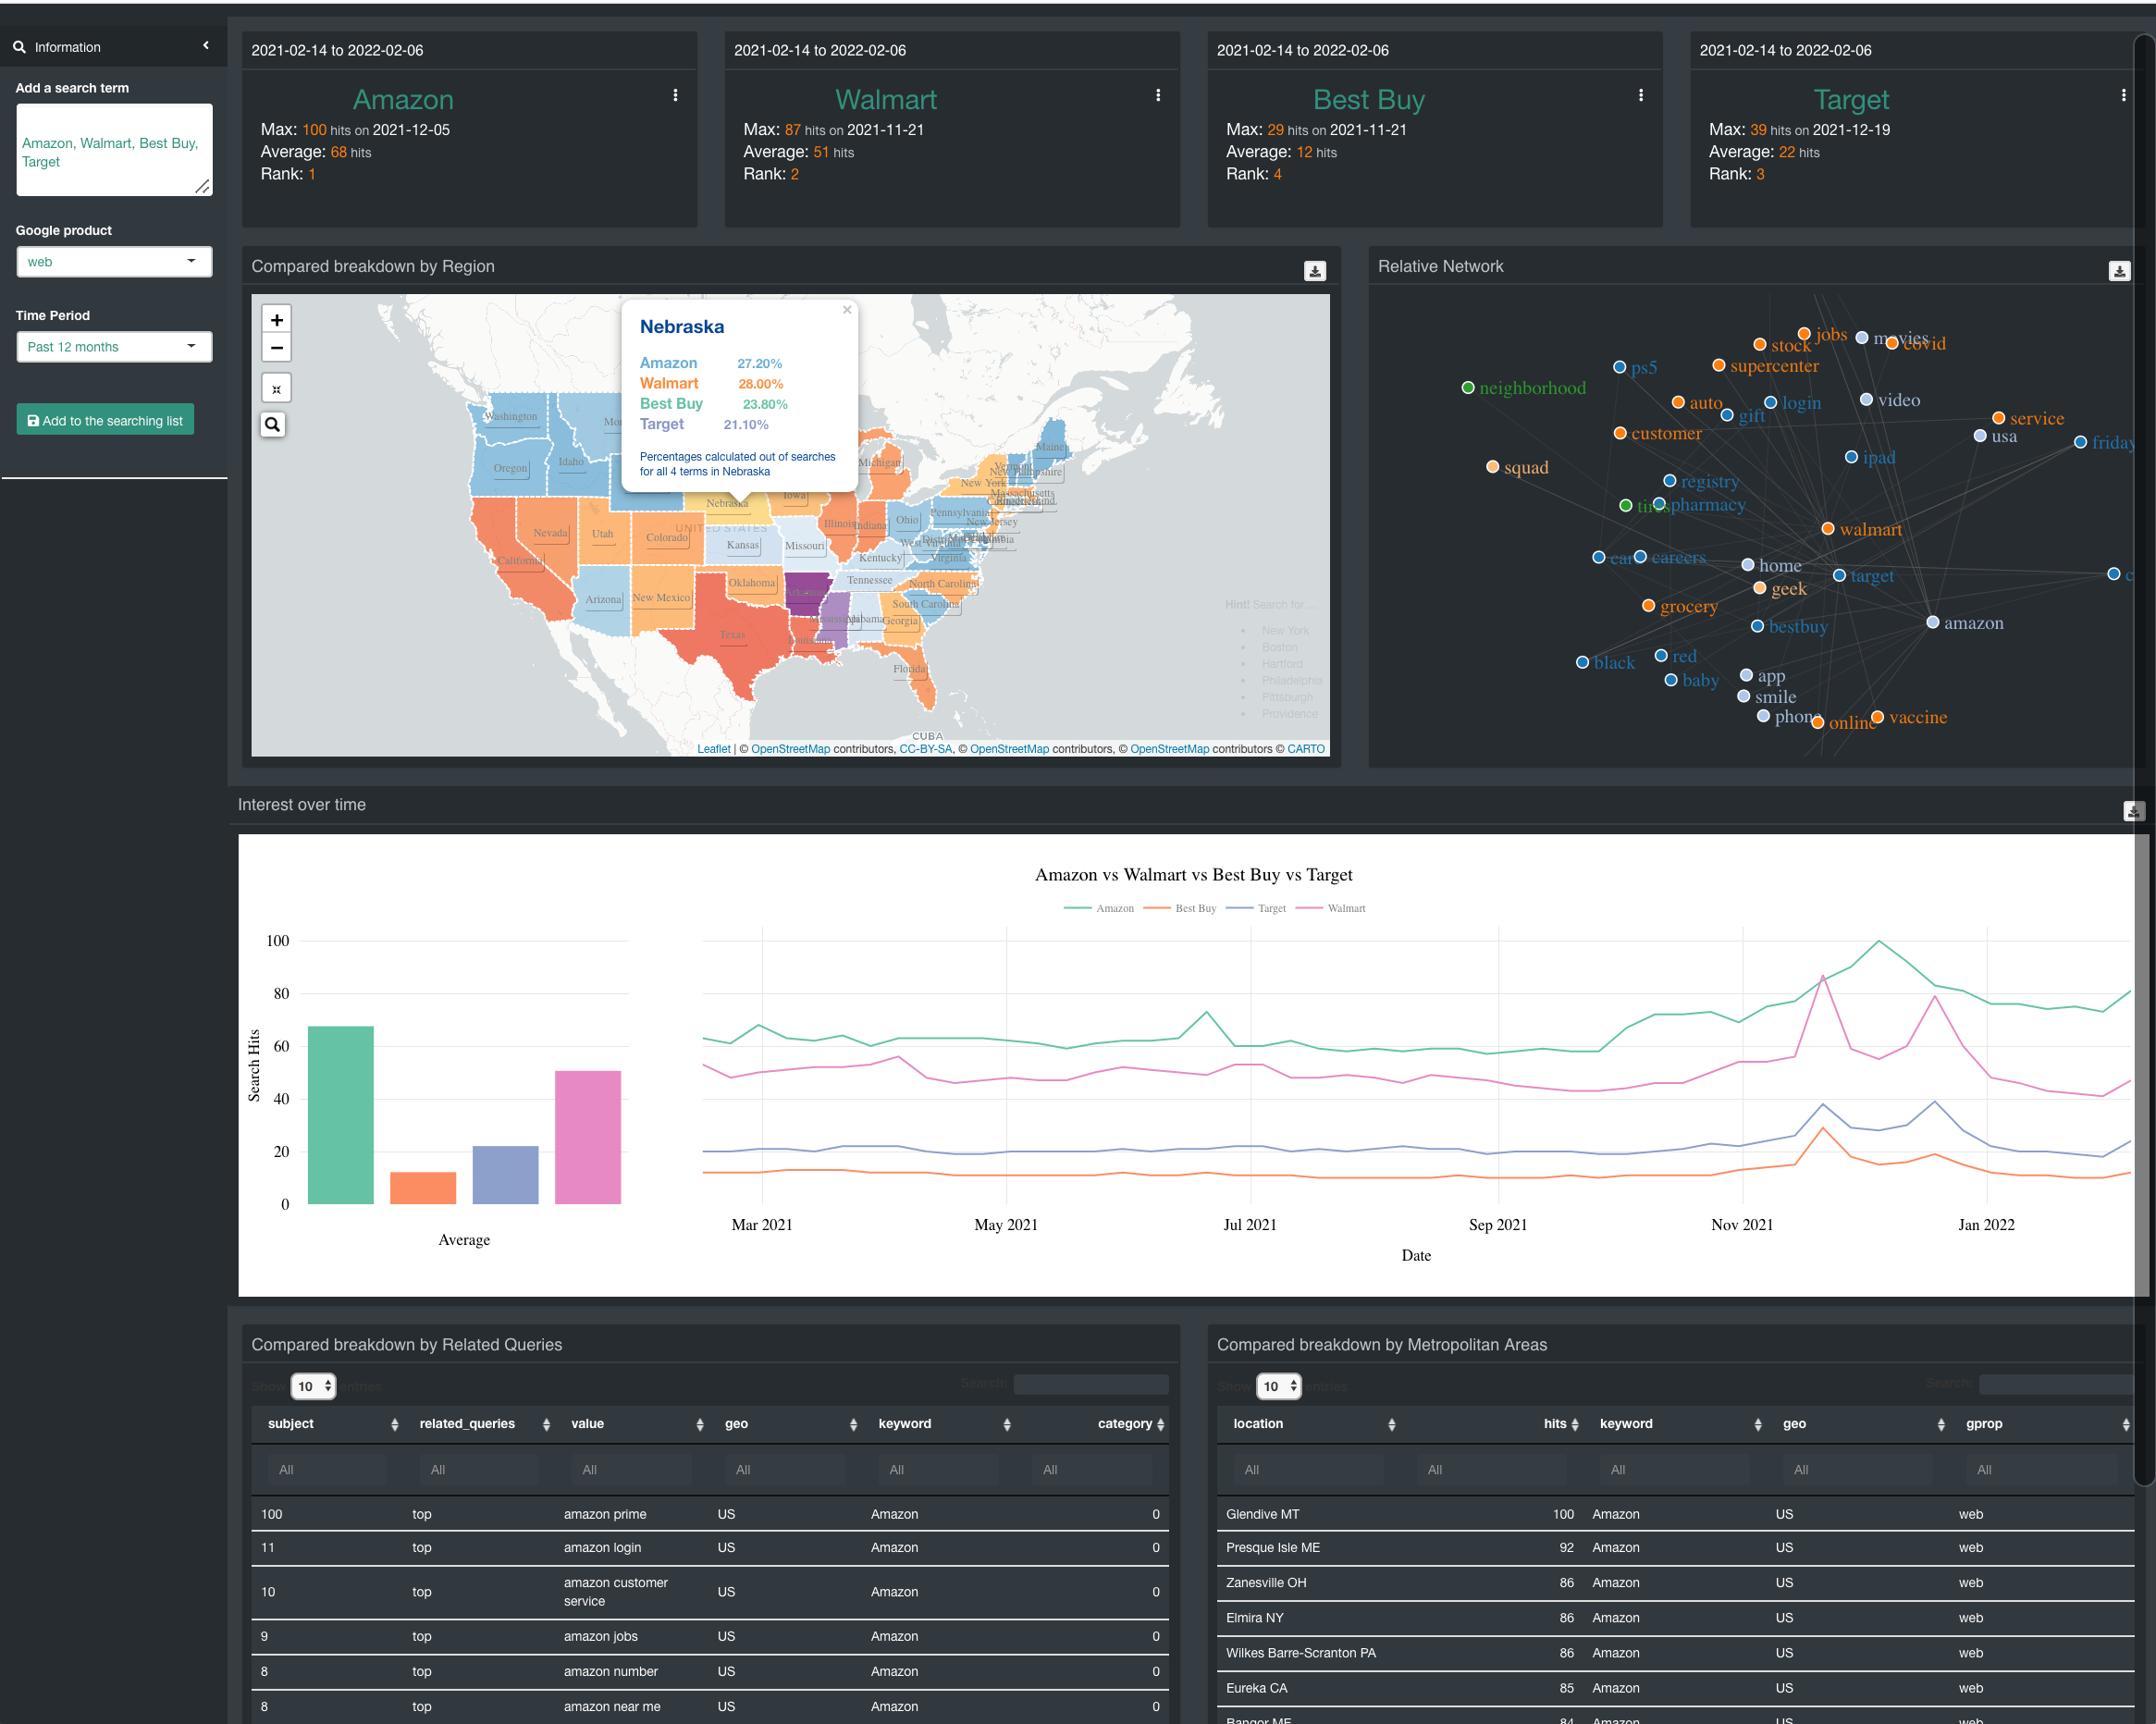
Figure 11.1: Google Trend Visualization Application - Interface UI