Chapter 2 Basic Shiny Application
Welcome to the first Basic Shiny app. The purpose of the application allows the user to easily view the histogram or bar chart and review the data sets. Users can select different datasets and different variables to plot. At the end, we will see how to implement the download of the figure and the selected dataset.
What about the interface? You will learn how to create a sidebar, main panels, tabs, and how to activate the tab, when you choose the tab.
The list of application features:
- In the right panel, the user can select the data, then select the variable for the graph, press the button to plot.
- On the left panel, there are 2 tabs, one for data review, one for chart
At the bottom of the application, there is a footer application.
Data Review Tab includes:
- The data table.
- Buttons to download the data.
Plot Tab includes:
- The Histogram Plot or Barplot.
- Button to download the plot.
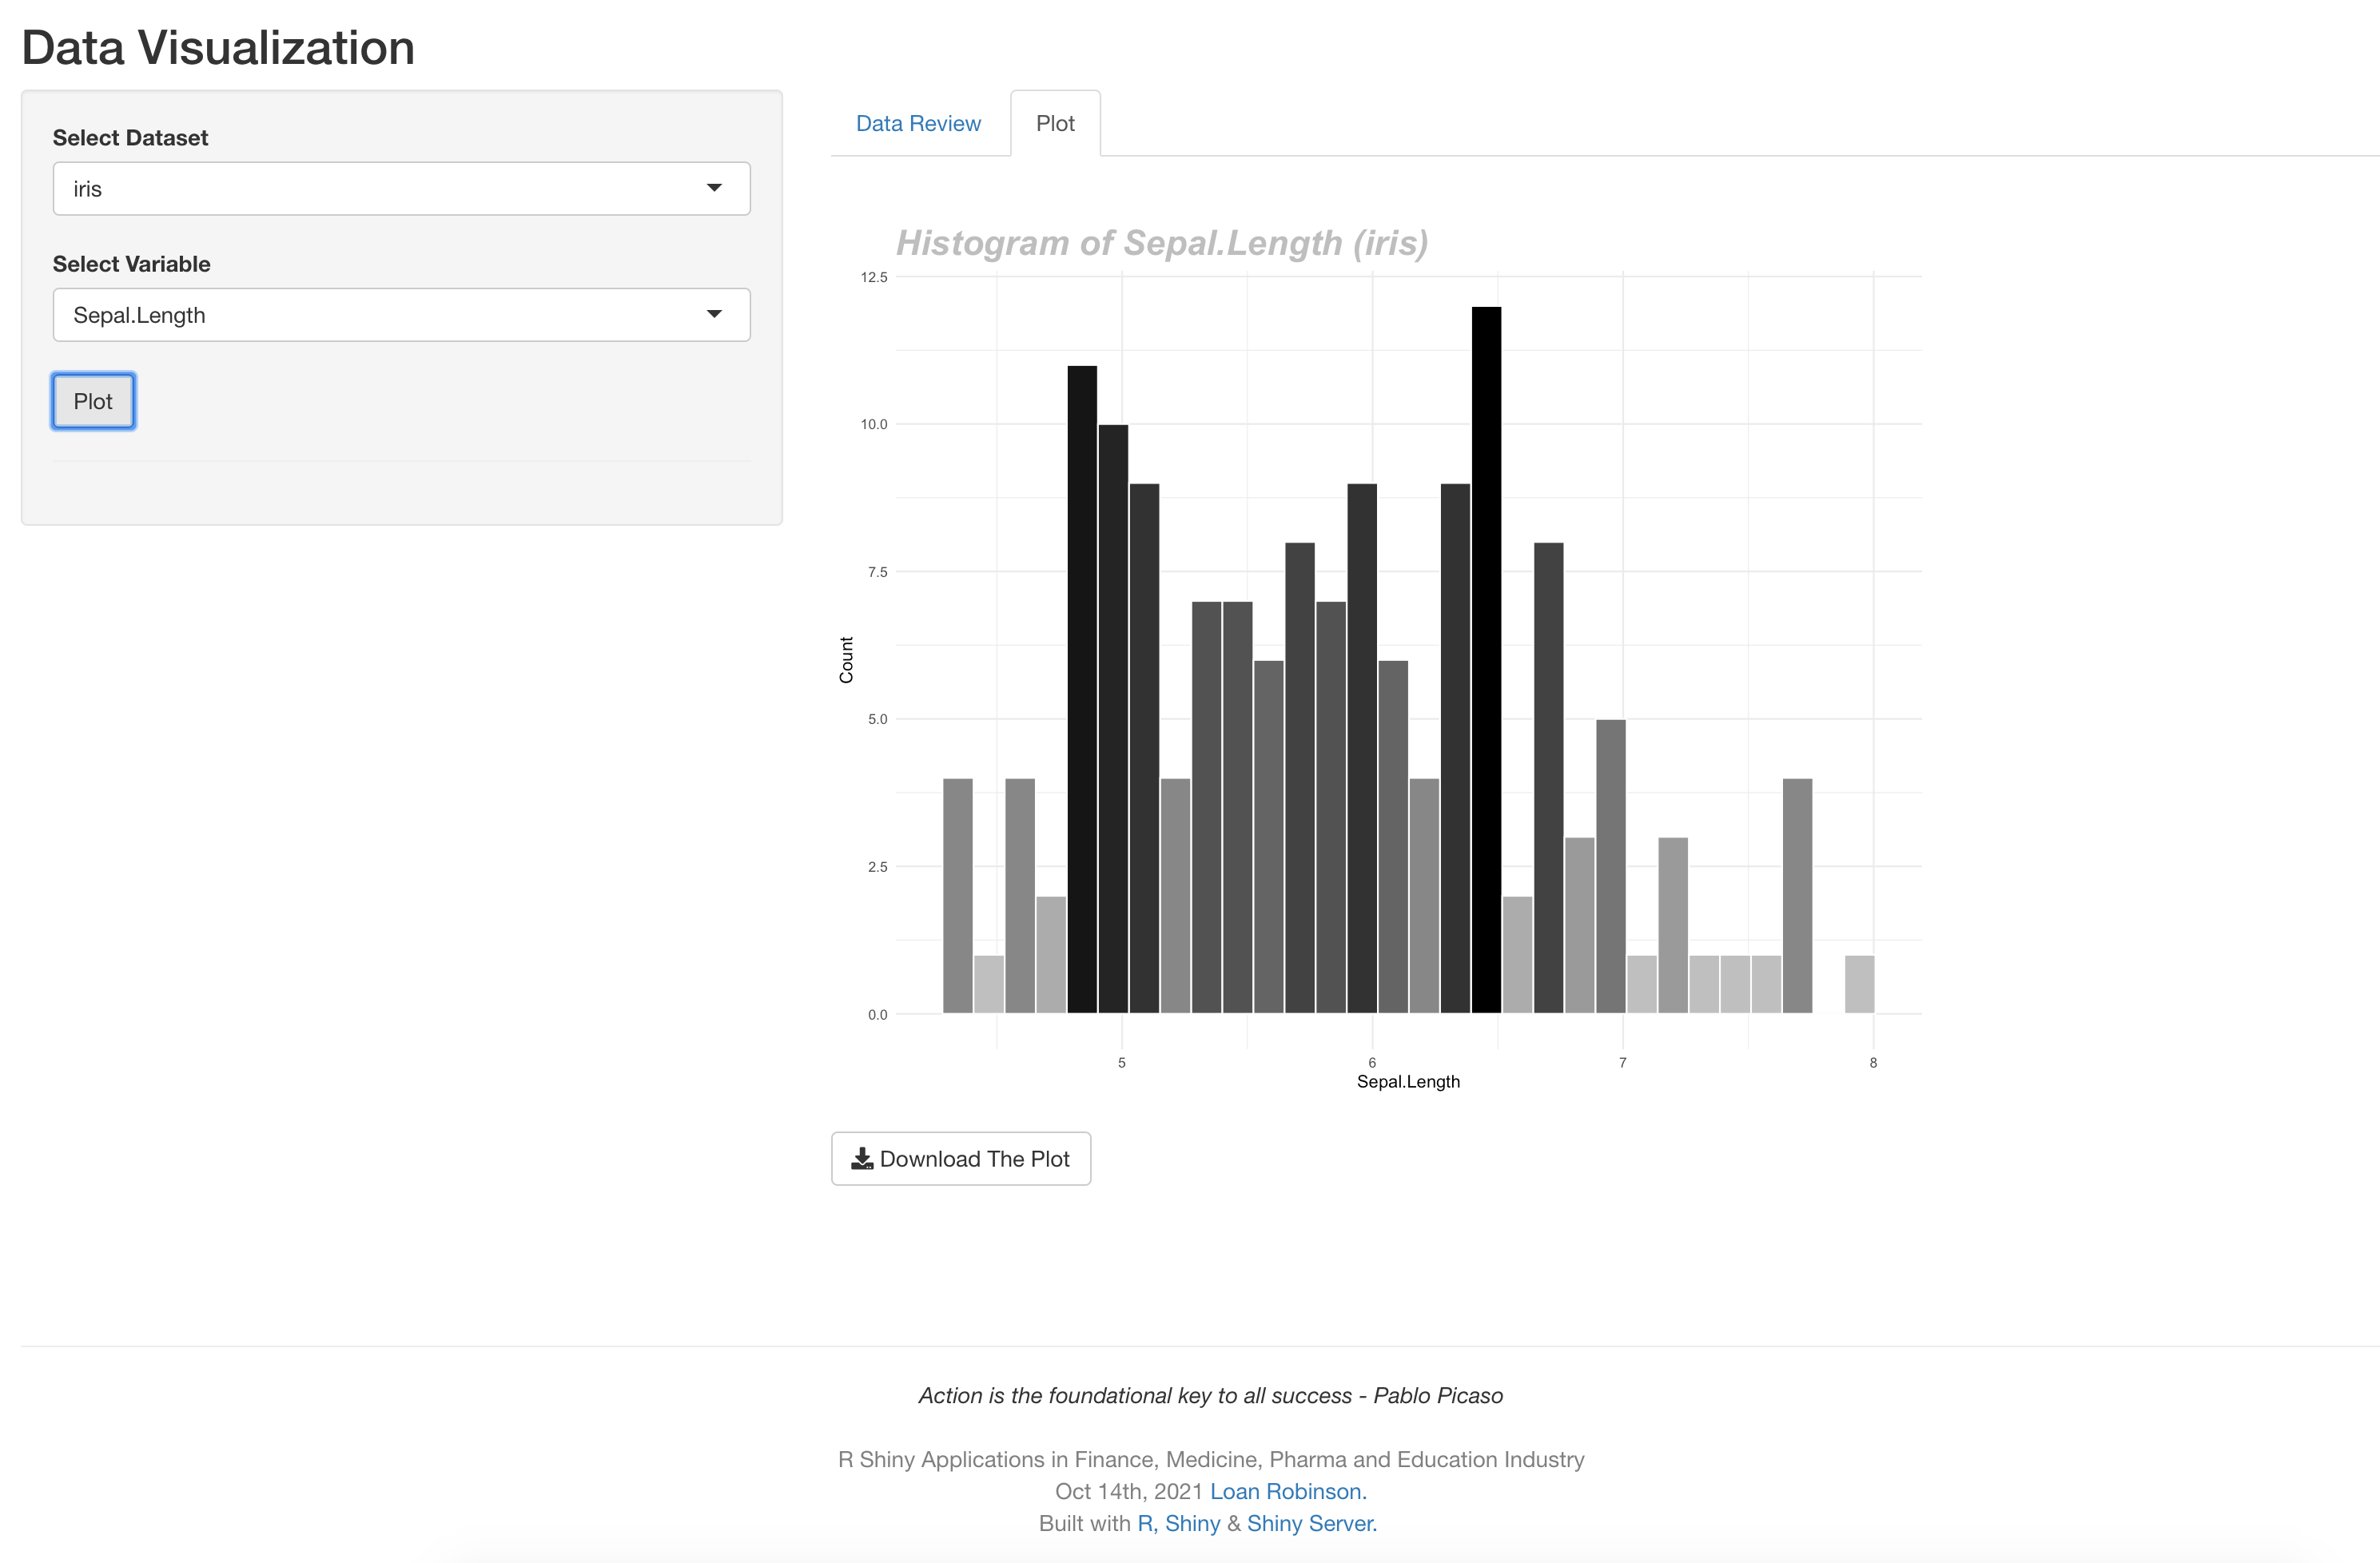
Figure 2.1: Basic Shiny Application - Interface UI