8.5 SMA Rule
We will show how to apply the following SMA Rule:
Buy every day when SMA30 SMA200
Sell everything when SMA30 SMA200
8.5.1 Step 1: Initialization
We first initialize the setup.
options("getSymbols.warning4.0"=FALSE)
from ="2012-01-01"
to ="2012-12-31"
symbols = c("IBM","MSFT")
getSymbols(symbols, from=from, to=to,
           adjust=TRUE)
Now we initilized setup:
currency("USD")
strategy.st <- portfolio.st <- account.st <- "SMA"
rm.strat(strategy.st)

initPortf(portfolio.st, symbols)
initAcct(account.st, portfolios=portfolio.st,
         initEq = initEq)
initOrders(portfolio.st)
strategy(strategy.st, store=TRUE)
8.5.2 Step 2: Indicator
Now we add two indicators: SMA30 and SMA200. Here, the argument is different from simple trading rule. For the SMA function, we need to tell the price vector and the number of period.
add.indicator(
  strategy.st, name="SMA",
  arguments=list(x=quote(Cl(mktdata)), n=30),
  label="sma30")

add.indicator(
  strategy.st, name="SMA",
  arguments=list(x=quote(Cl(mktdata)), n=200),
  label="sma200")
8.5.3 Step 3: Signals
Now we add two signals: Buy signal appears when SMA30 is greater than SMA200. Sell signals appears when SMA30 is less than SMA200. Hence, this is different from simple trading rule.
Here, we are going to do signal comparison so that we set name to sigComparison. We will compare two signals: sma30 and sma200. Then the relationship is greater than for buy and less than for less. We name the former to be a buy signal and the latter for a sell signal.
# Bull market if SMA30>SMA200
add.signal(
  strategy.st,
  name="sigComparison",
  arguments=list(columns=c("sma30","sma200"),
                 relationship="gt"),
  label="buy")

# Sell market if SMA30<SMA200
add.signal(
  strategy.st,
  name="sigComparison",
  arguments=list(columns=c("sma30","sma200"),
                 relationship="lt"),
  label="sell")
Note that here we use SigComparsion instead of SigCrossover. It is because SigComparsion will generate signals all the time but SigCrossover will generate signal only at cross.
8.5.4 Step 4: Rules
We will consider buy and sell rules using market order. Note that we sell everything when sell signal arise. Hence, the order quantity is all and the type is exit.
# Buy Rule
add.rule(strategy.st,
         name='ruleSignal',
         arguments = list(sigcol="buy",
                          sigval=TRUE,
                          orderqty=1000,
                          ordertype='market',
                          orderside='long',
                          pricemethod='market',
                          replace=FALSE),
         type='enter',
         path.dep=TRUE)

# Sell Rule
add.rule(strategy.st,
         name='ruleSignal',
         arguments = list(sigcol="sell",
                          sigval=TRUE,
                          orderqty='all',
                          ordertype='market',
                          orderside='long',
                          pricemethod='market',
                          replace=FALSE),
         type='exit',
         path.dep=TRUE)
8.5.5 Step 5: Evaluation
We first try to apply the trading rule.
out<-try(applyStrategy(strategy.st,
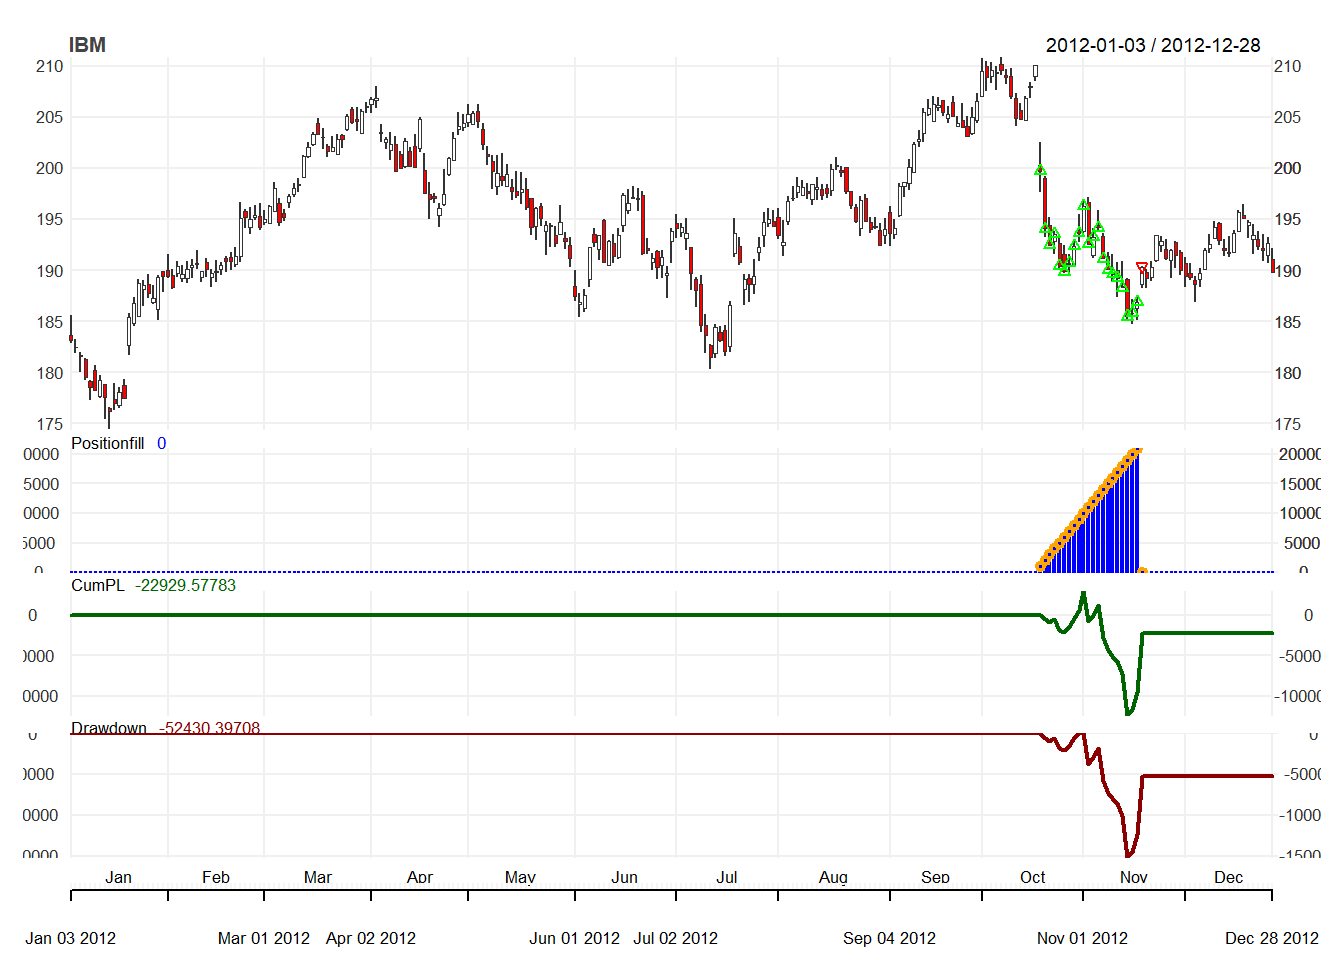
portfolios=portfolio.st))## [1] "2012-10-17 08:00:00 IBM 1000 @ 199.755777809092"
## [1] "2012-10-18 08:00:00 IBM 1000 @ 194.1104863151"
## [1] "2012-10-19 08:00:00 IBM 1000 @ 192.517452197251"
## [1] "2012-10-22 08:00:00 IBM 1000 @ 193.552913521349"
## [1] "2012-10-23 08:00:00 IBM 1000 @ 190.416645336717"
## [1] "2012-10-24 08:00:00 IBM 1000 @ 189.888955759662"
## [1] "2012-10-25 08:00:00 IBM 1000 @ 190.765126217072"
## [1] "2012-10-26 08:00:00 IBM 1000 @ 192.42784735108"
## [1] "2012-10-31 08:00:00 IBM 1000 @ 193.682352036262"
## [1] "2012-11-01 08:00:00 IBM 1000 @ 196.290930643838"
## [1] "2012-11-02 08:00:00 IBM 1000 @ 192.58713921341"
## [1] "2012-11-05 08:00:00 IBM 1000 @ 193.294051426163"
## [1] "2012-11-06 08:00:00 IBM 1000 @ 194.220007"
## [1] "2012-11-07 08:00:00 IBM 1000 @ 191.160004"
## [1] "2012-11-08 08:00:00 IBM 1000 @ 190.100006"
## [1] "2012-11-09 08:00:00 IBM 1000 @ 189.639999"
## [1] "2012-11-12 08:00:00 IBM 1000 @ 189.25"
## [1] "2012-11-13 08:00:00 IBM 1000 @ 188.320007"
## [1] "2012-11-14 08:00:00 IBM 1000 @ 185.509995"
## [1] "2012-11-15 08:00:00 IBM 1000 @ 185.850006"
## [1] "2012-11-16 08:00:00 IBM 1000 @ 186.940002"
## [1] "2012-11-19 08:00:00 IBM -21000 @ 190.350006"
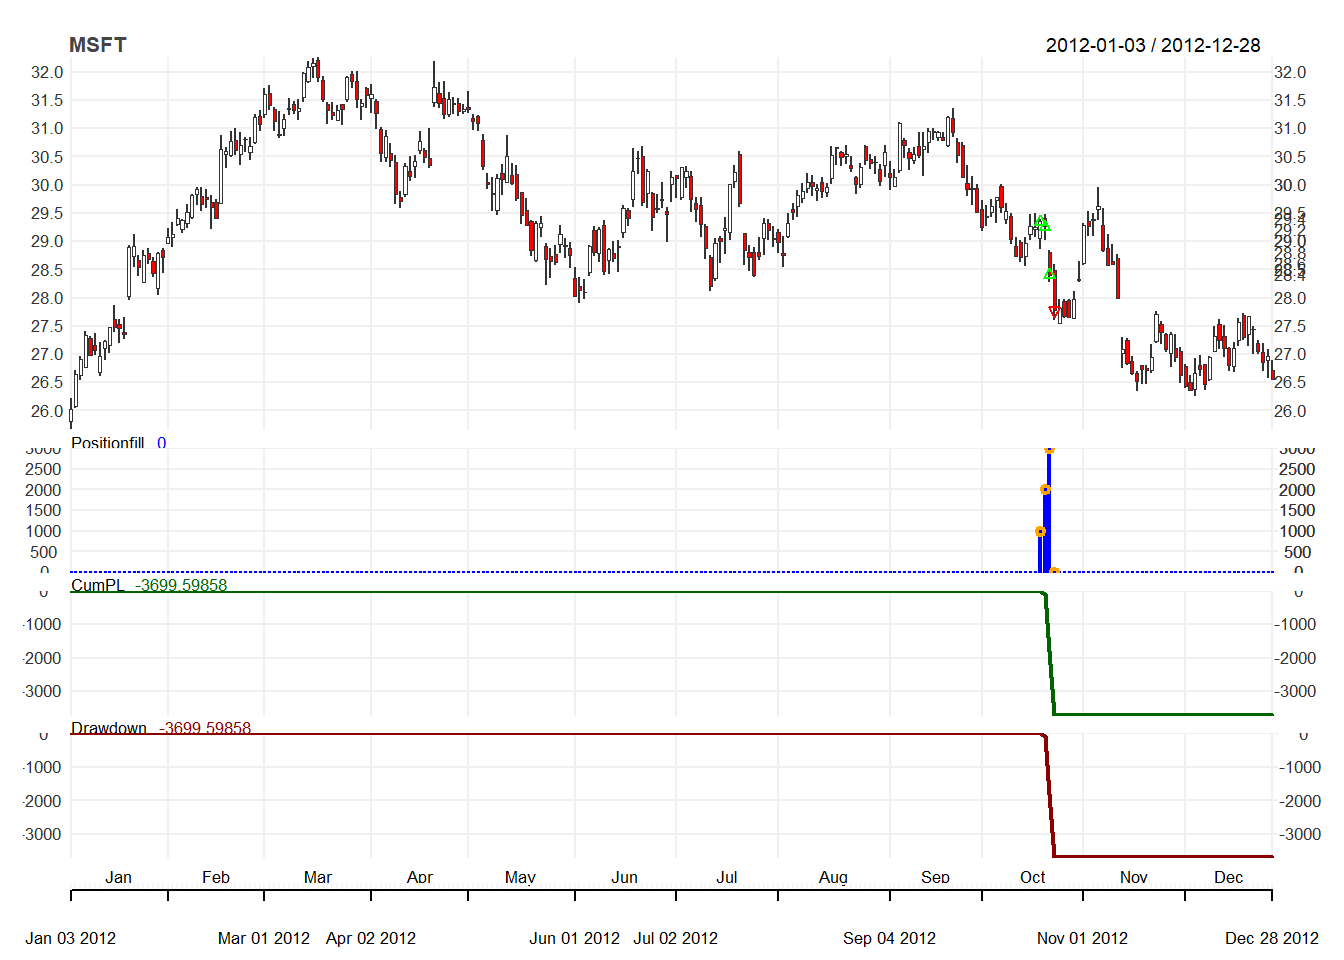
## [1] "2012-10-17 08:00:00 MSFT 1000 @ 29.3488341516242"
## [1] "2012-10-18 08:00:00 MSFT 1000 @ 29.2595676739748"
## [1] "2012-10-19 08:00:00 MSFT 1000 @ 28.4065758956973"
## [1] "2012-10-22 08:00:00 MSFT -3000 @ 27.7717930464845"Then we can update the accounts.
updatePortf(portfolio.st)
updateAcct(portfolio.st)
updateEndEq(account.st)
We can also plot the trading positions.
for(symbol in symbols) {
  chart.Posn(Portfolio=portfolio.st,
             Symbol=symbol,log=TRUE)
}