7.2 Charting
Quantmod draw nice charts of following common types:
- line
- bars
- candlesticks
We can use chartSeries() and specify the types directly.
The line chart displays stock price of AAPL in 2007 by using the subset option. The option theme is set to be chartTheme(‘white’) as the default option chartTheme(‘black’) is not printer-friendly.
chartSeries(AAPL,
            type="line",
            subset='2007',
            theme=chartTheme('white'))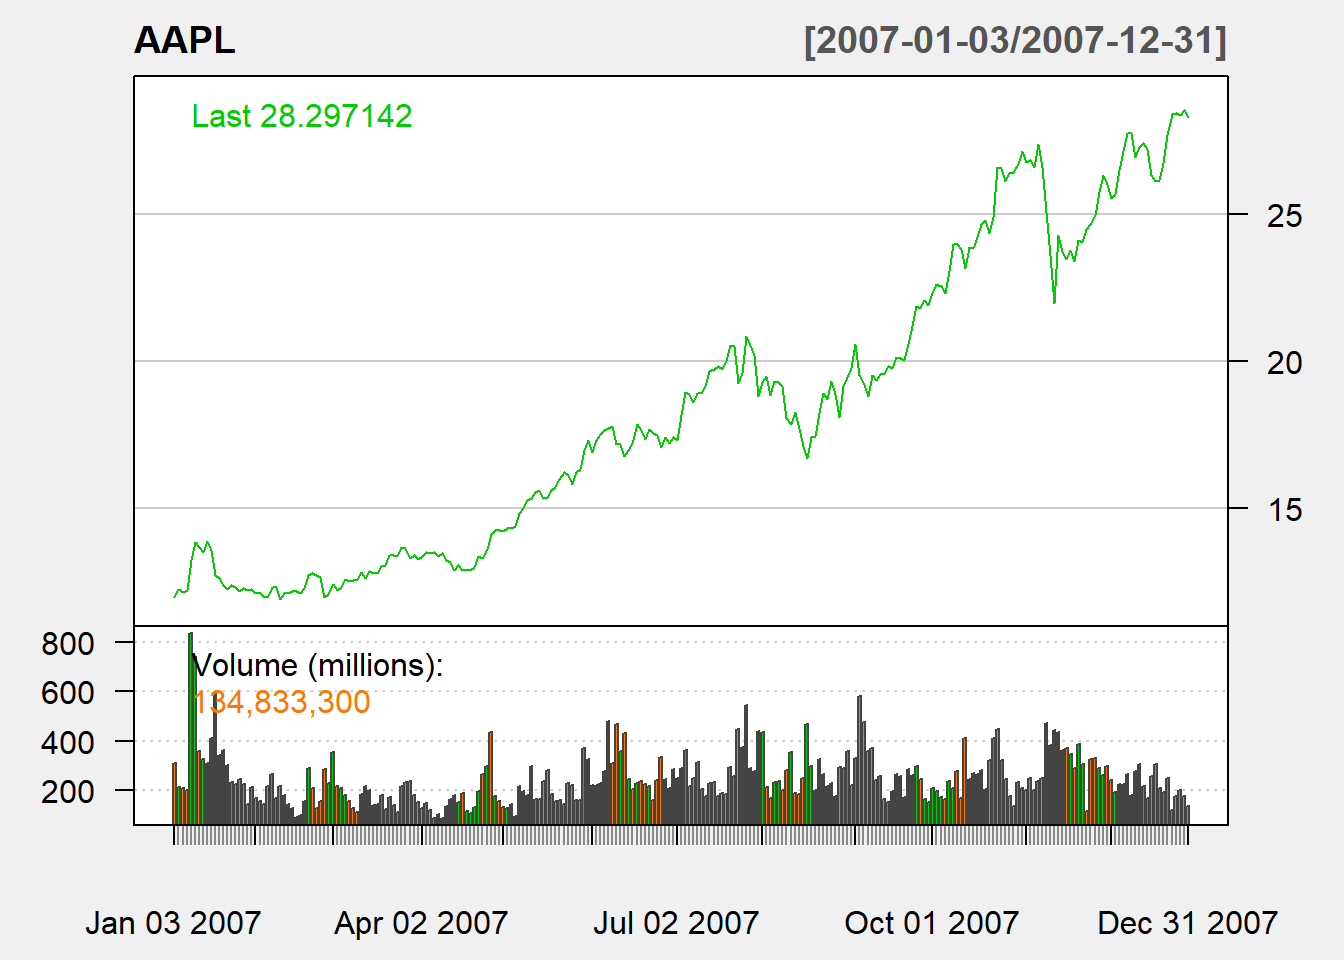
The bar chart displays stock price of AAPL in May to June 2007 by using the subset option.
chartSeries(AAPL,
            type="bar",
            subset='2007-05::2007-06',
            theme=chartTheme('white'))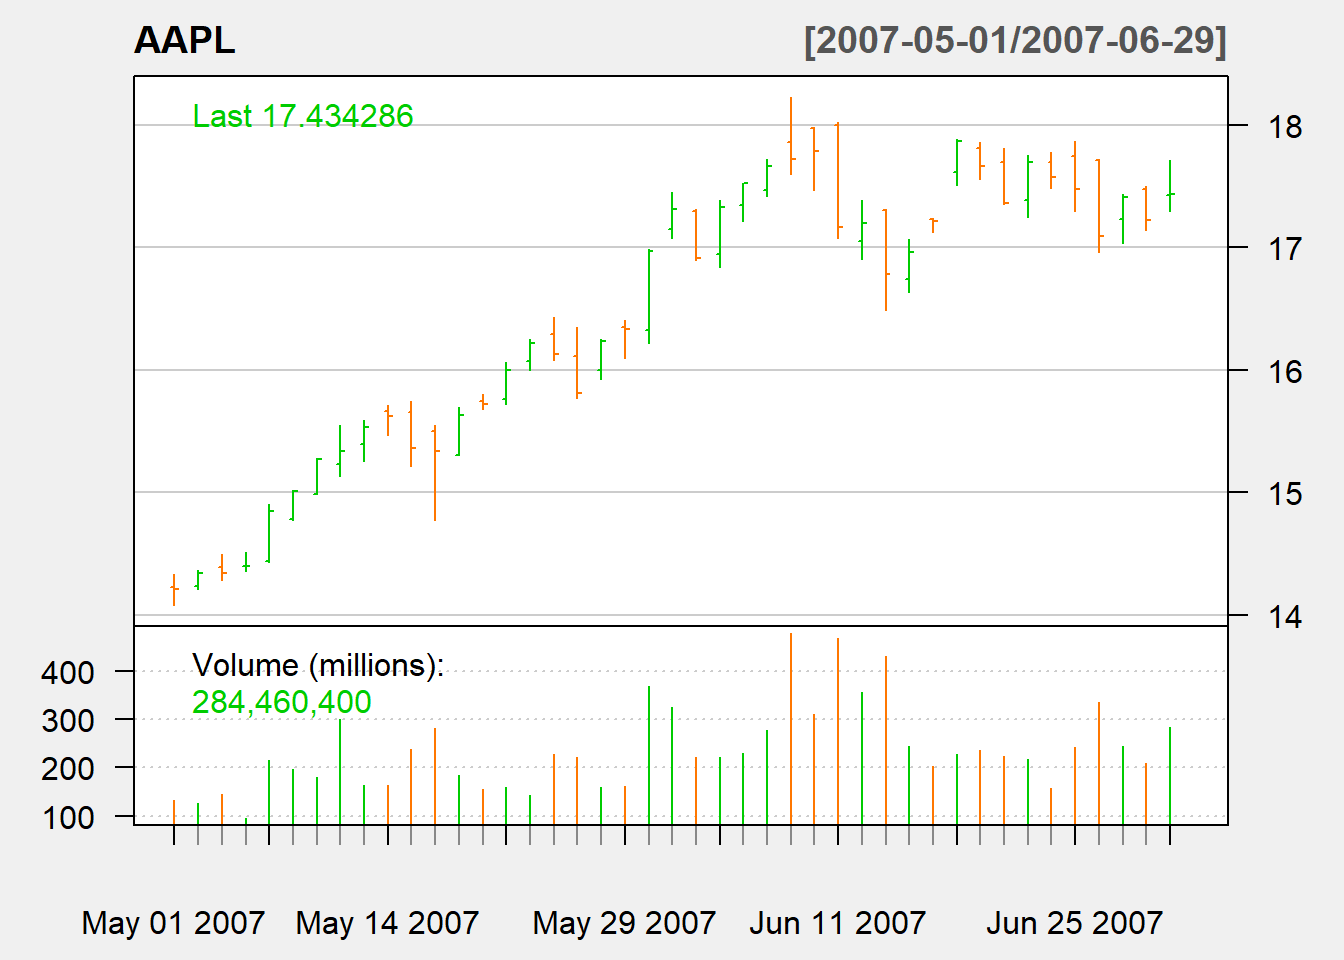
The following candle stick chart displays stock price of AAPL in May only.
chartSeries(AAPL,
            type="candlesticks",
            subset='2007-05',
            theme=chartTheme('white'))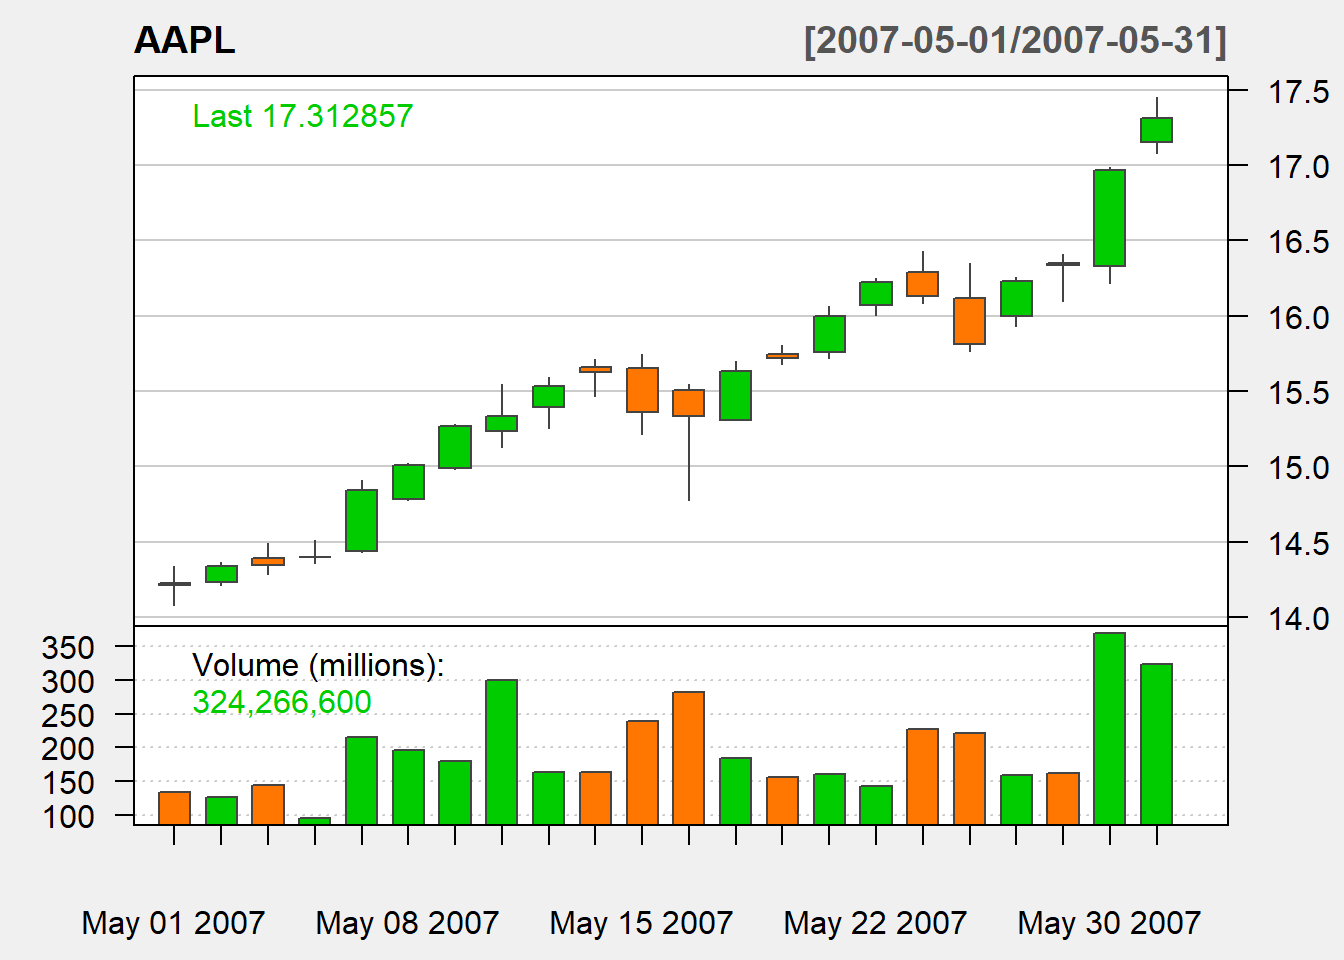
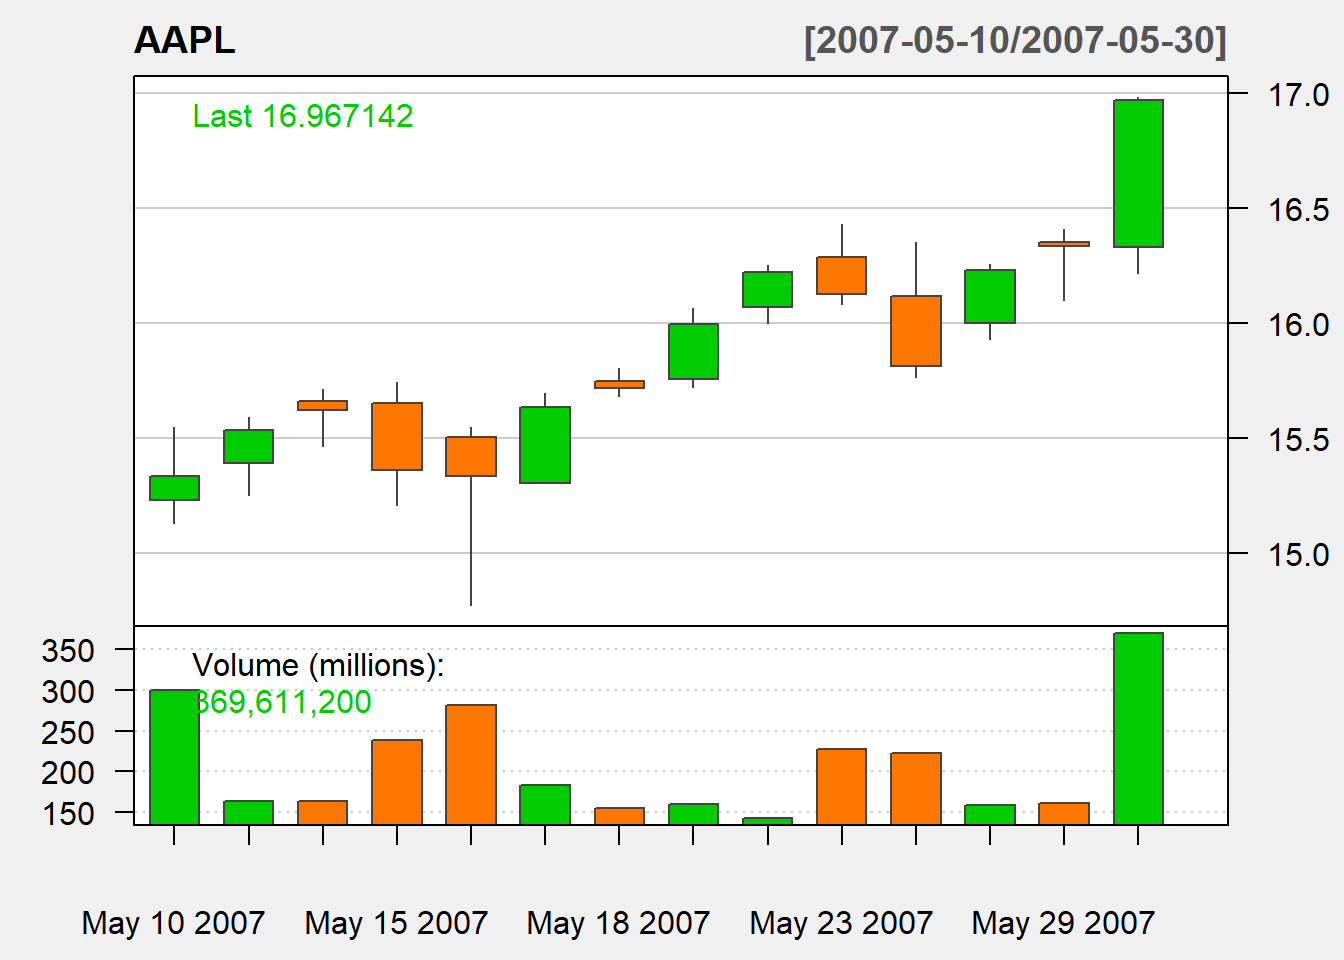
Finally The following candle stick chart displays stock price of AAPL a few days in May.
chartSeries(AAPL,
            type="auto",
            subset='2007-05-10::2007-05-30',
            theme=chartTheme('white'))