7.5 Charting Price changes of two stocks
To compare prices fo different stocks, we need to calculat the price change:
NS <- function(xdat) xdat / coredata(xdat)[1]
a <- NS(Cl(AAPL))-1
g <- NS(Cl(GOOG))-1
m <- NS(Cl(MSFT))-1
chartSeries(a,
            subset = '2007',
            theme=chartTheme('white'))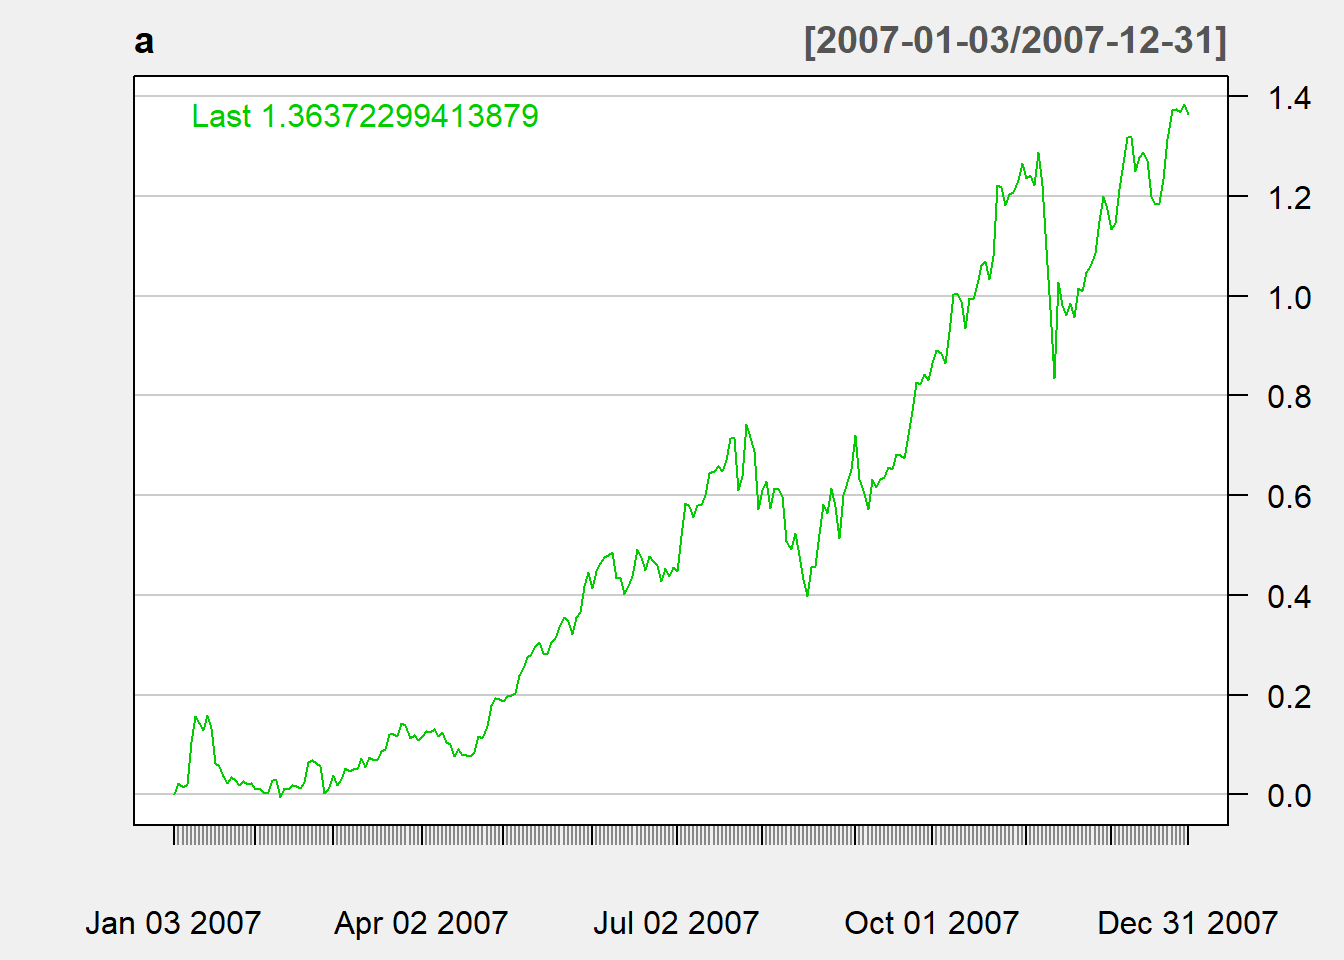
addTA(g, on=1, col="red", lty="dotted")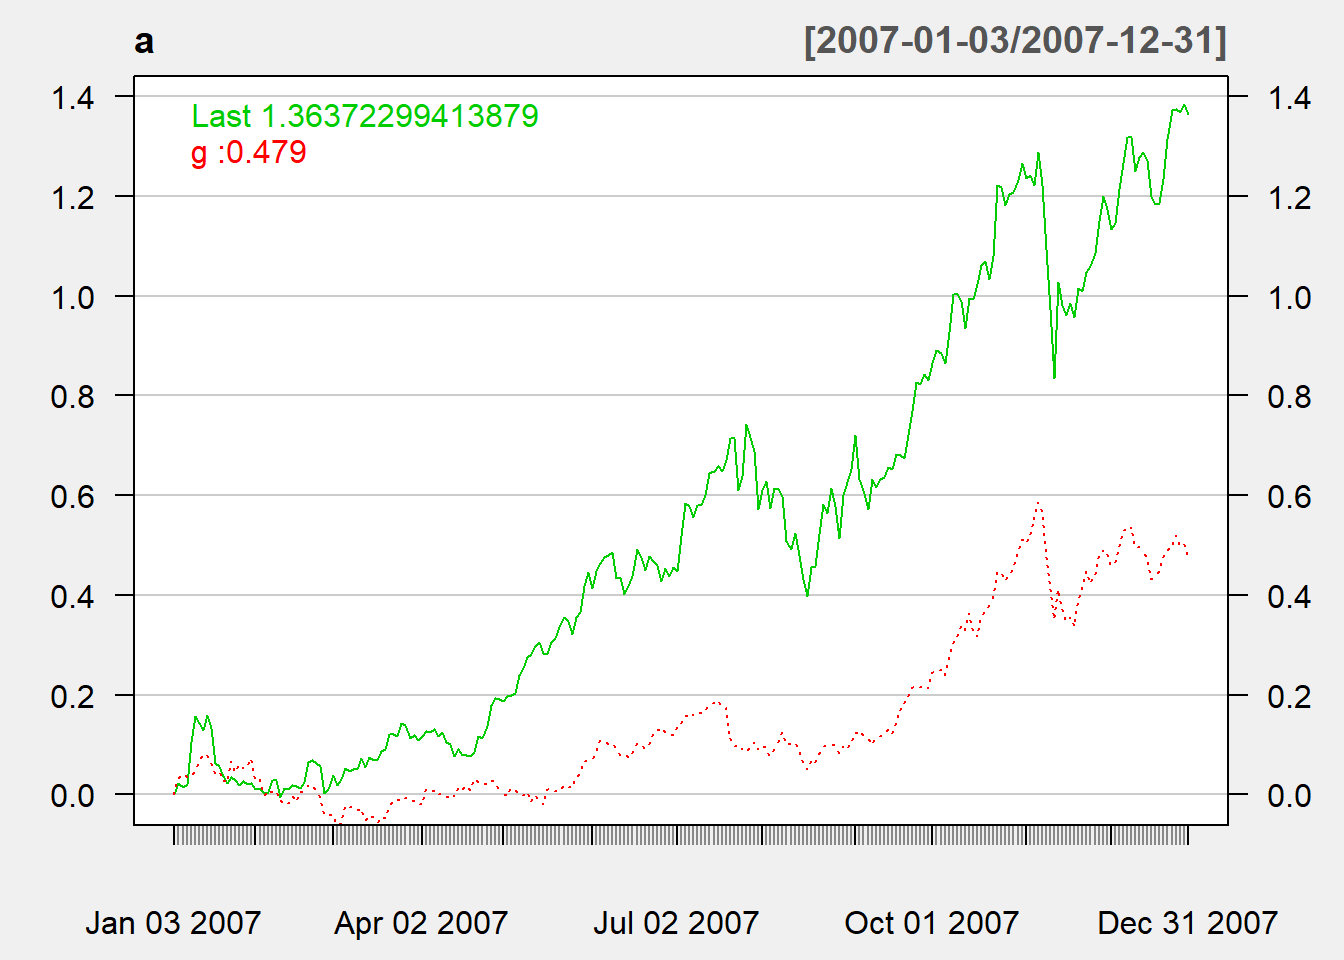
addTA(m, on=1, col="blue", lty="dashed")
The option lty is to make the line becomes other line styles where dotted means dotted line and dashed means dashed line.