1 Introductory Activity
Example 1.1 Suppose you’re interested in estimating the proportion of his lifetime that Professor Ross has lived in California. We’ll call this unknown proportion \(\theta\) (the Greek letter “theta”).
- If you had to guess a single value for \(\theta\), what would your guess be? Why?
Rather than guessing just a single value, we’ll assign relative “plausibilities” to a range of values. To illustrate ideas, we’ll start by considering only the values 0.2, 0.4, 0.6, 0.8 as possible for \(\theta\). (Of course this is unrealistic; we’ll consider a more realistic situation soon.) That is, we want to assess our relative plausibility of the statements:
- Professor Ross has lived in CA for 20% of his lifetime
- Professor Ross has lived in CA for 40% of his lifetime
- Professor Ross has lived in CA for 60% of his lifetime
- Professor Ross has lived in CA for 80% of his lifetime
Which of these values — 0.2, 0.4, 0.6, 0.8 — do you think is the least plausible for \(\theta\)? (In other words, which of the four statements in the bullets above do you think is least plausible?)
Which value — 0.2, 0.4, 0.6, 0.8 — do you think is the next least plausible? Roughly, how many times more plausible do you think it is than the one from the previous part?
For example, suppose you think that 0.2 is your least plausible and 0.4 is your next least plausible value of \(\theta\). If you think that 0.4 is 3 times more plausible than 0.2, then, roughly, you would be willing to engage in a bet that \(\theta\) is 0.2 versus 0.4 at 3-to-1 odds.
Continue in the manner of the previous part to assign a relative plausibility to each of the values 0.2, 0.4, 0.6, 0.8. Suppose that your least plausible value represents 1 “unit of plausibility”. How many “units of plausibility” does each of the other values represent? (Assume that each of the four values has some plausibility, no matter how small; don’t assign 0 plausibility to any of the values.)
If 0.2, 0.4, 0.6, 0.8 are the only possible values of \(\theta\), then they should account for 100% of your total plausibility. Using your relative plausibilities from the previous part, what percent of your total plausibility does each of the values 0.2, 0.4, 0.6, 0.8 represent? Make a table and a plot of your assessment. Then compare and discuss with someone else in the class.
Example 1.2 The previous example was unrealistic because we only considered the values 0.2, 0.4, 0.6, and 0.8 as plausible. We’ll now consider a broader range of values. Since \(\theta\) is a proportion, we know it must be between 0 and 1, but some values between 0 and 1 might be more plausible to you than others. You’ll now sketch a curve over the interval [0, 1] to represent your assessment of relative plausibility. The following questions will help you determine what your sketch should look like.
- Is it more plausible to you that \(\theta\) is greater than 0.6 or less than 0.6? (In other words, it is more plausible to you that Professor Ross has lived in CA for more than 60% of his lifetime, or for less than 60% of his lifetime?) How much more plausible?
- Repeat the previous part for a few values other than 0.6.
- Fill in the blank: it is equally plausible that \(\theta\) is greater than or less than [blank].
- Fill in the blank: it is 2 times more plausible that \(\theta\) is greater than [blank] than less than [blank].
- Repeat the previous part for a few other ratios (e.g, 3 times).
- What range of values accounts for most, say 98%, of your plausibility?
- After your have considered the above questions, sketch a curve that reflects your assesment of plausibility. The plot doesn’t have to perfect, but try to reflect your answers to the previous questions as best as you can. (If you get stuck on drawing a sketch, it might help to try Example 1.3 first.)
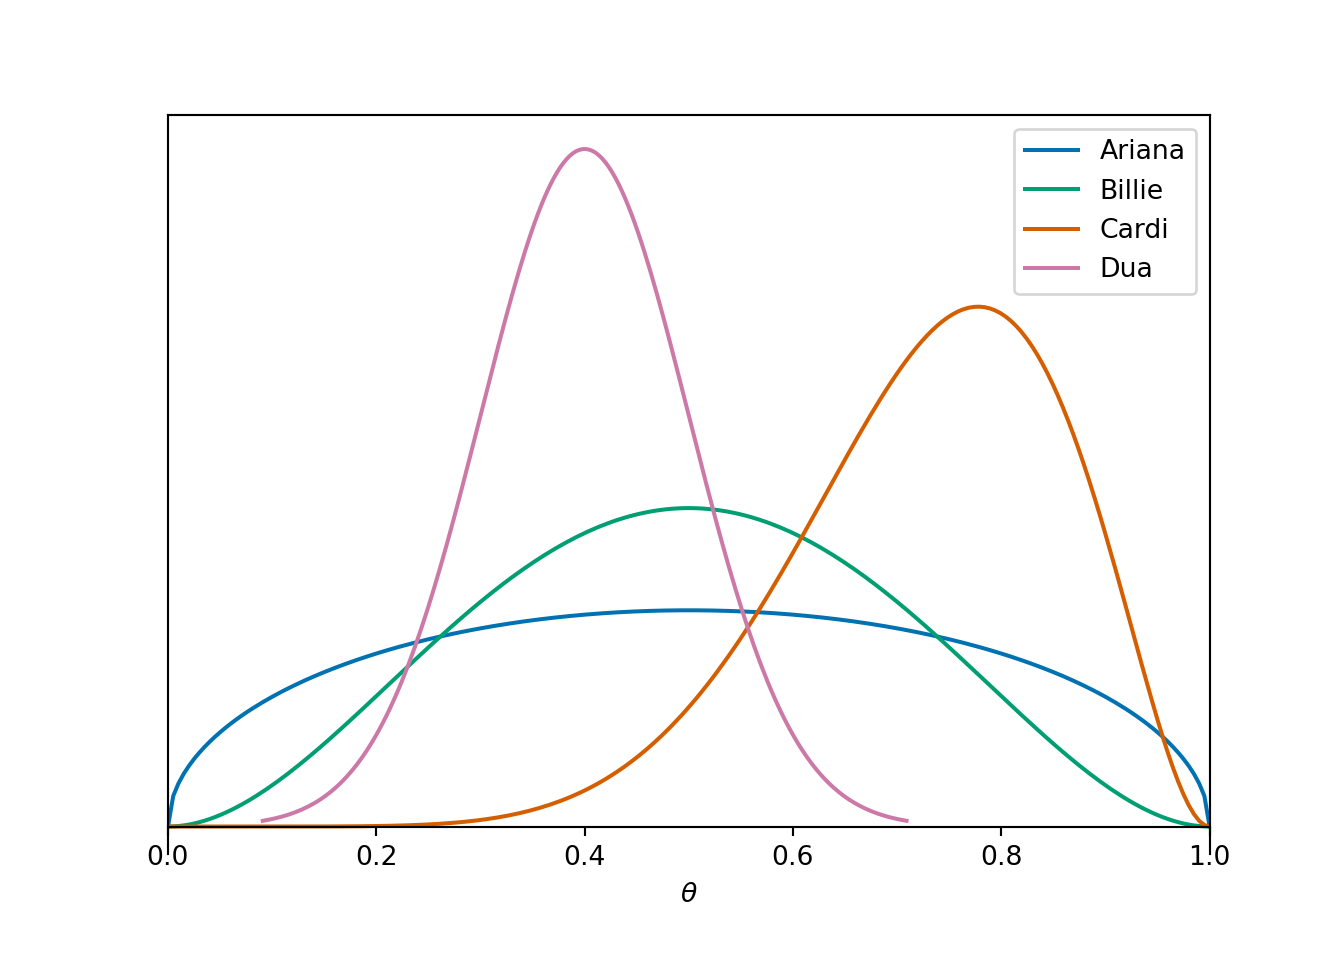
Example 1.3 The plot below displays the plausibility sketches of four students.
- Rank the students in terms of their plausibility that \(\theta\) is less than 0.6. For which student is it most plausible that Professor Ross has lived in CA for less than 60% of his lifetime? Least plausible?
- Rank the students in terms of their answers to the question: it is equally plausible that \(\theta\) is greater than or less than [blank].
- Rank the students in terms of their uncertainty about \(\theta\). Who is the most uncertain? The least?
Example 1.4 Professor Ross will now reveal some information. After the information is revealed, reconsider your answers the questions in Example 1.2 (copied below) and revise your sketch.
- Is it more plausible to you that \(\theta\) is greater than 0.6 or less than 0.6? (In other words, it is more plausible to you that Professor Ross has lived in CA for more than 60% of his lifetime, or for less than 60% of his lifetime?) How much more plausible?
- Repeat the previous part for a few values other than 0.6.
- Fill in the blank: it is equally plausible that \(\theta\) is greater than or less than [blank].
- Fill in the blank: it is 2 times more plausible that \(\theta\) is greater than [blank] than less than [blank].
- Repeat the previous part for a few other ratios (e.g, 3 times).
- What range of values accounts for most, say 98%, of your plausibility?
- After your have considered the above questions, sketch a curve that reflects your assesment of plausibility. The plot doesn’t have to perfect, but try to reflect your answers to the previous questions as best as you can.