Capítulo 7 Distribuicoes Multivariadas
S = rolldie(2, makespace = TRUE)
S = addrv(S, FUN = max, invars = c("X1", "X2"), name = "U")
S = addrv(S, FUN = sum, invars = c("X1", "X2"), name = "V")
head(S)
## X1 X2 U V probs
## 1 1 1 1 2 0.02777778
## 2 2 1 2 3 0.02777778
## 3 3 1 3 4 0.02777778
## 4 4 1 4 5 0.02777778
## 5 5 1 5 6 0.02777778
## 6 6 1 6 7 0.02777778UV <- marginal(S, vars = c("U", "V"))
head(UV)## U V probs
## 1 1 2 0.02777778
## 2 2 3 0.05555556
## 3 2 4 0.02777778
## 4 3 4 0.05555556
## 5 3 5 0.05555556
## 6 4 5 0.05555556xtabs(round(probs, 3) ~ U + V, data = UV)## V
## U 2 3 4 5 6 7 8 9 10 11 12
## 1 0.028 0.000 0.000 0.000 0.000 0.000 0.000 0.000 0.000 0.000 0.000
## 2 0.000 0.056 0.028 0.000 0.000 0.000 0.000 0.000 0.000 0.000 0.000
## 3 0.000 0.000 0.056 0.056 0.028 0.000 0.000 0.000 0.000 0.000 0.000
## 4 0.000 0.000 0.000 0.056 0.056 0.056 0.028 0.000 0.000 0.000 0.000
## 5 0.000 0.000 0.000 0.000 0.056 0.056 0.056 0.056 0.028 0.000 0.000
## 6 0.000 0.000 0.000 0.000 0.000 0.056 0.056 0.056 0.056 0.056 0.028marginal(UV, vars = "U")## U probs
## 1 1 0.02777778
## 2 2 0.08333333
## 3 3 0.13888889
## 4 4 0.19444444
## 5 5 0.25000000
## 6 6 0.30555556marginal(UV, vars = "V")## V probs
## 1 2 0.02777778
## 2 3 0.05555556
## 3 4 0.08333333
## 4 5 0.11111111
## 5 6 0.13888889
## 6 7 0.16666667
## 7 8 0.13888889
## 8 9 0.11111111
## 9 10 0.08333333
## 10 11 0.05555556
## 11 12 0.02777778temp <- xtabs(probs ~ U + V, data = UV)
rowSums(temp)## 1 2 3 4 5 6
## 0.02777778 0.08333333 0.13888889 0.19444444 0.25000000 0.30555556colSums(temp)## 2 3 4 5 6 7 8
## 0.02777778 0.05555556 0.08333333 0.11111111 0.13888889 0.16666667 0.13888889
## 9 10 11 12
## 0.11111111 0.08333333 0.05555556 0.02777778** Esperança Conjunta e Marginal **
Eu <- sum(S$U * S$probs)
Ev <- sum(S$V * S$probs)
Euv <- sum(S$U * S$V * S$probs)Eu## [1] 4.472222Ev## [1] 7Euv## [1] 34.22222** Covariância e Correlação **
Euv - Eu * Ev## [1] 2.9166677.1 Distribuição condicional
x = c(rep(0,500),rep(1,500))
y = c(rnorm(500),rnorm(500,3))plot(density(y))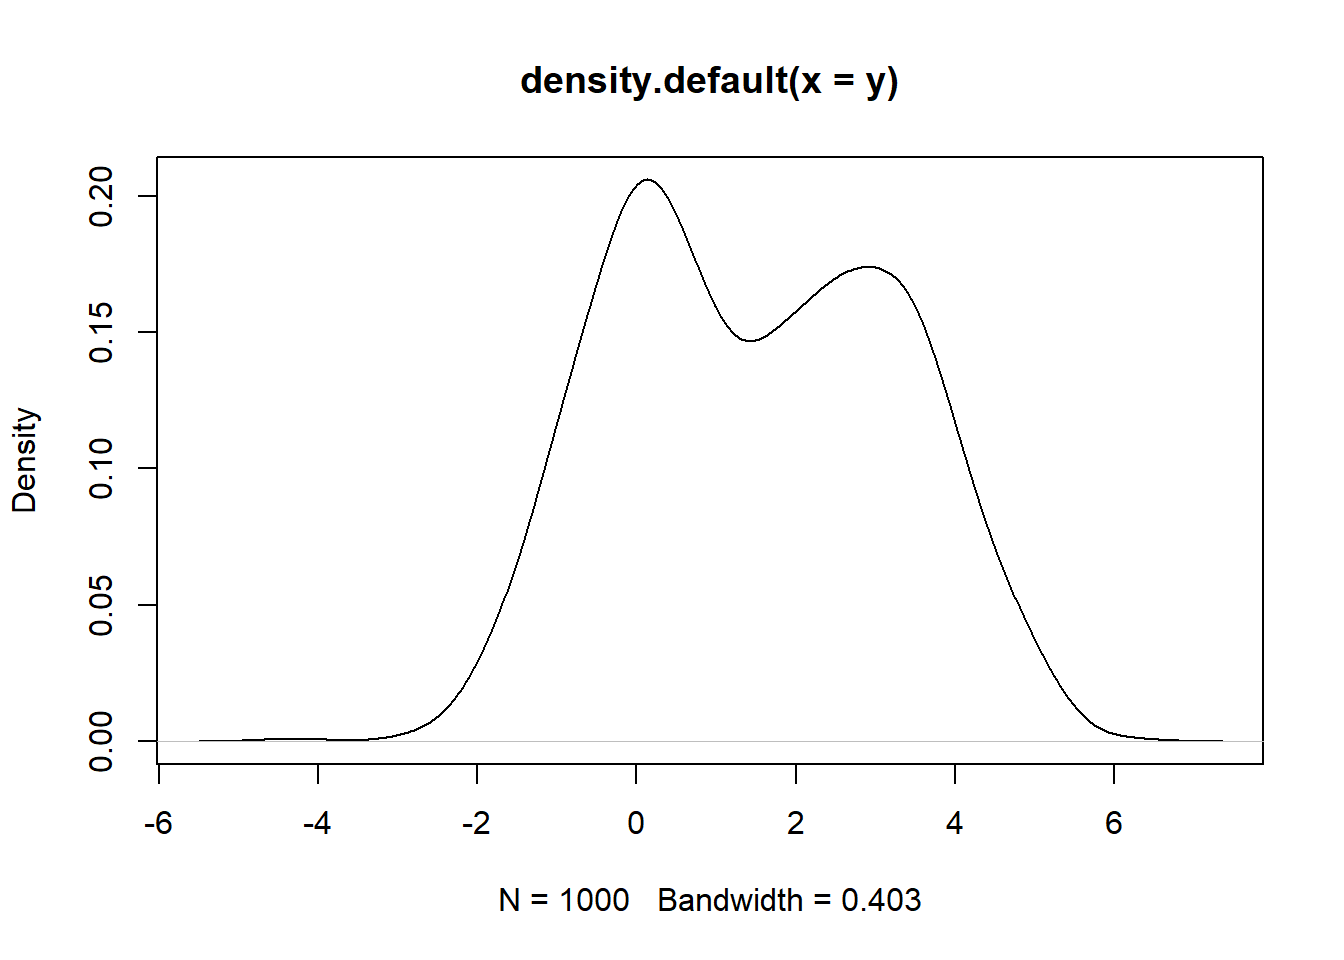
plot(density(y[x==0]), ylim = c(0,0.5), xlim = c(-3,8))
lines(density(y[x==1]),col = "red")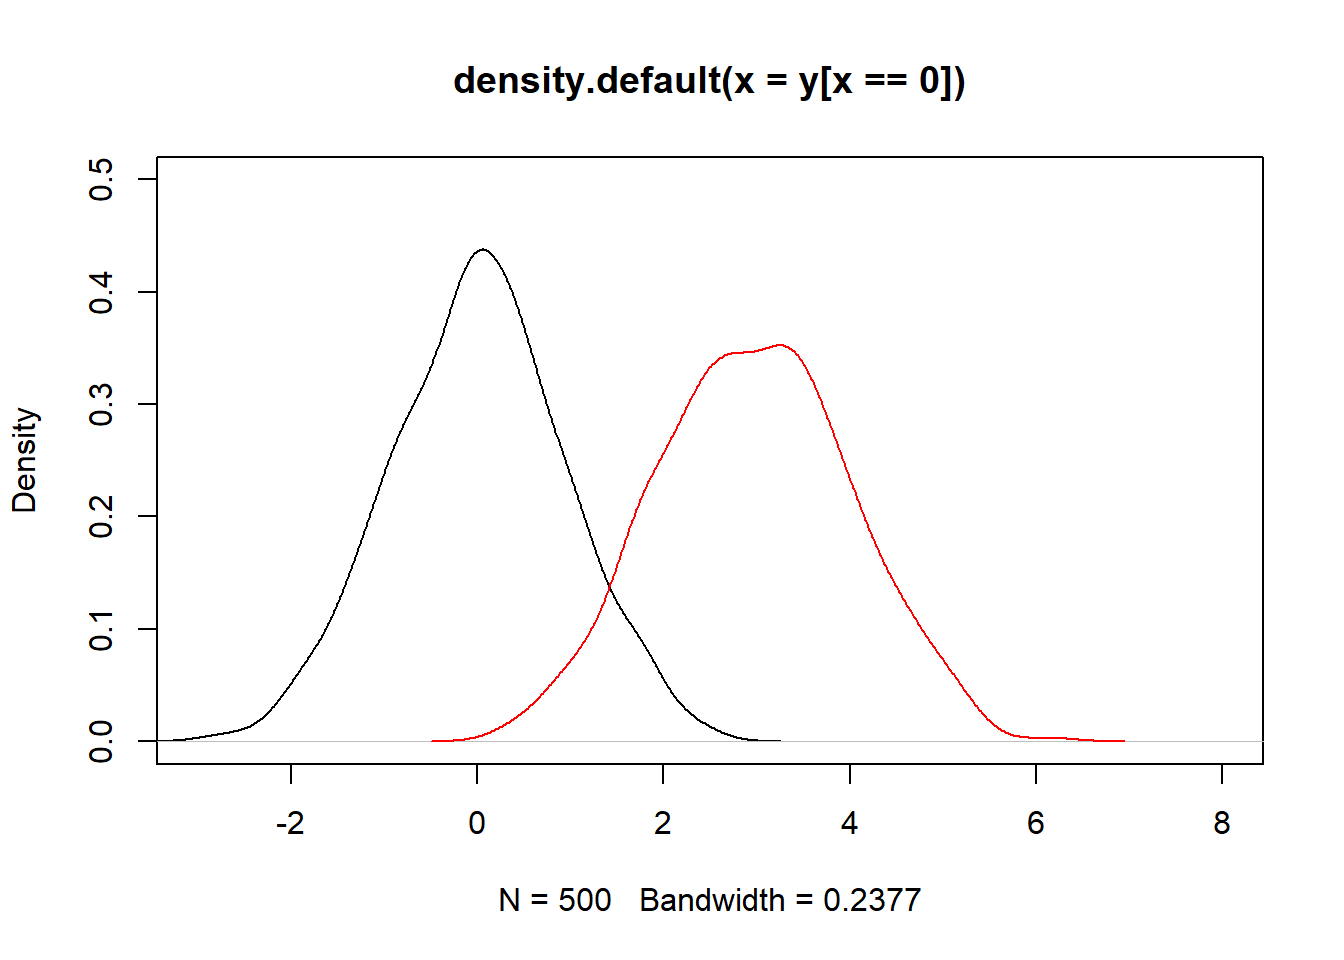
mean(y)## [1] 1.484076mean(y[x==0])## [1] 0.001430795mean(y[x==1])## [1] 2.966721var(y)## [1] 3.178244var(y[x==0])## [1] 0.8957608var(y[x==1])## [1] 1.061813x = c(rep(0,500),rep(1,500))
y = c(rnorm(500,1,2),rnorm(500,1,5))plot(density(y[x==0]), ylim = c(0,0.3), xlim = c(-10,10))
lines(density(y[x==1]),col = "red")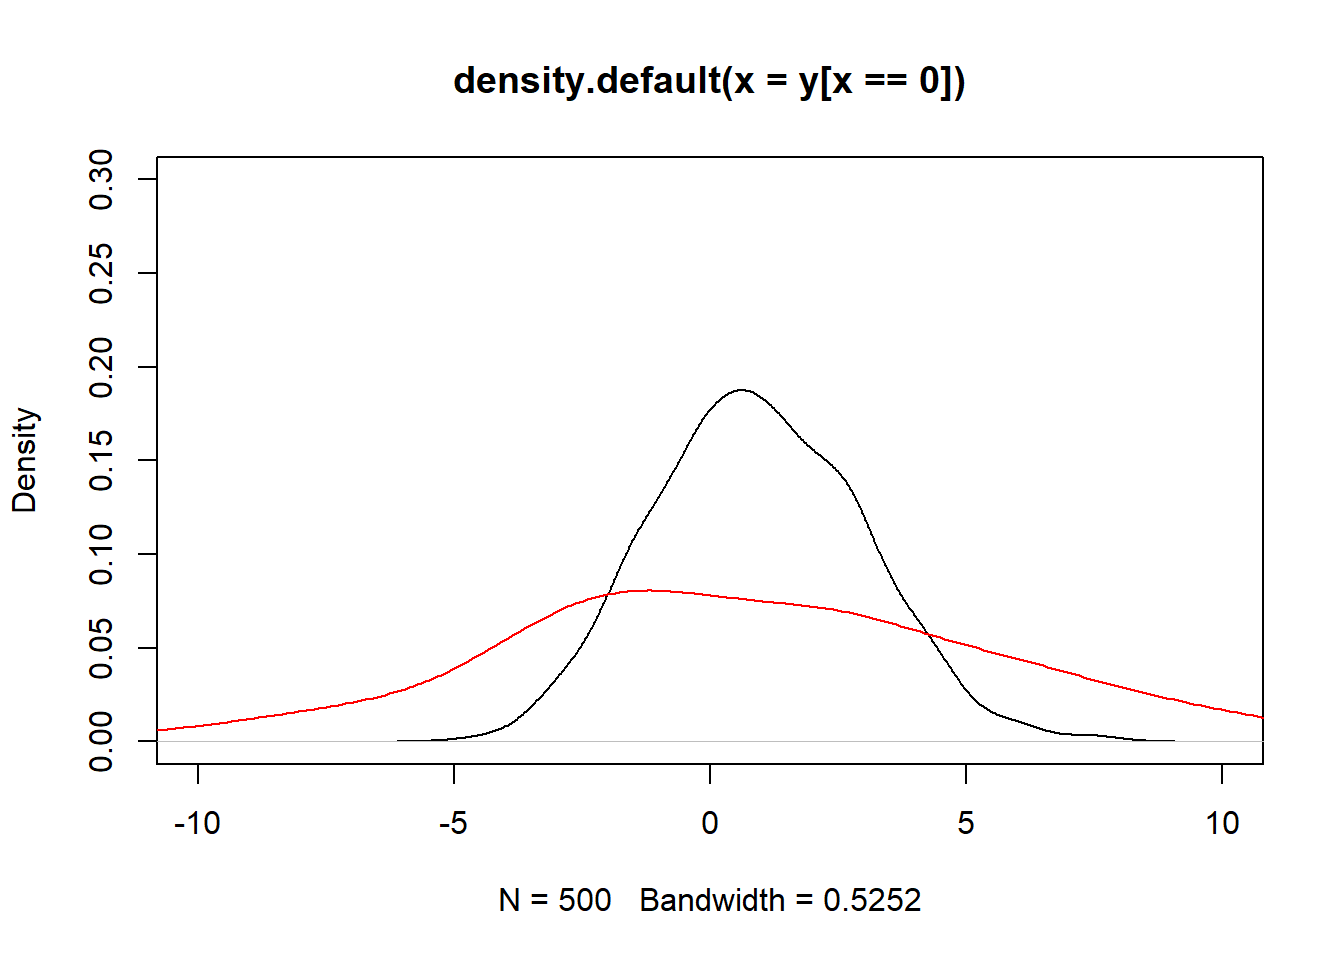
mean(y)## [1] 0.888861mean(y[x==0])## [1] 0.9368569mean(y[x==1])## [1] 0.840865var(y)## [1] 14.24852var(y[x==0])## [1] 4.089858var(y[x==1])## [1] 24.43111x = rnorm(1000)
y = rnorm(1000)cor(x,y)## [1] -0.03529856plot(x,y)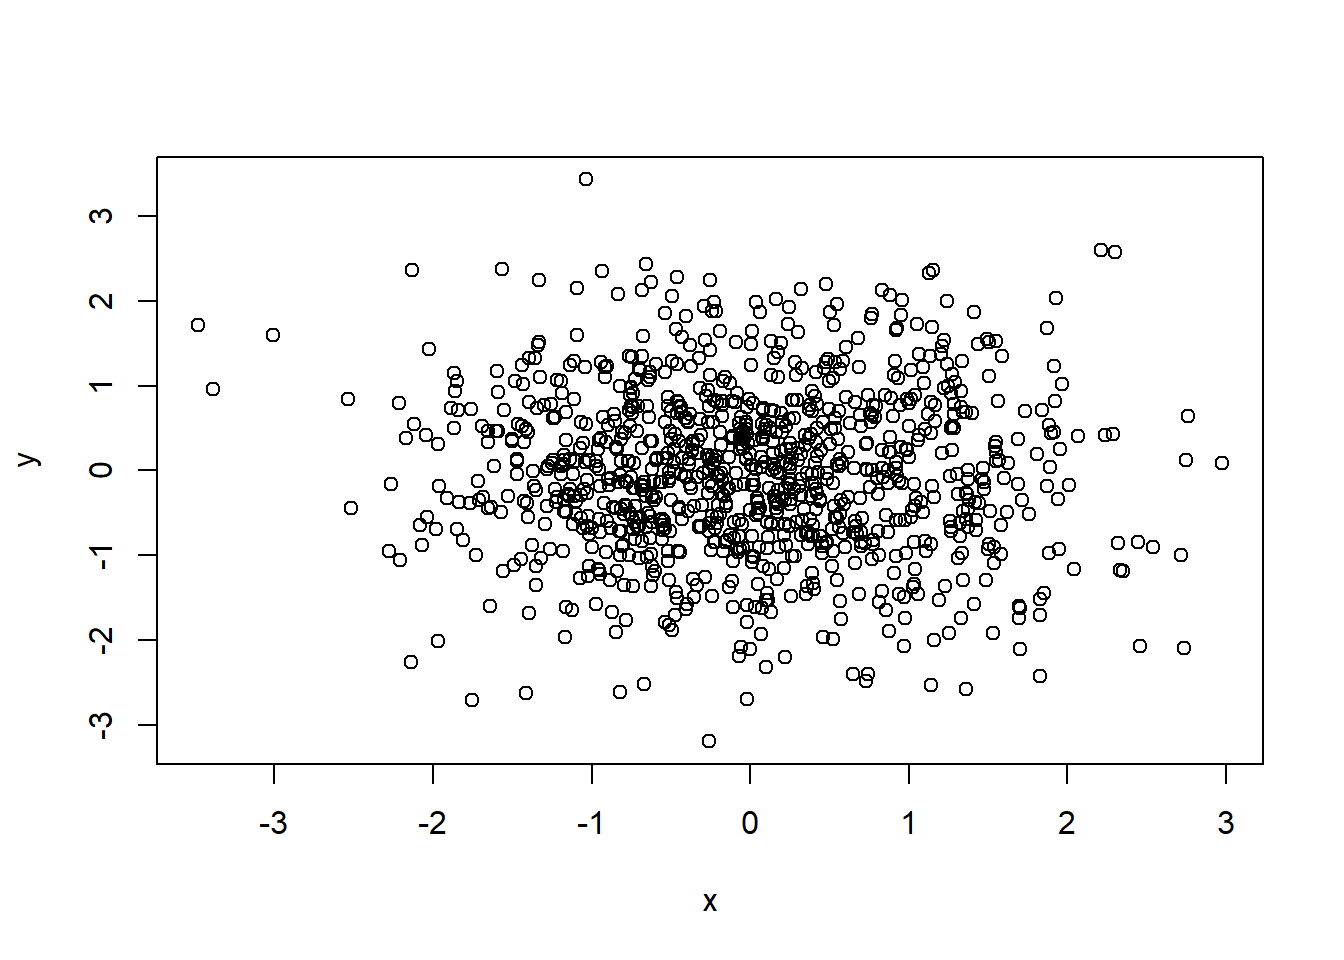
x = rnorm(1000)
y = 2 + 0.5*x + rnorm(1000)cor(x,y)## [1] 0.4195284plot(x,y)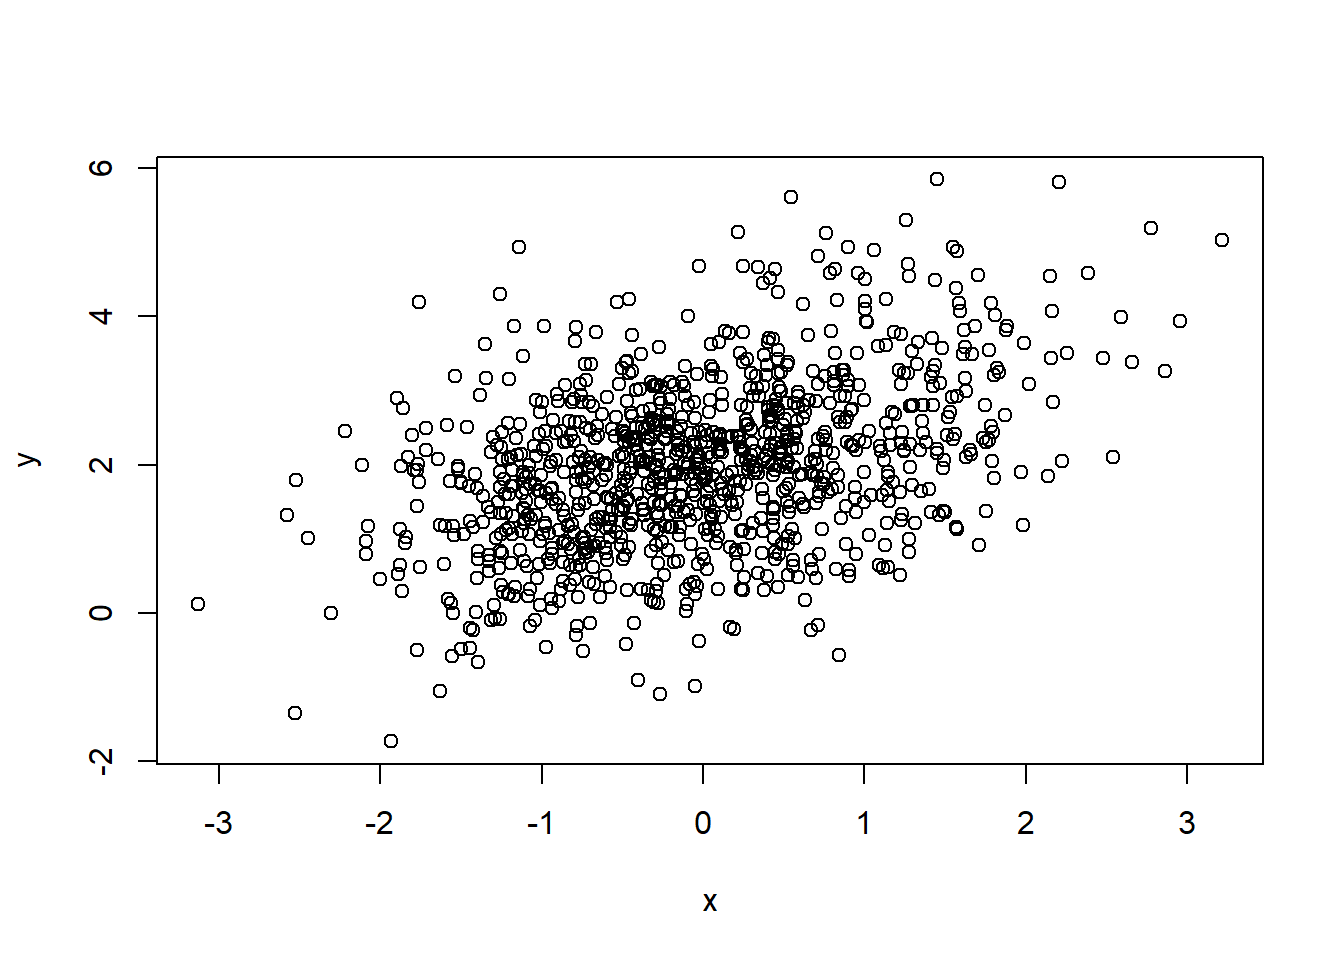
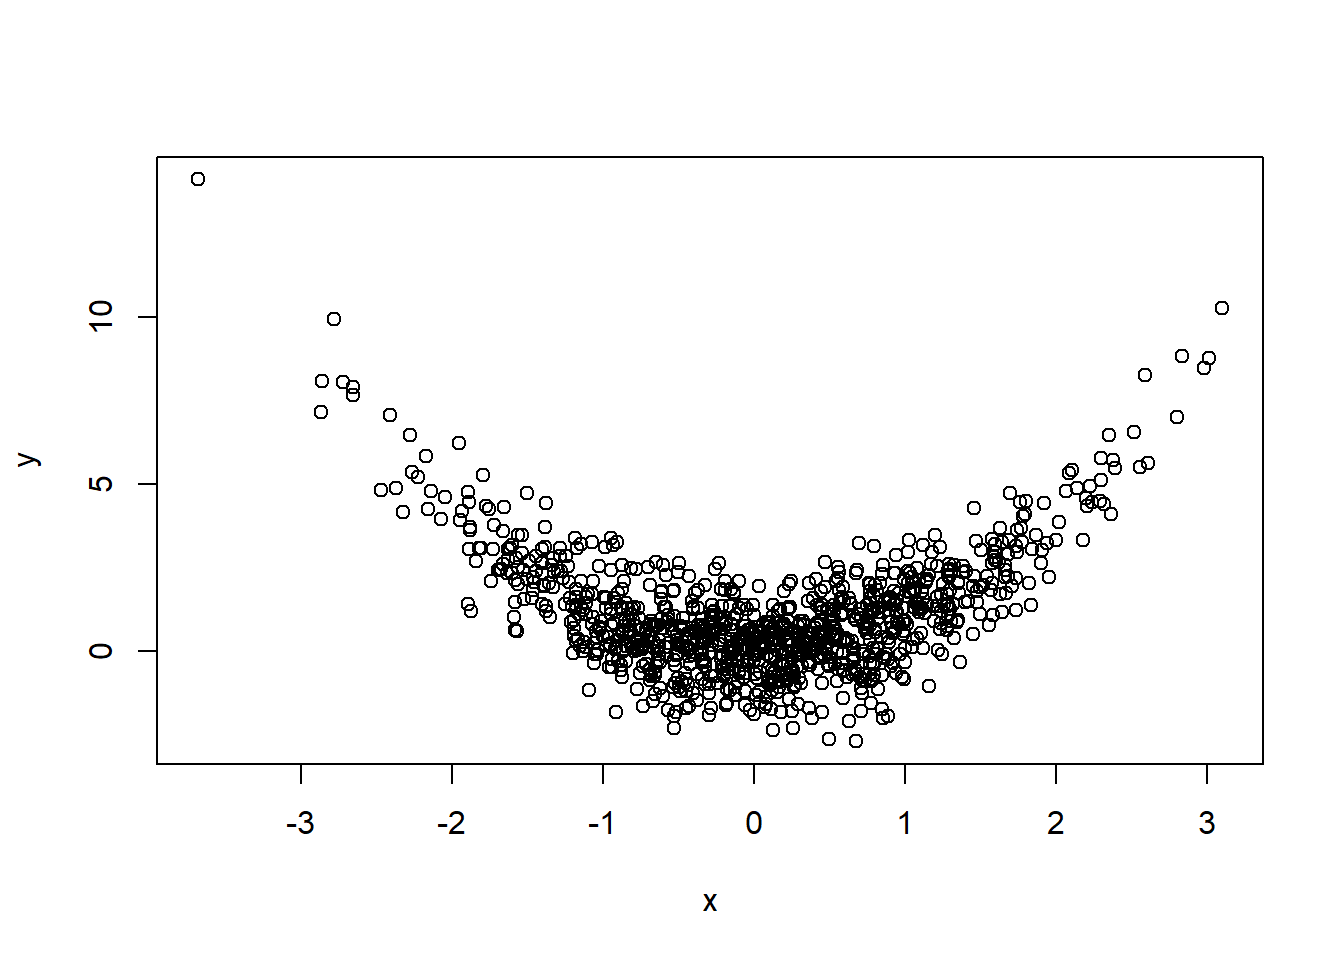
x = rnorm(1000)
y = x^2 + rnorm(1000)cor(x,y)## [1] 0.02173687plot(x,y)