Chapter 6 Causation
I bet you have heard that correlation is not equal to causation.
- Does it mean that correlation is useless?
Absolutely not. Correlation allows us to predict future event. Many academic tests that k-12 students take are for this purpose. Although these test scores do not cause students’ future outcomes such as high school graduation and admission into colleges etc., they can be used to make predictions based on their correlations with those outcomes, and these predictions could help us allocate educational resources.
- Does it mean that correlation has nothing to do with causation?
It doesn’t mean that, either. To show that A causes B, we must first show that A and B are correlated. Without correlation there cannot be causation. However, to show that A and B are correlated is not sufficient for proving that A causes B. Proving causation needs a lot more work.
- Why is it important to find causation?
Prediction alone does not provide the remedies. Whereas we can sometimes solve a problem without knowing the source of it (e.g. by trial and error), finding the cause is often the most reliable starting point of intervention.
6.1 Experimental Studies
The following plot shows one group of students’ performance measured over time. At some point, a program was introduced. You can also see this as health measures of a group of patients before and after they started taking a type of drug. What would you say is the impact of this program/drug? Is this the way how clinical trials are run–enlisting one group of patients, giving them the drug, and observing the recovery patterns?
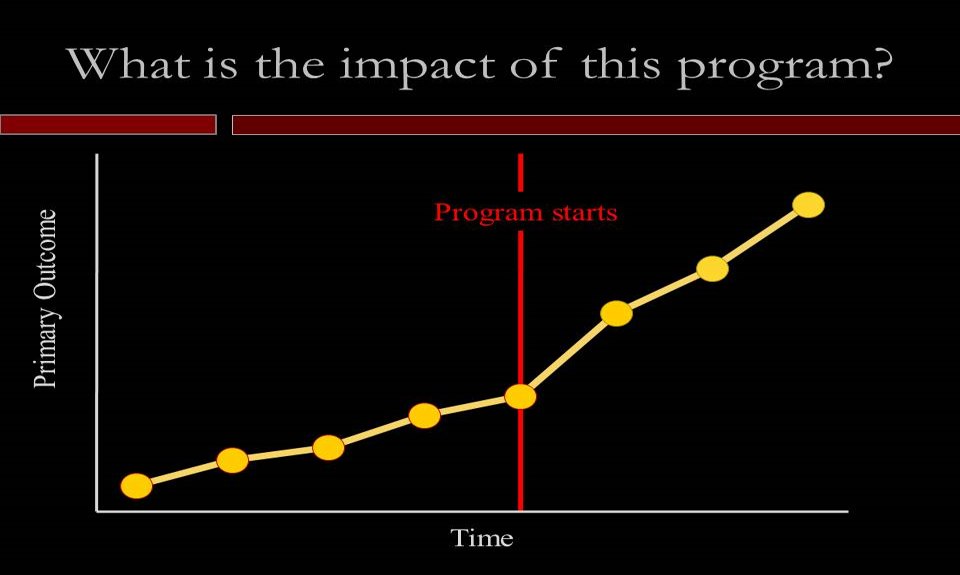
A. positive
B. negative
C. zero
D. not enough information to say
What do we mean when we talk about the impact of an intervention?
Impact is defined as a comparison between 1) the outcome after the intervention has been introduced, and 2) the outcome at that same point in time had the program not been introduced.
The imagined outcome of the same group of individuals had they not gone through the intervention is called the “counterfactual.”
Counterfactuals ask: what if something had not happened? These “what if” questions are the building blocks of scientific thought as well as moral behavior. It is a uniquely human way of thinking about the world. The ability to reflect on one’s past actions and envision alternative scenarios is the basis of free will and social responsibility. It is also a crucial idea that lead scientists over centuries to come up with methods to nail down the causes of physical and social phenomena.
The problem is that counterfactuals, as imagined states of the world, are never observed. So we try to mimic it in scientific research.
The counterfactual is usually mimicked with a group of individuals who did not participate in the intervention. This group is usually referred to as the control group or comparison group. How this group is selected is a key decision in the research design.
This may sound unreasonable in our normal lives, but in the context of experimental research, people should not be allowed to make their own choices about which group they will get in. Cancer patients enrolled in clinical trials do not know whether they are taking the real treatment or just a sugar pill.
Randomized Controlled Trial
In a randomized controlled trial, aka true experiment, there is usually one or more treatment group(s) and a control group, and the participants are randomly assigned to the groups.
Why is random assignment important?
Suppose we compare a private school and a public school in the same school district, and find that the private school students score higher on some standardized tests, can we conclude that the private school teachers do a better job than the public school teachers?
You’d probably protest that this comparison is not fair, that the private school students tend to have many other advantages, such as more resources, and they probably even attended better pre-schools.
Exactly. The comparison wouldn’t be fair if the two groups had unequal baselines. If we want to see what kind of school does a better job in educating their students, we’d better make sure that the students have equal academic achievement to start with.
And this is what random assignment does–it is an equalizer. If participants are assigned randomly to the groups, it means that the group differences would be random, i.e. non-systematic. And if the groups do not differ systematically at the outset of the experiment, any group difference that subsequently arises is more likely due to the treatment than anything else.
6.2 Correlational/Observational Studies
Random experiment is the gold standard for finding causal relations.
But random experiments are hard to do, and sometimes outright impossible, especially in health and education-related research.
Consider if it’s possible to carry out an experiment to study the following topics:
- Does smoking cigarettes causes lung cancer?
- People who are oldest in birth order tend to be higher achievers than their younger siblings.
- Chronic childhood stress negatively affects children’s self-control skills.
When it’s impossible to experiment for a topic, do we just give it up?
Absolutely not. We can start with something less ideal–a correlational or observational study.
Example 6.1
A 1998 study in the New England Journal of Medicine revealed an association between regular walking and reduced death rates among 8,000 retired men.
Are you convinced that walking leads to better health? If not, what would be an alternative explanation for the correlation?
I, for one, am not convinced by this study that walking causes better health. Here are some alternative scenarios that are equally probable based on the correlation between walking and reduced death rates:
It is certainly possible that walking causes better health: Walking \(\Longrightarrow\) Health
It is equally possible that the causation works the other way–only those who are healthier to start with can manage to walk regularly: Health \(\Longrightarrow\) Walking
It is also possible that a third factor, such as age, causes both walking and health, i.e. those who are younger tend to be healthier and they are also more eager to get out of the house: \[\mbox{Walking} \Longleftarrow \mbox{Age} \Longrightarrow \mbox{Health}\]
Based on what the researchers did for this study, we have no way to rule out any of these plausible explanations. The study did make an important contribution to our understanding about walking and health among the elderly population–it established the correlation, which is the first step towards showing causation.
Such a study that only takes measures (via observations or surveys etc.) after their participants already made their own choices (the retired men chose to walk or not to walk regularly out of their own will) is called an observational study. Since it is only capable of showing correlation and not causation, it is also called a correlational study.
Example 6.1 Continued
Suppose, in a totalitarian society ruled by researchers, we can randomly assign retirees to a walking group and a non-walking group, and we can actually make sure that the walking group walks regularly and the non-walking group doesn’t. Suppose, with this design, we find out that the walking group outlives the non-walking group, would you be convinced that walking is good for your health?
I would. Because among the 3 possible explanations we came up with, 2 can be ruled out.
It is not possible that Health \(\Longrightarrow\) Walking, because they cannot choose to walk or not. For the same reason, it is not possible that a third factor causes both health and walking.
The only viable explanation left is that Walking \(\Longrightarrow\) Health.
Example 6.2
Can you design an observational study and an experimental study to find out about the effect of test anxiety on test performance? What would these studies look like?
Correlational/observational approach: We would measure students’ anxiety level at the time of the test, and correlate their anxiety level with their test scores.
Experimental approach: We would randomly assign students to a high-anxiety group and a low-anxiety group. In the high-anxiety group, we could add some pressure, saying things like the test scores are accurate reflection of your intelligence, or they carry some kind of consequences. In the low-anxiety group, we say some soothing words and assure them the scores are not consequential. We would then compare the results.
6.3 Coming up with alternative explanations
Once we identified correlation between two variables via an observational study, how do we proceed to show causation?
One very important skill to push the research forward is coming up with alternative explanations for an observed correlation. It is a skill that you are expected to practice in this class and use for your final project.
Wait, you might say, this sounds like just an exercise of imagination or speculation, are you telling me that in a stats class we are supposed to be graded on our imagination skills?
Yes, in essence. Let me explain.
First, it is an important debating skill. In a debate, you often see both sides providing evidence to back up their claims. At this point what’s to be done? They can choose to ignore the evidences raised by the other team and keep talking across each other. This is how debates are often carried out in politics, sadly. Not in scientific debates. In science, once we get some evidences, the next step is to scrutinize these evidences both for our opponent teams and for our own team. And a major way to scrutinize the evidence is to come up with alternative explanations and show that the evidence does not necessarily lead to the conclusion.
In short, the stronger the devil’s advocate is, the holier the saint is.
Second, it’s not about wild imagination. To come up with solid, plausible alternative explanations, we need some basic training in research methods and some background knowledge about the topic studied. Scientists often go through volumes of past research to come up with plausible confounding variables that would explain a correlation.
A formula for coming up with alternative explanations
If X is correlated with Y, consider if the following scenarios are plausible:
X causes Y: X \(\Longrightarrow\) Y
Y causes X: X \(\Longleftarrow\) Y
A third variable (aka confounding variable) causes both X and Y: X \(\Leftarrow\) Z \(\Rightarrow\) Y
Pure accident (this is easy to rule out as long as we have big enough sample size)
Example 6.3
A study found that people who swear a lot tend to be more honest. What might be some of the plausible explanations for this correlation?
- swearing helps you to relieve stress and thus becomes more honest.
- honest people are more likely to swear.
- people who are more oblivious to social conventions are more likely to be honest and also swear more.
Example 6.4
A study found that middle-aged people who take vitamins regularly are less likely to die prematurely. What might be some of the plausible explanations for this correlation?
- vitamin causes better health.
- healthier people takes more vitamins. (doesn’t seem very plausible)
- people who are more health conscious are more likely to take vitamins regularly and be more healthy (most likely because they also do other things such as eat healthy).
6.4 Sample
Suppose a friend of yours is choosing between 2 weight loss programs. Program A reports that their participants lost 15 lbs over 3 months on average, program B says their members lost 25 lbs over 3 months. Your friend intends to get into program B. What would you say about that? If he/she could gather some more information about these programs, what would you suggest they ask about?
When we judge how trustworthy or how applicable the conclusion of a research study is, besides considering its design (i.e. experimental vs. observational), we also need to look at its sample–how big and how representative it is.
Sample vs. Population
- Sample: the group of subjects actually recruited in a research project.
- Population: the entire set of people targeted by the research.
- Representative sample: a sample that resembles the entire population with respect to the relevant demographics and the main variables.
Example 6.1 Continued
In the walking study among retired men, it looks like the population is elderly men. The sample is the 8,000 retired men that responded to their surveys. Is it a representative sample? We need to consider what are some of the demographic factors that could affect a retiree’s health. What came to my mind includes age, ethnicity, and socio-economic status. So if the sample has retired men from different age groups, all ethnic groups, and all SES status, we would say it’s roughly representative.
Descriptive vs. Inferential Statistics
In descriptive statistics, we are only interested in the sample, and we usually aim to describe the sample with measures of central tendency, measures of variability, and measures of correlation etc.
In inferential statistics, the goal is to use a particular sample to gain general knowledge about the whole population. For example, election polls often reach tens of thousands of people, and the goal is not to find out about the opinions of this particular group, but to predict the national or state-wide outcome. Similarly, in a vaccine clinical trial, the ultimate goal is to find out if the vaccine works, not just for the group of people enrolled in the trial, but for the whole world’s population within a certain age group.
When critiquing a research study, we evaluate two aspects of it:
how trustworthy the result is, i.e. does it even hold water for that particular sample. For this we examine its design, its sample size, and some other things that we won’t talk about in this class (such as measurement).
how applicable/generalizable the result is, i.e. even if it is true for that sample, is it also true for others? For this we need to consider both the size and the representativeness of the sample.