Making Sense of Data with R
2022-08-21
Chapter 1 Getting Started
1.1 Opening a notebook in Google Colab
Step 1: Log in to your JCU (google) email account
Step 2: Click here or type the short URL: https://colab.to/r to open a new R notebook in Colab.
To check if this is really an R notebook (instead of python), click on the “Runtime” tab, then click on “change runtime type.”
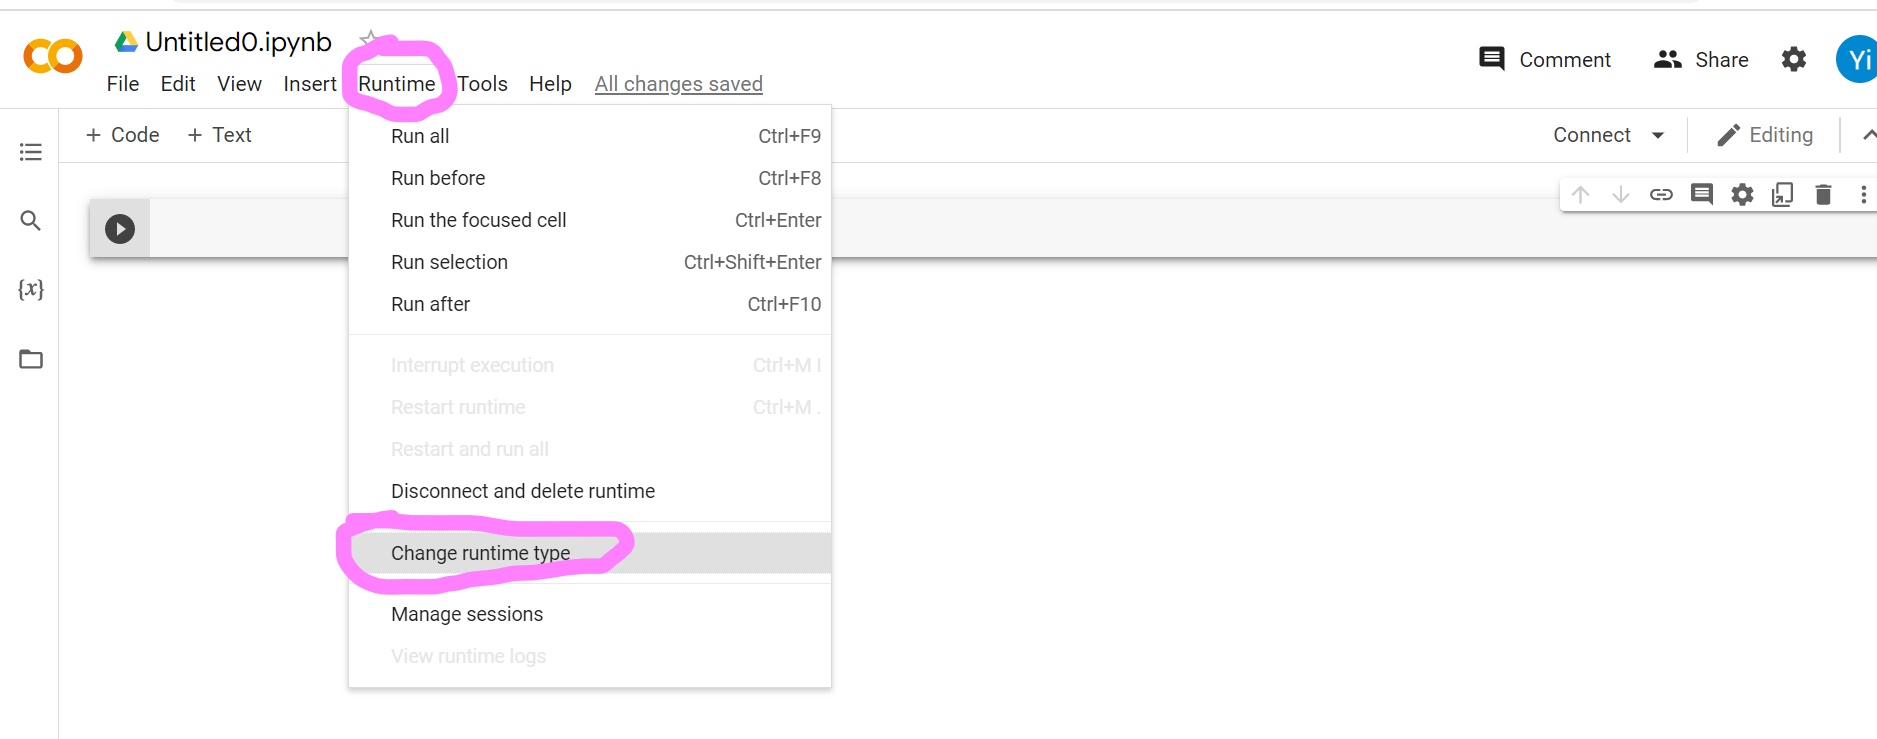
And you should see this:
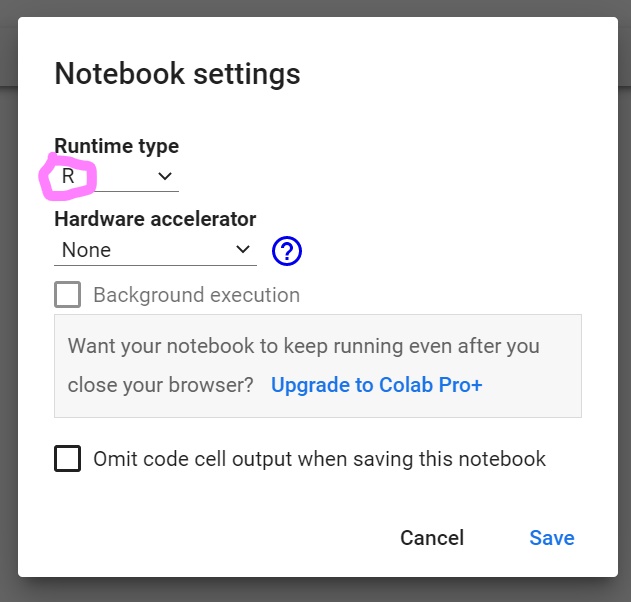
Now hit “Cancel” and go back to the notebook. Try typing a line of code in the cell, such as:
plot(1:10)To run this line of code, either hit the play button:
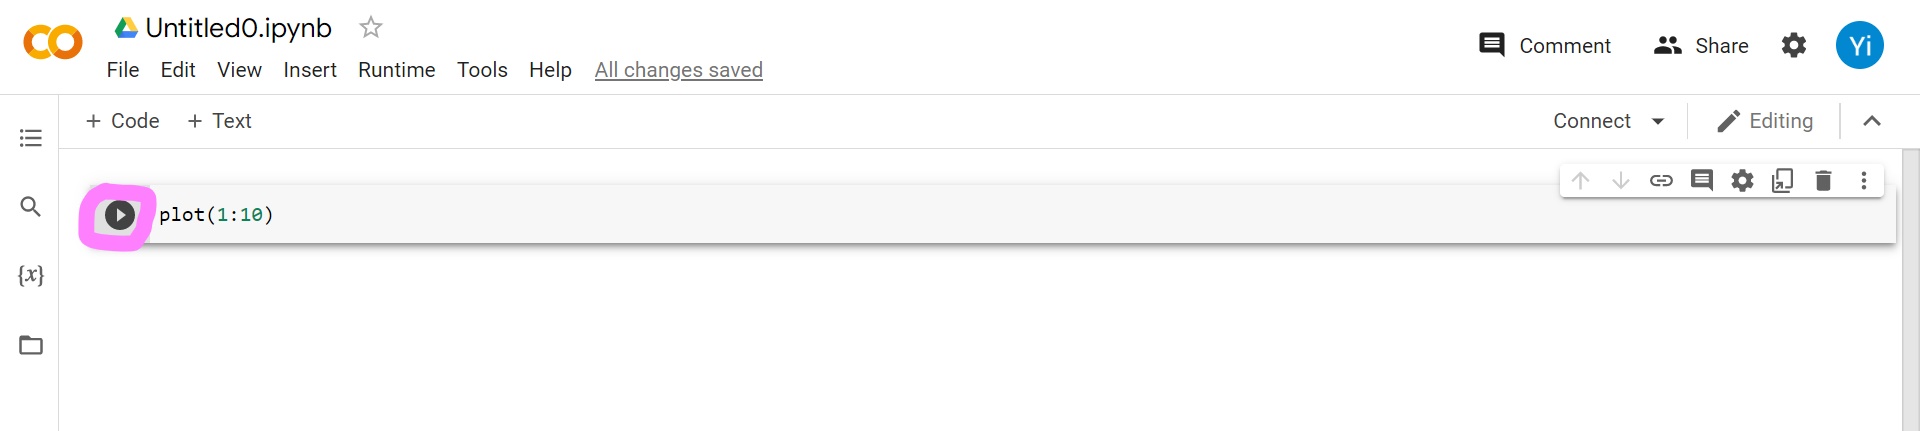
Or use the shortcut key: CTRL + Enter
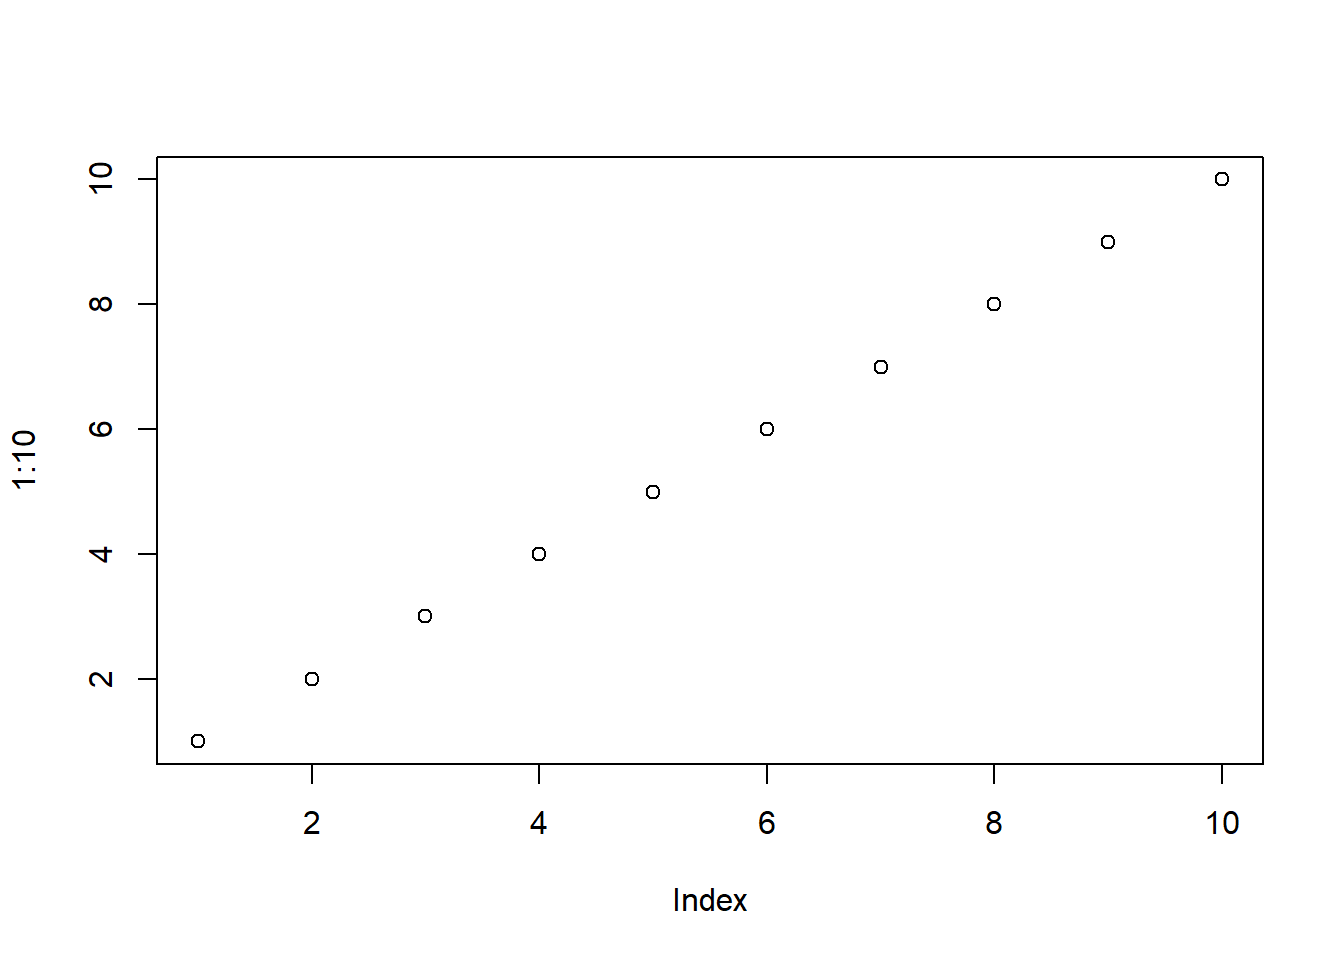
And you should get the following plot:
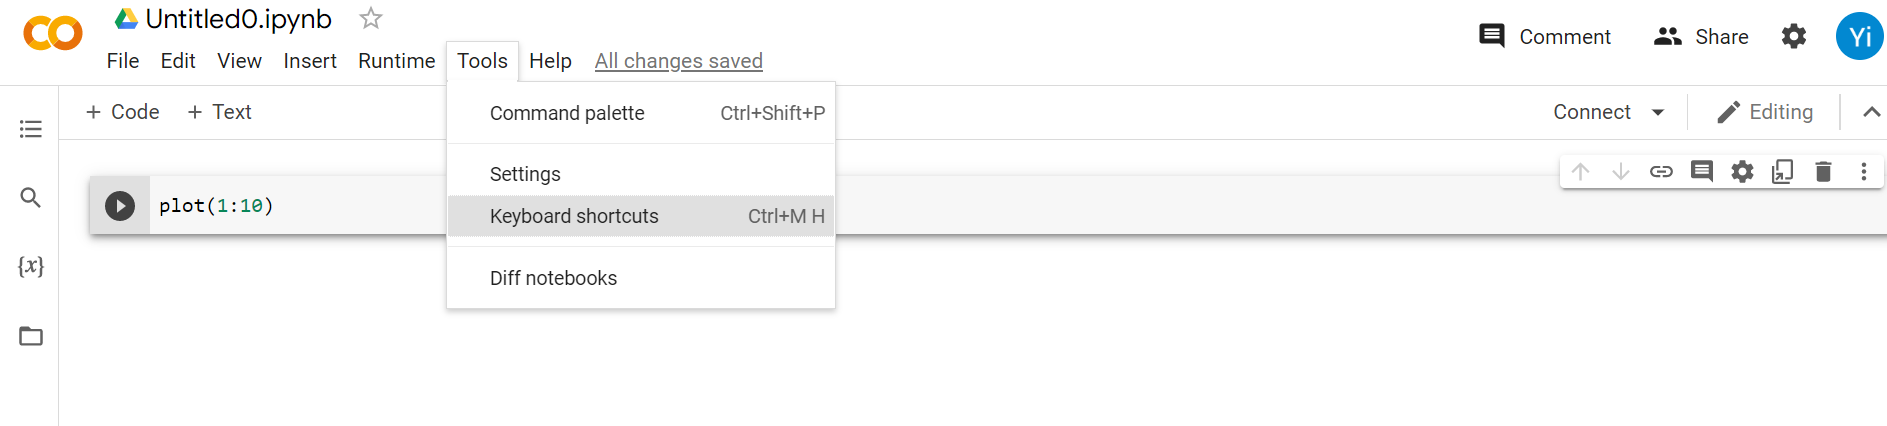
BTW, knowing some short-cut keys will allow you to run the code easier and faster. To learn some of the shortcut keys, go to “Tools,” then “Keyboard shortcuts”
Meanwhile, a folder has been created in your google drive. To check this, go to your google drive, and you should see this:
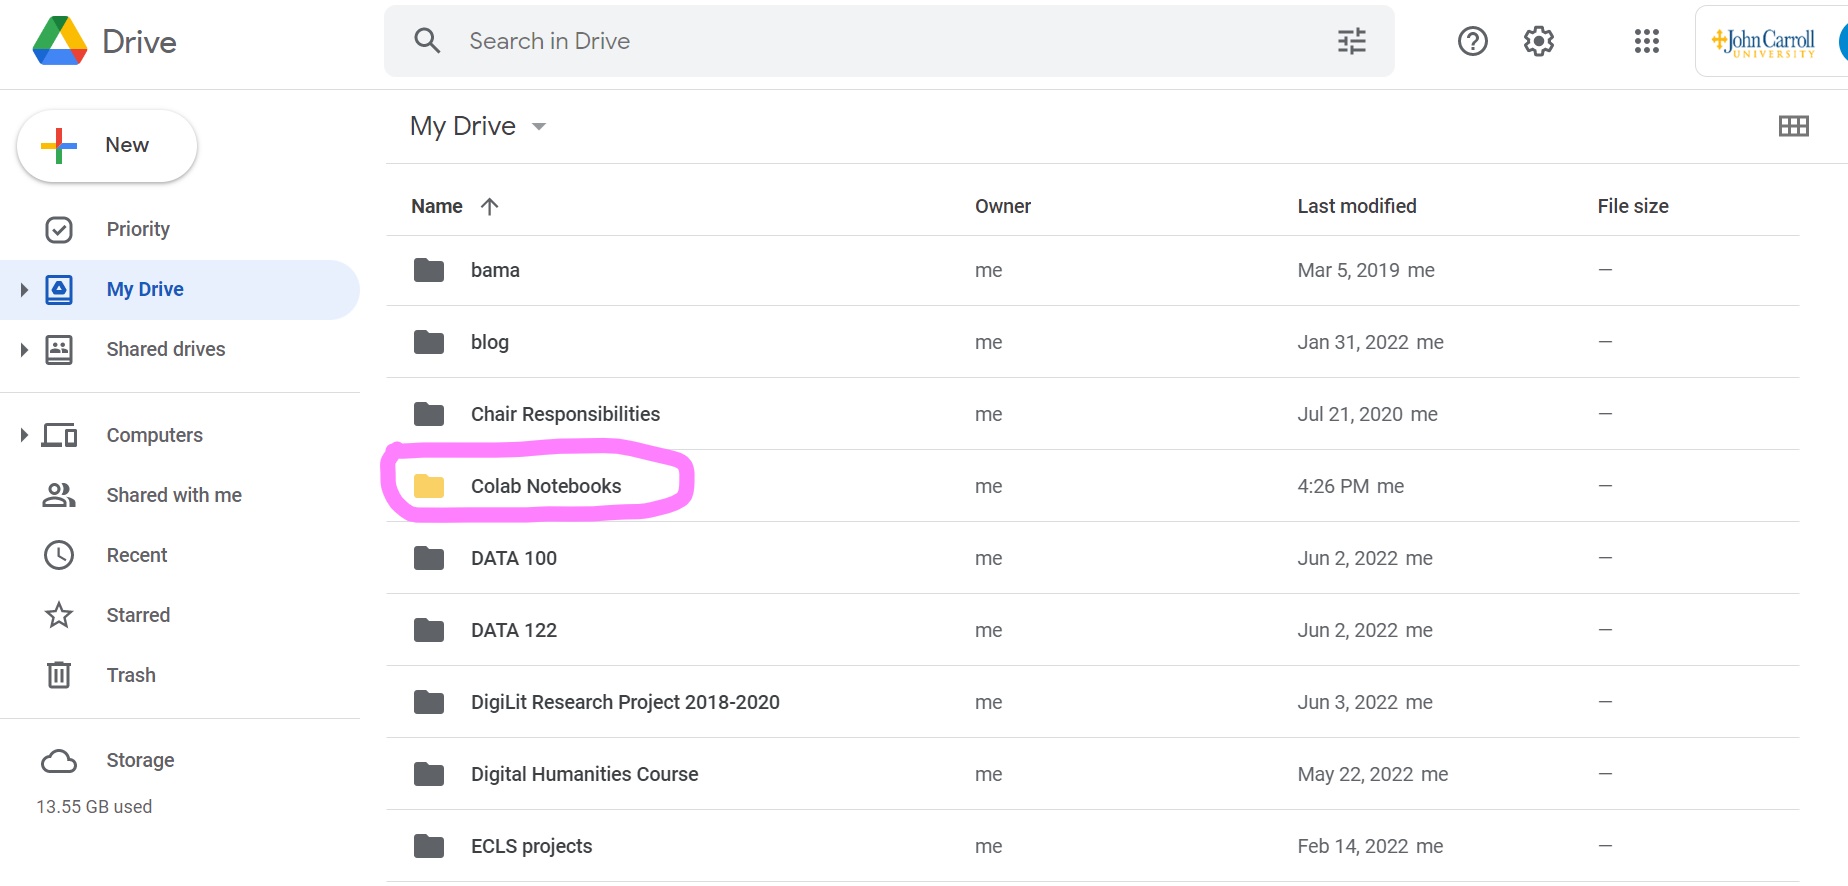
Feel free to rename and organize this folder as you see fit.
1.2 Mount Google Drive to Google Colab
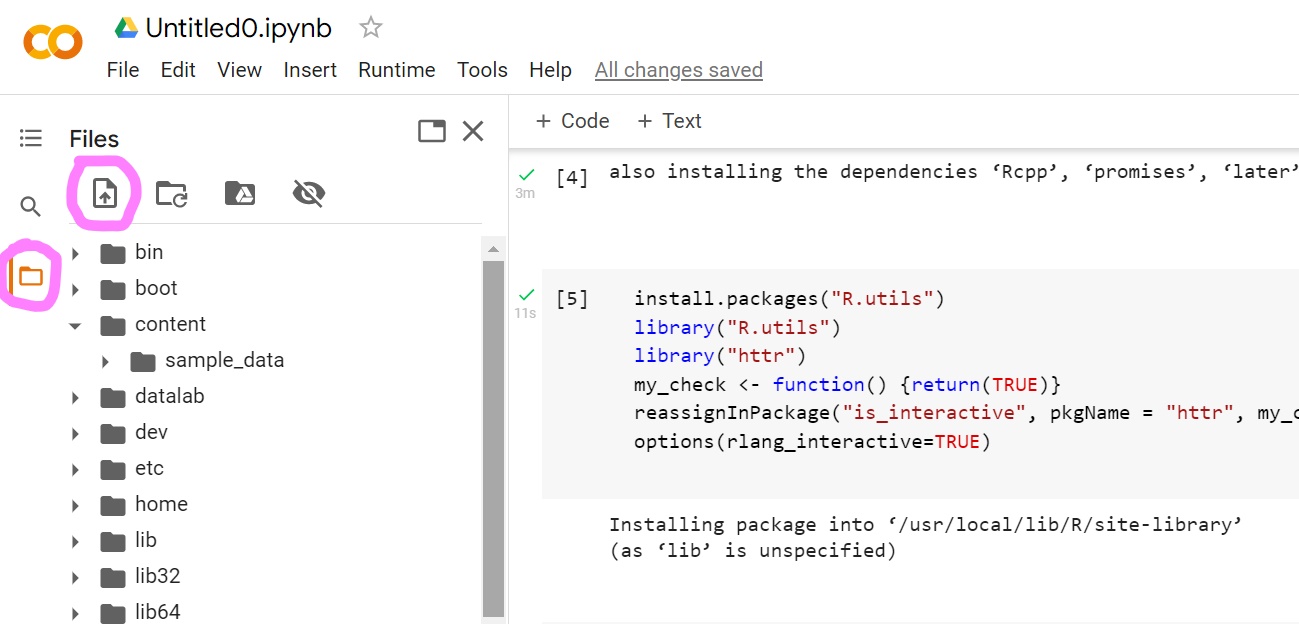
Run the following code so you can access your google drive from the R notebook. Copy and paste each block into a separate cell and run them in sequence.
install.packages("googledrive")
install.packages("httpuv")
library("googledrive")
library("httpuv")install.packages("R.utils")
library("R.utils")
library("httr")
my_check <- function() {return(TRUE)}
reassignInPackage("is_interactive", pkgName = "httr", my_check)
options(rlang_interactive=TRUE)drive_auth(use_oob = TRUE, cache = TRUE)The last line of code will show you a link.
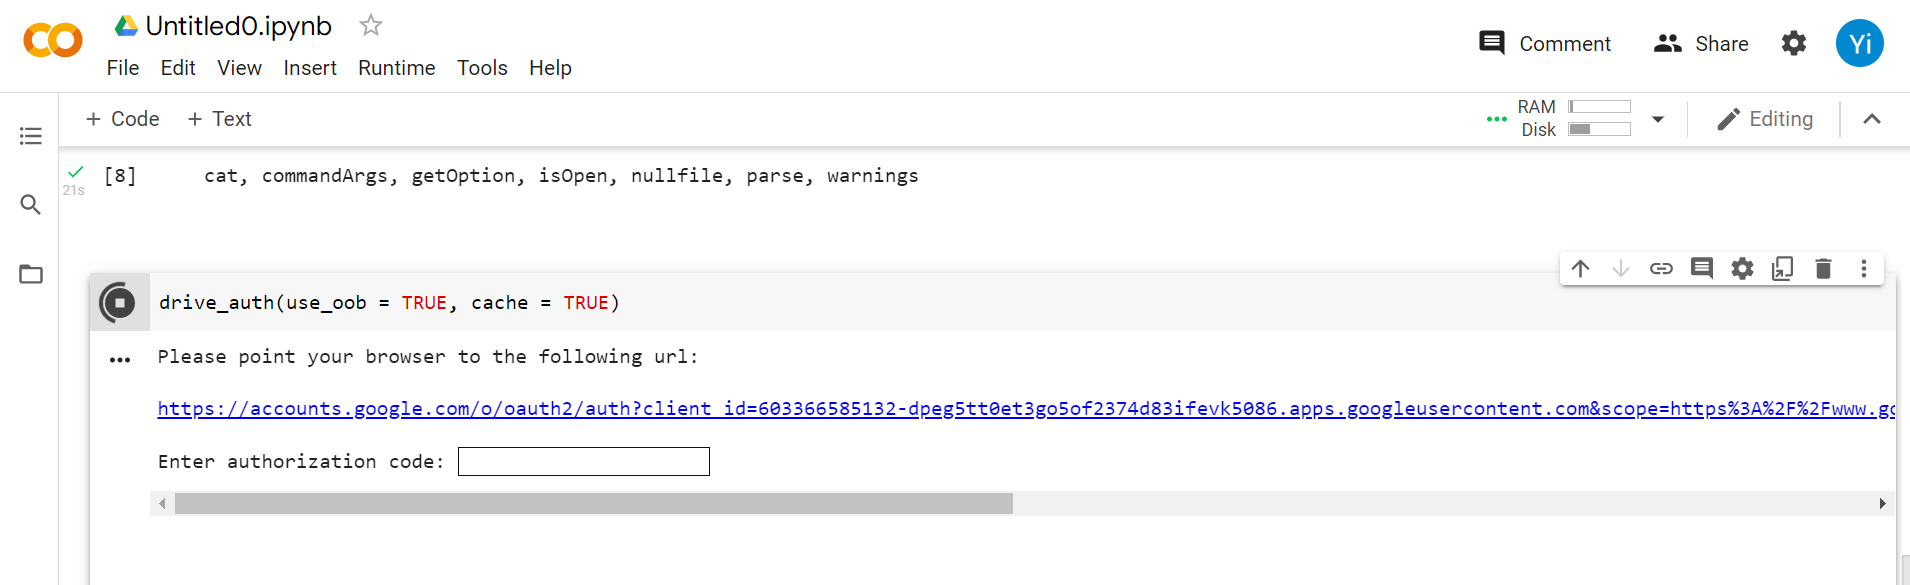
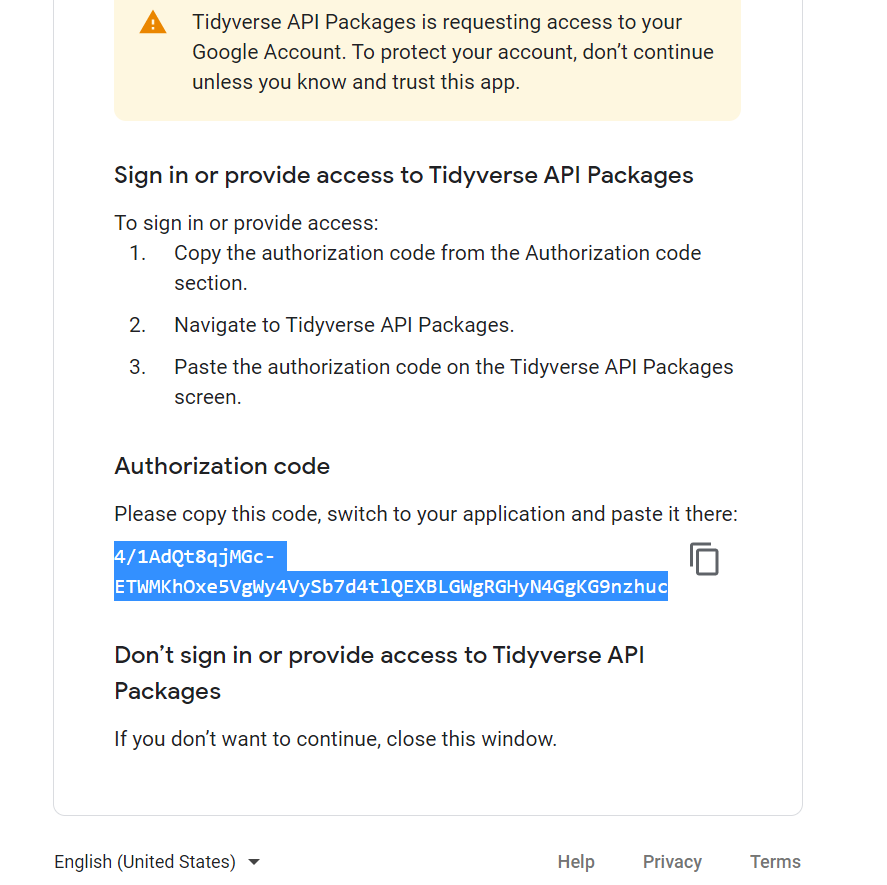
Click on the link, and you will get an Authorization code. Copy the code and paste it in the above cell.
And you are done!
1.3 How to Open Data in the R Notebook
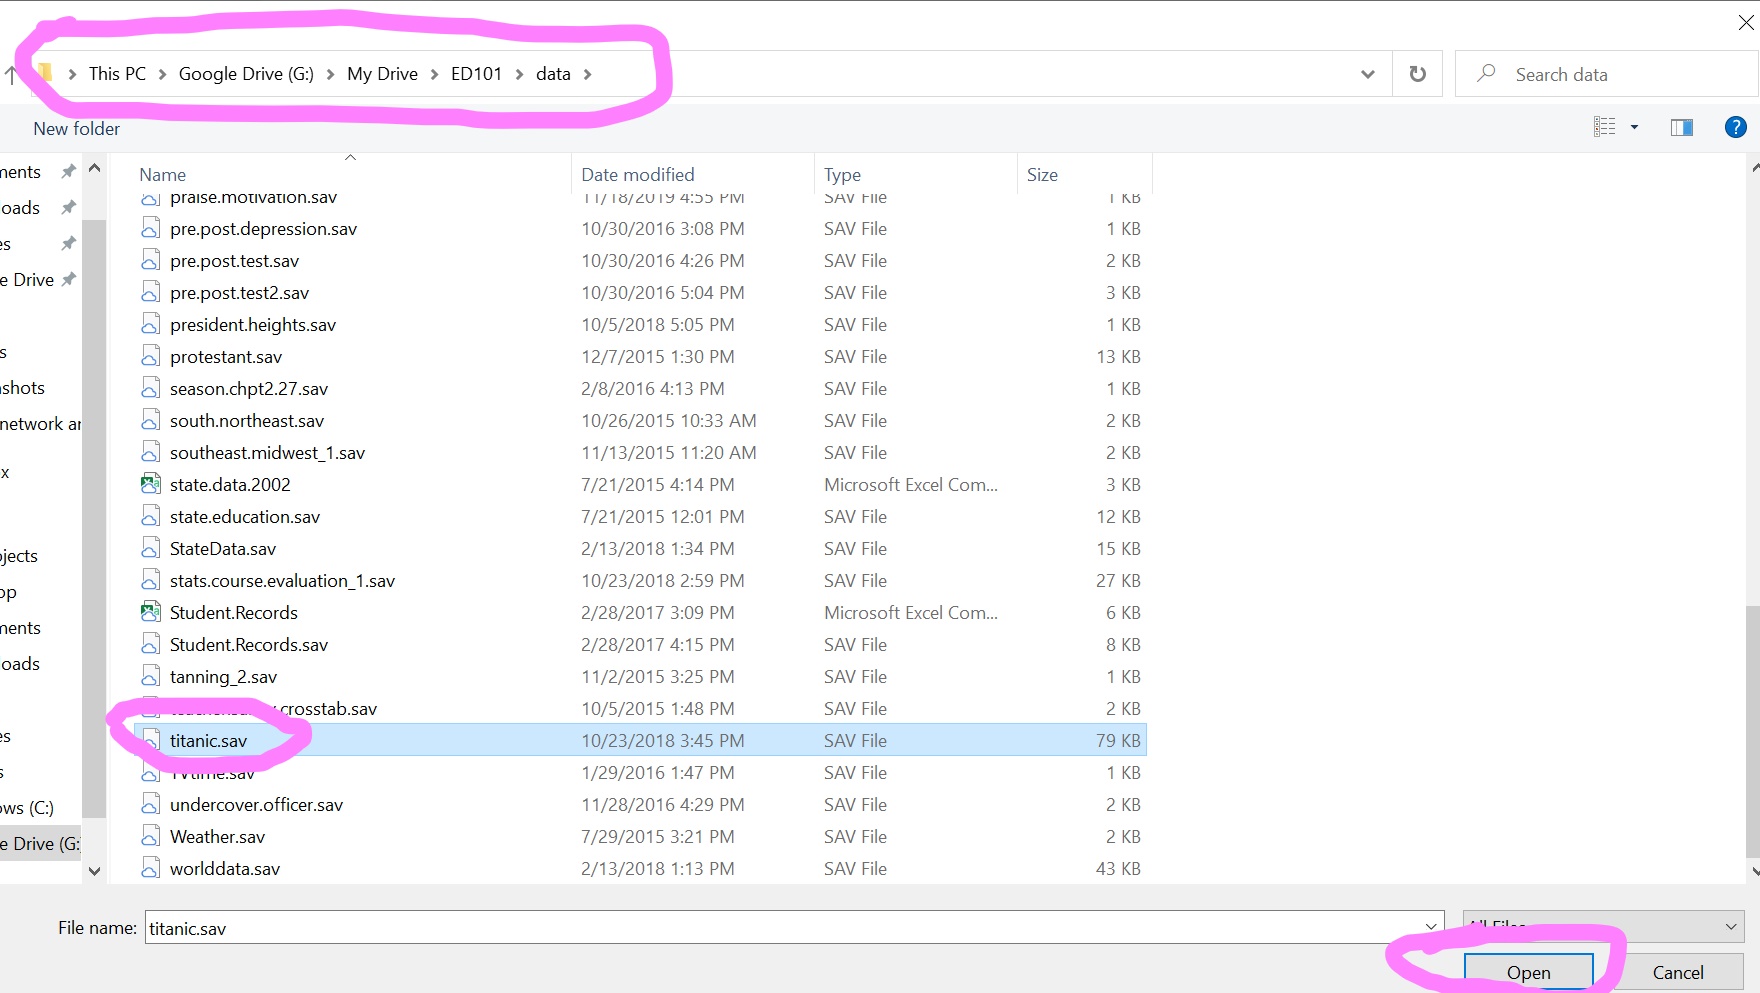
Step 1 Download the data from canvas, save it in your google drive or a folder in your computer.
Step 2 Upload the data in your file directory
 Find your folder in the address bar. Find the data you want to upload. Hit “Open.”
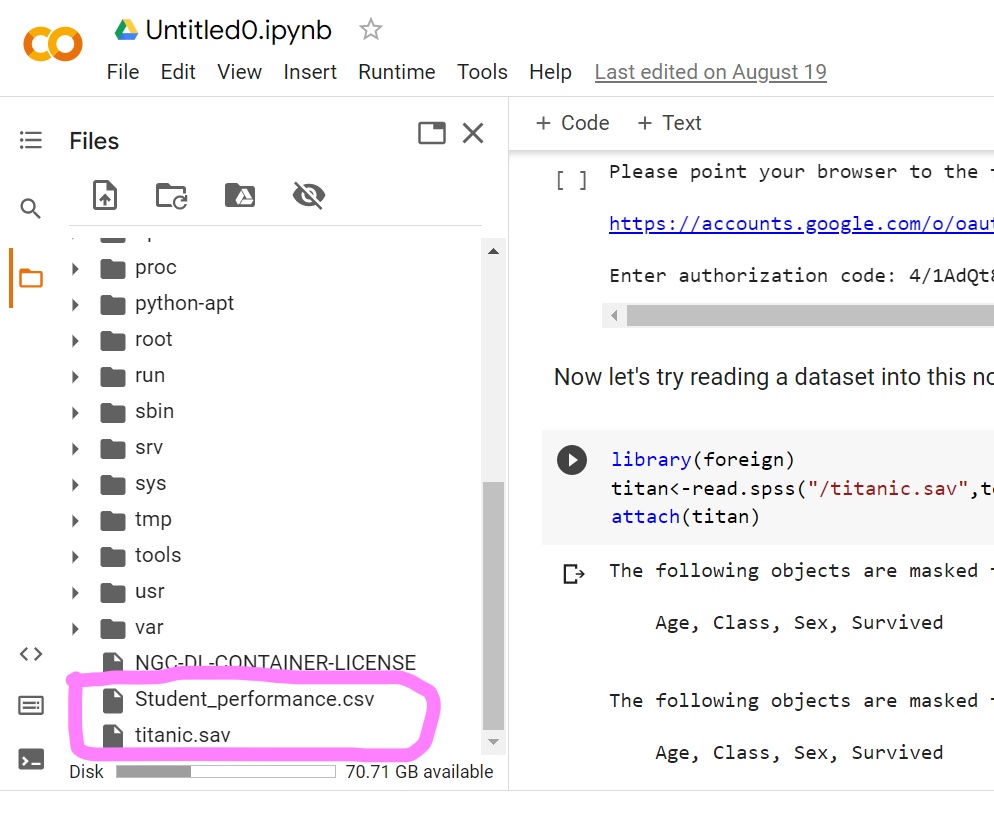
 You should be able to see the data appearing at the bottom of your file directory.
1.3.1 How to Read Data with .csv extension
Use the following code to read and attach the data:
sp=read.csv("/Student_performance.csv",header=TRUE)
attach(sp)
Two parts in the read.csv line need to be altered to fit your own case:
The part to the left of the equation sign, sp, is a nickname you give to the data. You can change it to anything else, but you should stick to this nickname whenever you refer to this particular data.
The part inside the quotation marks, Student_performance.csv, is the actual name you saved the data as. Make sure this name matches exactly what you have in the data folder.
1.3.2 How to Read Data with .sav extension
Use the following code to read .sav data:
library(foreign)
titan=read.spss("/titanic.sav",to.data.frame=TRUE)
attach(titan)
Two parts in the read.spss line need to be altered to fit your own case:
The part to the left of the equation sign, titan, is a nickname you give to the data. You can change it to anything else, but you should stick to this nickname whenever you refer to this particular data.
The part inside the quotation marks, titanic.sav, is the actual name you saved the data as. Make sure this name matches exactly what you have in the data folder.
1.4 Some Basic Concepts
1.4.1 What is a ‘case?’
In a conventional data spreadsheet of whatever format, each column would represent a variable, and each row, a case.
Usually, a case = an individual person, but it can also be an animal, a state, a country etc. It’s the unit on which measurements are taken. For example, in our class survey data, because the questions are answered by individual students, each student is a case. But if I have a dataset that allows me to analyze the relationship between a country’s economic development and its fertility rate, a case = a country.
1.4.2 Data and Statistics
Data are the original information collected from individual cases. Statistics are the summaries of data in one way or another.
Example 1.1
The fact that your author is female is a datum. Once we know everyone’s gender, we can summarize that there are, say, 16 females in our class, and this is a statistic.
Example 1.2
In the following table, what are the data and what are the statistics?
| Dropped Out | Graduated | Total | |
|---|---|---|---|
| Boys | 5 | 70 | 75 |
| Girls | 1 | 72 | 73 |
| Total | 6 | 142 | 148 |
1.4.3 Estimation
An estimation is an educated guess typically based on two things: factual evidence, and reasonable assumption.
Therefore, to evaluate how good an estimation is, we need to ask for the evidences and the assumptions and check each respectively.
Example 1.3
You may have read in some major media that Covid-19 shortened the US life expectancy in 2020 by 1.5 years. How reliable is this estimation? Does it mean all of us can now expect to die a year and a half earlier?
As an estimation, this number is certainly derived based on some facts and some assumptions. Since it comes from the CDC, we will presume that the facts are solid. But what are the assumptions behind this estimate, and are they reasonable?
An epidemiologist published an editorial on Wall Street Journal and pointed out that the life expectancy reported by CDC is the average length of life of a hypothetical American who, from birth to death, is exposed to the mortality rates observed in the current period. In other words, their assumption is that Covid will be killing people forever at the same rate as it did in 2020. This doesn’t strike me as a reasonable assumption. What do you think?
1.4.4 Variable
A variable is a trait or characteristic of the cases.
Variable = Vary-able, so a variable must be able to vary. It is a trait that changes from case to case.
But each of us has countless numbers of traits in which we may differ from others. Are they all variables?
In the context of research and statistics, no. When we talk about a variable in a research study, it must be a trait that is measured.
Example 1.4
In our class survey, you were asked 6 questions, from your height in inches to whether you are a dog lover or a cat lover. Each of these questions is a variable. People are expected to provide different answers to these questions, so they are traits that vary from person to person. They are also measured, in the sense that the information is collected at the individual level.
Note that when we talk about a variable, we are always talking about data, not statistics. So, whether you are a dog lover or not, this is a variable. But having 20 dog lovers in our class is NOT a variable, since it is a trait of the whole class, not of individual students.
Example 1.5
A research study was done to test an effective way to promote healthy eating among adolescents. A class of 8th graders were divided into two groups. One group got education about the effect of proper nutrition on their health. The other group learned about how healthy eating promotes social justice and environmental protection. The researchers then observed and recorded the students’ choices in the school cafeteria. Consistent with their belief, the second group made a much bigger improvement in choosing healthy foods.
What are the main variables in this study?
We know a bunch of characteristics about these students–they were in 8th grade, they got some education related to healthy eating, and finally, they were spied on their choices of food in the school cafeteria. Are they all variables?
Grade, or age, is not a variable in this study. Although age could be an important factor in our eating behaviors in general, in this particular study, everyone is an 8th grader, so it is not a variable–it does not vary from case to case.
What type of education they got in regards to healthy eating is one of the main variables. It varies from case to case. It is a crucial characteristic of the students (although it’s not a natural trait but a manipulated one). And it was measured–the researchers knew exactly who got what kind of education.
Their choice of food is another main variable. It also varies. It is also highly relevant to the purpose of this study. And it was measured–“observed and recorded.”
How about students’ socio-economic status? You can certainly argue that this would be a very important factor that could affect students’ food choice, and of course it varies from student to student, but it is not a main variable in this particular study, because we are not told that this factor was actually measured.
1.4.5 Categorical Variables and Quantitative Variables
Categorical variables are variables that are expressed in categories.
Some categorical variables have unordered categories, such as race, gender, academic programs, political party affiliations etc.
Some categorical variables have ordered categories, such as class rank, levels of education etc.
Quantitative variables are variables that are expressed in numbers.
Note that not all numbers are truly numbers. Consider your credit card number and social security numbers. Are they really numbers? Why?
Also note that many variables can be measured both categorically and quantitatively.
Example 1.6
Suppose one of the main variables in a research study is how much formal education someone has had. This can be made either a categorical variable or a quantitative variable, depending on the specific research question and the feasibility of data collection:
As a categorical variable, it would contain values such as “high school dropout,” “completed high school,” “some college,” “Bachelor’s degree,” “Master’s degree,” and “Doctoral degree” etc.
As a quantitative variable, it can be measured in number of years.
1.5 Exercises
1.5.1 Identify main variables in research summaries
1.5.1.1 Grapefruit Lowers Weight
A grapefruit or two a day, along with a healthy diet, could help shrink widening waistlines. This finding comes from one of several studies on the benefits of citrus fruits presented Wednesday at the annual meeting of the American Chemical Society in Philadelphia.
The so-called grapefruit diet – which advocates mostly eating grapefruit with some protein – has been popular on and off for weight loss for years, said Dr. Ken Fujioka, director of nutrition and metabolism research at the Scripps Clinic in San Diego and lead author of a study evaluating grapefruit for weight loss. Most nutrition experts have deemed the grapefruit-and-protein regimen unhealthy, and Fujioka is not advocating any return to such a strict diet. However, his findings do suggest that a grapefruit or two each day, added to a balanced diet, might help the weight-conscious stay svelte.
In the study, Fujioka and his colleagues assigned 100 men and women who were obese to one of four groups. One group received grapefruit extract, another drank grapefruit juice with each meal, another ate half a grapefruit with each meal, while the fourth group received a placebo. “They weren’t trying to diet,” he said. “To make everyone even [on activity], all were asked to walk 30 minutes three times a week.”
At the end of 12 weeks the placebo group lost on average just under half a pound, the extract group 2.4 pounds, the grapefruit juice group 3.3 pounds, and the fresh grapefruit group 3.5 pounds.
“In this study they had one and a half grapefruits a day,” he noted. “That’s not easy to do.” And participants ate the fruit more like an orange: “They cut it in half, then into four sections, then separated the fruit from the skin.” Eating grapefruit this way is thought to yield more beneficial compounds, he explained. Exactly how grapefruit might spur weight loss isn’t known, Fujioka said, but “it appears to help insulin resistance,” which develops as people become obese.
The weight loss associated with eating grapefruit isn’t surprising to another expert familiar with the study. “Eat fruit before any meal and you will lose weight,” said Julie Upton, an American Dietetic Association spokeswoman. “The fiber fills you up, and fruit has fewer calories than other foods.” One half of a grapefruit has 60 calories, no fat, and six grams of fiber.
1.5.1.2 Are opioid painkillers used more widely in North America than in Europe?
A recent study has found that people who have low-risk surgery in Canada and the United States fill prescriptions for opioid painkillers at nearly seven times the rate seen in Sweden.
1.5.1.3 Unjustified police shooting
Background: In the United States, police officers fatally shoot about three people per day on average, a number that’s close to the yearly totals for other wealthy nations. But data on these deadly encounters have been hard to come by. A pair of high-profile killings of unarmed black men by the police pushed this reality into the headlines in summer 2014. Since then, newspapers, enterprising individuals and the federal government have launched ambitious data-collection projects to fill the gaps and improve transparency and accountability over how police officers exercise their right to use deadly force. Research
Question: Some police shootings are justified (to protect themselves or to protect their colleagues), some are not. Are unjustified police shooting more likely to happen when the victims are minorities?
1.5.1.4 Reducing the risk of dementia
A healthy lifestyle might reduce the risk of dementia — but not in people with a high genetic predisposition to the condition. Although the exact causes of dementia are unclear, scientists think that both genetics and lifestyle have a role. Silvan Licher and Kamran Ikram at Erasmus University Medical Center in Rotterdam, the Netherlands, and their colleagues examined the incidence of dementia in 6,352 Dutch people aged 55 and older who were part of a long-term study. The researchers found that, among the individuals with a low genetic predisposition, those who had healthier lifestyles had a reduced risk of developing the condition. Among those with a high genetic predisposition, however, lifestyle doesn’t seem to influence dementia risks.
1.5.1.5 Getting a leg up
Platform shoes are back in fashion, at least in athletics. Many of the long-distance runners at the Tokyo Olympics arrived at the starting line sporting footwear with a distinctive chunky-looking heel. It was more than a fashion statement. The new shoes offer such a big performance advantage that critics have described them as “technological doping.”
In 2016 Nike released the first version of its “Vaporfly” model, which seemed to significantly improve runners’ performance. Vaporfly and its successors have since helped athletes smash a string of records. Geoff Burns, a biomechanics expert at the University of Michigan, expects that such shoes would lead to a marathon improvement of around 90 seconds. This hypothesis is still to be tested in research.
1.5.1.6 Why we love our cats and dogs
Based on surveys completed before the global pandemic, the American Pet Products Association estimated that about 85 million U.S. households owned a pet in 2019. In separate surveys conducted since the start of the pandemic, the association estimates that an additional 11 million U.S. households adopted new pets in the past year.
A systematic review from the University of Liverpool identified 17 studies that looked at the effects of pet ownership on people experiencing mental health problems. They found companion animals do improve mental well-being. Studies showed pets were especially helpful to military veterans suffering from post-traumatic stress disorder and to people with depression.
1.5.1.7 Resilience is in our nature
psychological research over the last few decades has shown convincingly that our default mode under adverse conditions is not vulnerability but resilience. The term resilience refers to the experience of undergoing adversity without suffering debilitating effects. The psychologists Ann Masten and Norman Garmezy, pioneers in the study of resilience, defined it as “the process of, capacity for, or outcome of successful adaptation despite challenging or threatening circumstances.” For example, resilience is at play when at-risk children achieve school success, when people maintain their poise in an emergency, or when survivors heal from trauma.
One important factor in predicting resilience is childhood attachment. In fact, a loving bond with a capable adult has been the strongest and most consistent factor linked in research studies to resilient outcomes. For example, Masten and Garmezy found that “children who experience chronic adversity fare better or recover more successfully when they have a positive relationship with a competent adult.”
1.5.2 Practice Using R
Use the ED 101 class survey data (ED101surveySP22.csv) to complete the following tasks. (7 pts)
- How many categorical variables are there in this survey?
- Open this dataset in Rstudio.
- Create a table for each of the categorical variables using the following code. Copy and paste the tables as well as your code into the word document that contains the other portions of this assignment.
table(gender)