Applied Biostats – BIOL3272 UMN – Fall 2022
2022-12-01
Preface
A book of (com)passion
In the summer of 2020, the world was on fire – COVID was raging, we – especially in Minnesota – were processing the murder of George Floyd and the subsequent uprising etc, the future was unclear. At that point teaching was likely to be entirely online, and I decided to write a digital book for my course see the first edition of my book here. I didn’t really know what I was doing or what my vision was (and to some extent I still do not). There were hiccups: some strangeness in rendering etc, typos, last minute updates, writing at 2am etc etc, but on the whole there were numerous advantages compared to a traditional textbook. I lay these out here:
- My class presentation and the textbook presentation almost always agreed.
- As I was writing and updating as I went the book could be rapidly updated / changed to reflect student needs / interests / timelines / current events etc.
- I could integrate practice problems / youtube links / and even additional readings pretty easily.
- It was free for students.
I think all of these benefits were great, and helped a lot, so I am did it again and updated the previous version for spring of 2022. We are now on the third edition for Fall of 2022 - and I’m hoping each version gets better and has fewer issues.
Why do I bring this up? Well I know you’re dealing with a lot. Every year students are dealing with a lot – from jobs, to supporting family, to the everyday of being in college and living life, and this year there’s even more. I too have a lot – A one year old sons and and three year old daughter, research and life pressures, teaching etc. Yet, we are all trying to make the most of life in this era. We want to teach, learn, and grow.
What’s more, I believe this content is more important now than it has ever been, statistics is obsessed with the critical evaluation of claims in the face of data, and is therefore particularly useful in uncertain times. Given this focus, and given that you all have different energies, motivations and backgrounds, I am restructuring this course slightly from previous years. The biggest change is a continued de-emphasis on math and programming – that doesn’t mean I’m eliminating these features, but rather that I am streamlining the required math and programming to what I believe are the essentials. For those who want more mathematical and/or computational details (either because you want to push yourself or you need this to make sense of things), I am including a bunch of optional content and support.
I LOVE TEACHING THIS COURSE – the content is very important to me. I also care deeply about you. I want to make sure you get all you can / all you need from this course, while recognizing the many challenges we are all facing. One tangible thing I leave you with is this book, which I hope you find useful as you go on in your life. Another thing I leave you with is my concern for your well-being and understanding – please contact me with any suggestions about the pace / content / you of this course and/or any life updates which may change how and when you can complete the work.
Course philosophy / goals
Hi! I’m a statistician. You might know me from my greatest hits including, “Have you tried plotting the data?”, “You’re not adequately powered to answer that question”, and “Correlation is not causation (except when it is 😉)” https://t.co/MpEHfqwHY8
— Lucy D’Agostino McGowan (@LucyStats) January 19, 2019
My motivating goal for this course is to empower you to produce, present, and critically evaluate statistical evidence — especially as applied to biological topics. You should know that stats models are only models and that models are imperfect abstractions of reality. You should be able to think about how a biological question could be formulated as a statistical question, present graphs which show how data speak to this question, be aware of any shortcomings of that model, and how statistical analysis of a data set can be brought back into our biological discussion.
“By the end of this course…
Students should be statistical thinkers. Students will recognize that data are comprised of observations that partially reflect chance sampling, & that a major goal of statistics is to incorporate this idea of chance into our interpretation of observations. Thinking this way can be challenging because it is a fundamentally new way to think about the world. Once this is mastered, much of the material follows naturally. Until then, it’s more confusing.
Students should think about probability quantitatively. That chance influences observations is CRITICAL to statistics (see above). Quantitatively translating these probabilities into distributions and associated statistical tests allows for mastery of the topic.
Students should recognize how bias can influence our results. Not only are results influenced by chance, but factors outside of our focus can also drive results. Identifying subtle biases and non-independence is key to conducting and interpreting statistics.
Students should become familiar with standard statistical tools / approaches and when to use them. Recognize how bias can influence our results. What is the difference between Bayesian and frequentist thinking? How can data be visualized effectively? What is the difference between statistical and real-world significance? How do we responsibly present/ interpret statistical results? We will grapple with & answer these questions over the term.
Students should have familiarity with foundational statistical values and concepts. Students will gain an intuitive feel for the meaning of stats words like variance, standard error, p-value, t-statistic, and F-statistic, and will be able to read and interpret graphs, and how to translate linear models into sentences.
Students should be able to conduct the entire process of data analysis in R. Students will be able to utilize the statistical language, R, to summarize, analyze, and combine data to make appropriate visualizations and to conduct appropriate statistical tests.
R, RStudio, and the tidyverse
](images/monster_support.jpeg)
FIGURE 0.1: This image comes with permissions from Allison Horst, who makes tremendous aRt. If you appreciate her work, she would appreciate your support for Data for Black Lives
We will be using R in this course, in the RStudio environment. My goal is to have you empowered to make figures, run analyses, and be well positioned for future work in R, with as much fun and as little pain as possible. RStudio is an environment and the tidyverse is a set of R packages that makes R’s powers more accessible without the need to learn a bunch of computer programming.
Some of you might have experience with R and some may not. Some of this experience might be in tidyverse or not. There will be ups and downs — the frustration of not understanding and/or it not working and the joy of small successes. Remember to be patient, forgiving and kind to yourself, your peers, and me. Ask for help from the internet, your friends, Brooke, and Yaniv.
We will using R version 4.2.1 or above, and tidyverse version 1.3.2 or above.
You can download these onto your computer (Make sure the R is version 4.2.1).
What is this ‘book’ and how will we use it?
This ‘book’ functions as an extensive syllabus and course notes. I will embed youtube videos, app-based demonstrations and class exercises. As noted above, there are some things I will include that will not be necessary for everyone, and I will clearly mark these sections.
I hope that this book provides clear and useful background for the course, and I advise you to regularly go through each book ‘chapter’ for the relevant week. Be sure you get familiar with the content BEFORE class.
Note that this ‘book’ is not the entirety of the course content, and is not an original piece of my own effort – in addition from lifting from a few other course online (with attribution), I also make heavy use of these texts:
The Analysis of Biological Data Third Edition (Whitlock and Schluter 2020): This is the official book of this course, and is a standard biostats textbook, with many useful resources available online. The writing is great, as are the examples. Most of my material originates here (although I occasionally do things a bit differently). This book is officially optional, but students consistently tell me that it is extremely helpful. So, I highly recommend buying it. You can get the newest edition here, but any edition will be pretty useful.
Calling Bullshit (Bergstrom and West 2020): This book is not technical, but points to the big picture concerns of statisticians. It is very practical and well written. I will occasionally assign readings from this book, and/or point you to videos on their website. All readings will be made available for you, but you might want to buy a physical copy.
Fundamentals of Data Visualization (Wilke 2019): This book is free online, and is very helpful for thinking about graphing data. In my view, graphing is among the most important skills in statistical reasoning, so I reference it regularly.
R for Data Science (Grolemund and Wickham 2018): This book is free online, and is very helpful for doing the sorts of things we do in R regularly. This is a great resource.
I will introduce other resources as we go.
How will this term work / look?
- Prep for ‘class’. This class is flipped with asynchronous content delivery and in person meetings.
- Be sure to look over the assigned readings and/or videos, and complete the short low-stakes homework BEFORE each course.
- During class time, I will address questions make announcements, and get you started on in-class work. Brooke & I will bounce around class to provide help and check-in.
- The help of your classmates and the environment they create is one of the best parts of this class. Help each other.
- In addition to low stakes work before and in class, there will be a few more intense assignments, some collaborative projects and a summative project as the term ends. There will be no ‘high-stakes’ in class timed tests.
0.1 Example mini-chapter: Types of Variables and Data
Learning goals: By the end of this example mini chapter you should be able to
- Distinguish between explanatory and response variables.
- Distinguish between data types.
- Continuous vs Categorical
- Differentiate between continuous and discrete continuous variable.
- Differentiate between nominal and ordinal categorical variables.
As we build and evaluate statistical models, a key consideration is the type of data and the process that generates these data. Variables are things which differ among individuals (or sampling units) of our study. So, for example, height, or eye color, or the type of fertilizer applied to a site, or the number of insect species per hectare are all variables.
0.1.1 Explanatory and Response variables
We often care to distinguish between explanatory variables, which we think underlie or are associated with the biological process of interest, from response variables, the outcome we aim to understand. This distinction helps us build and consider our statistical model and relate the results to our biological motivation.
The difference between an explanatory and response variable often depends on the motivation and/or study design. For example if we where interested to know if fertilizer type had an (?indirect?) impact on insect diversity, the type of fertilizer would be the explanatory variable and the number of insect species per hectare would be the response variable.
0.1.2 Types of Data
Data can come in different flavors. It is important to understand these, as they should direct our model building and data summaries, interpretation and data visualization.
0.1.2.1 Flavors of numeric variables.
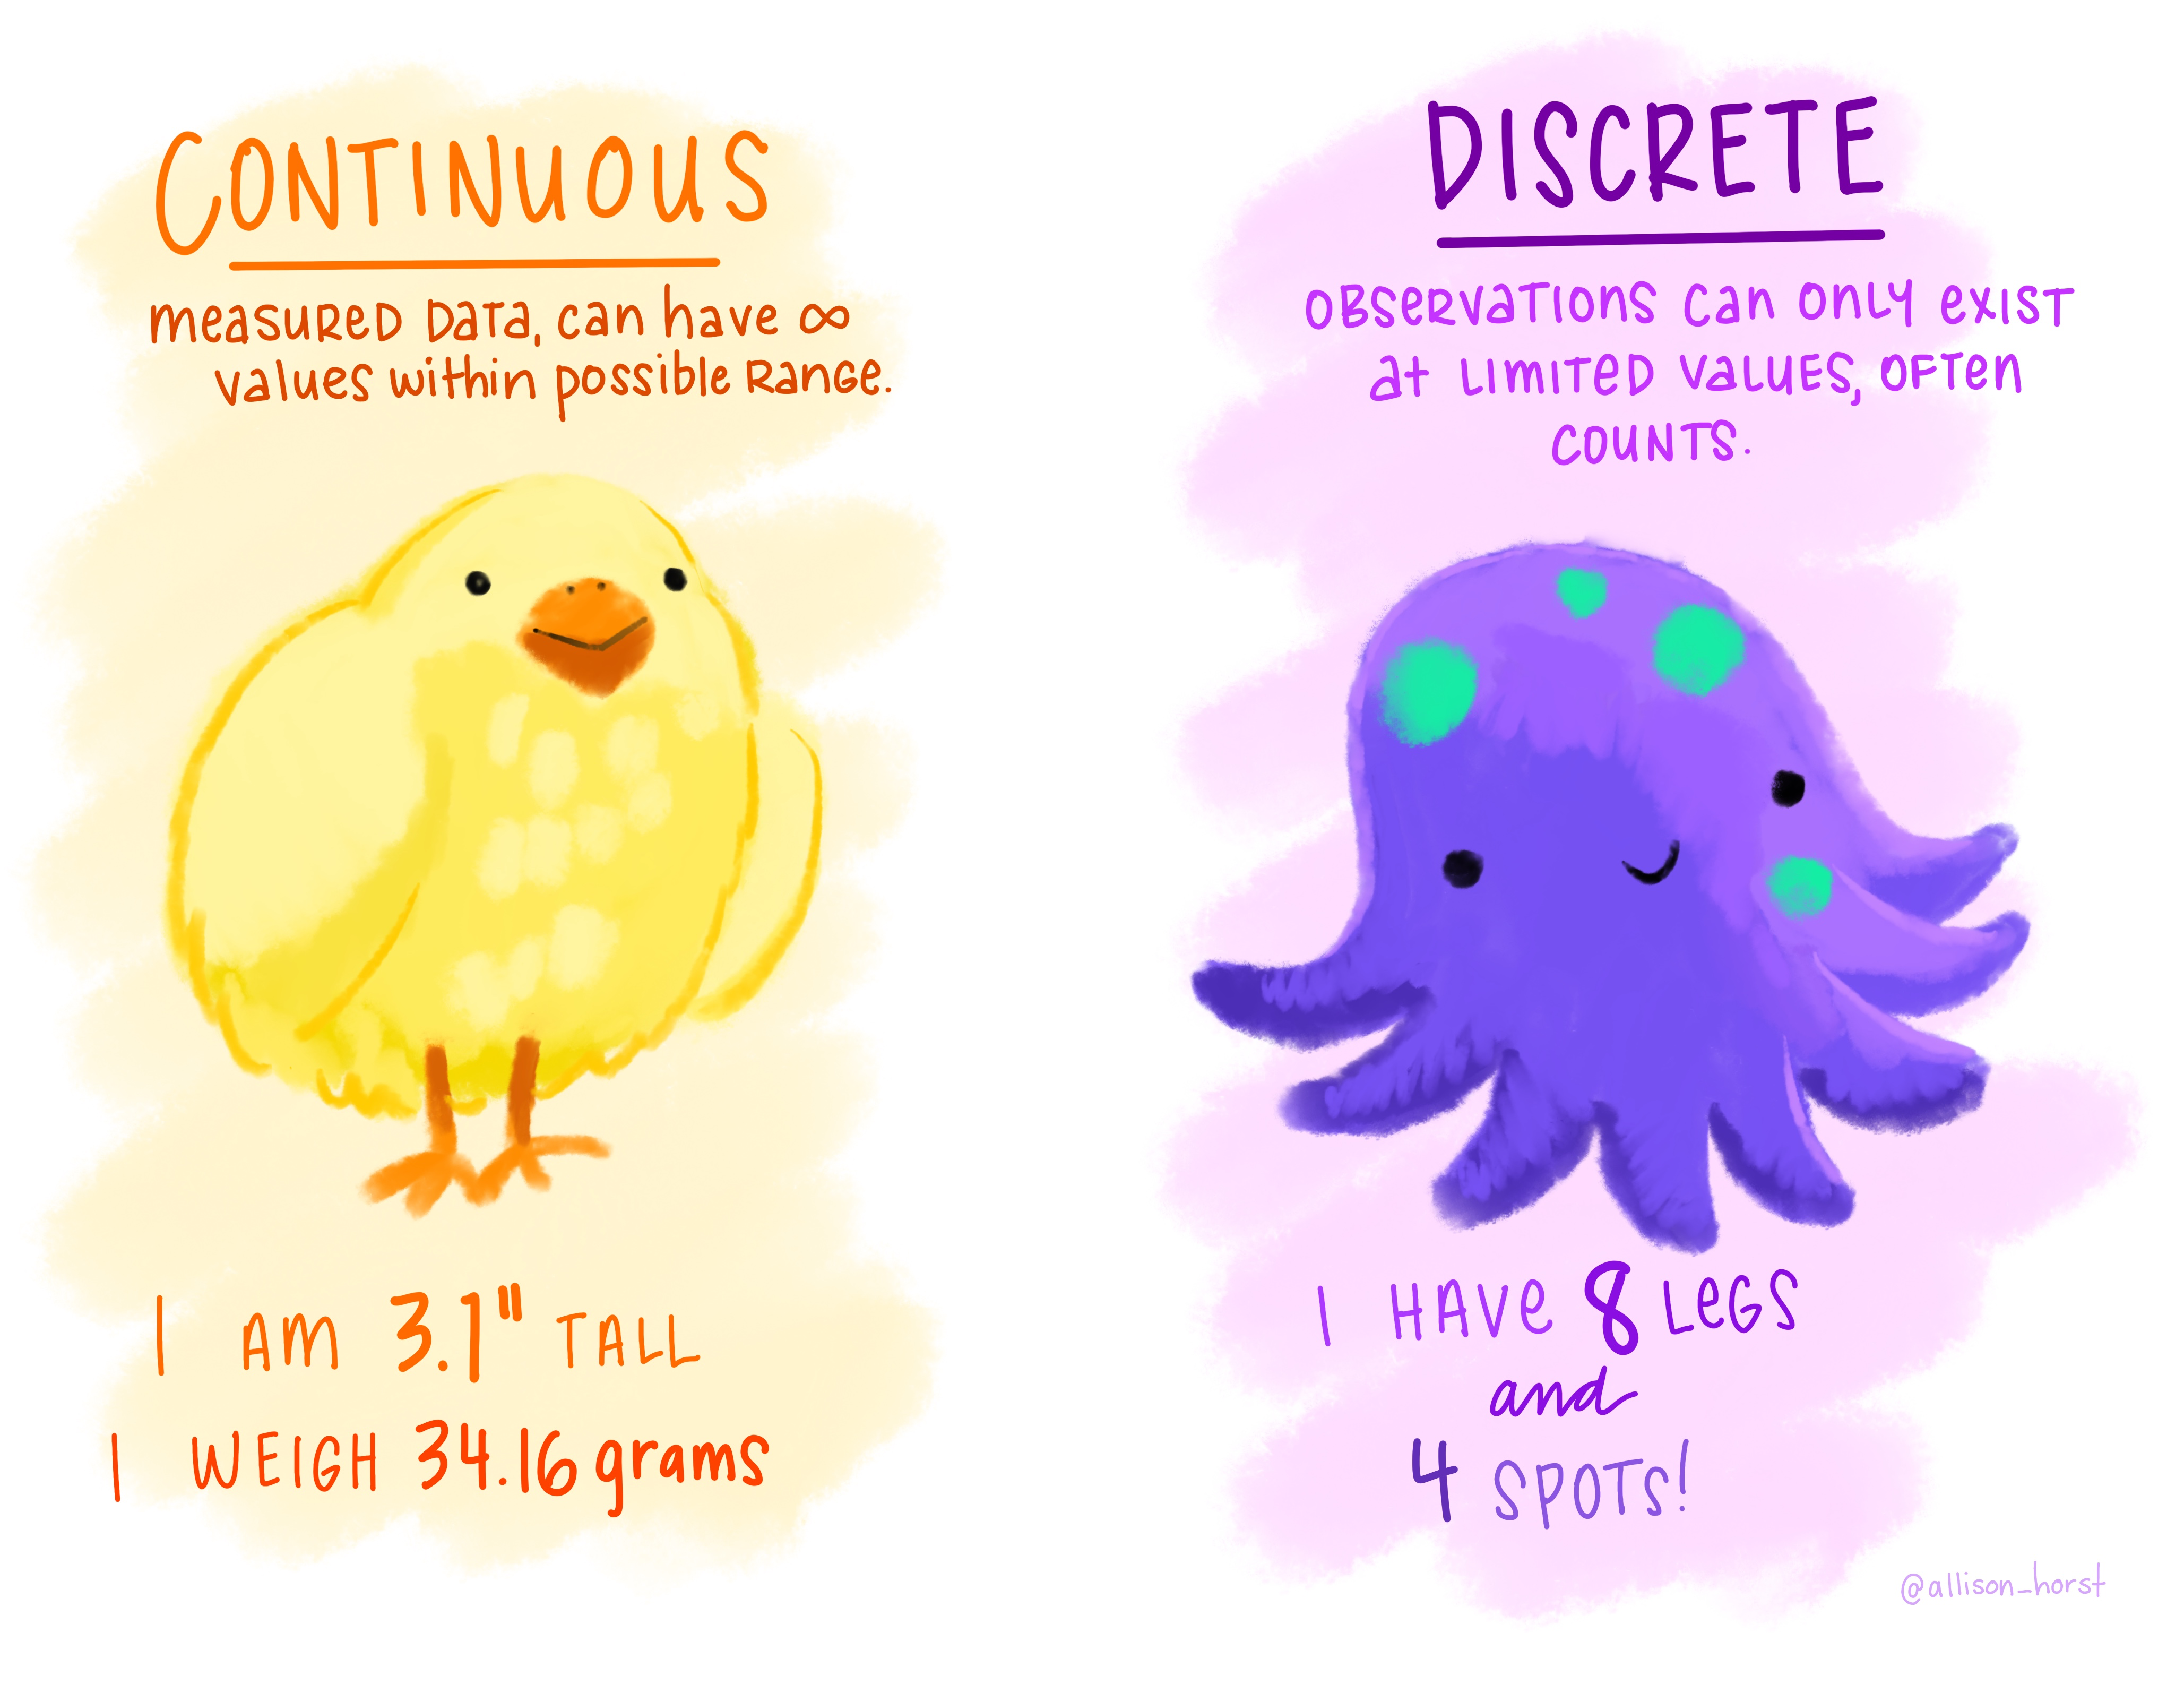
Numeric variables are quantitative and have magnitude, and come in a few sub-flavors. As we will see soon, these guide our modeling approaches:
- Discrete variables come in chunks. For example the number of individuals is an integer, we don’t have 1/2 people.
- Continuous variables can take any value within some reasonable range. For example, height, weight, temperature, etc. are classic continuous variables. Some variables are trickier – for example, age is continuous, but we often analyze it as if it’s discrete. In practice, these tricky cases rarely present a serious problem for our analyses (except in the rare cases in which they do).
Not all numbers are numeric. For example, gene ID is a number but it is an arbitrary marker and is not quantitative.
0.1.2.2 Flavors of categorical variables.
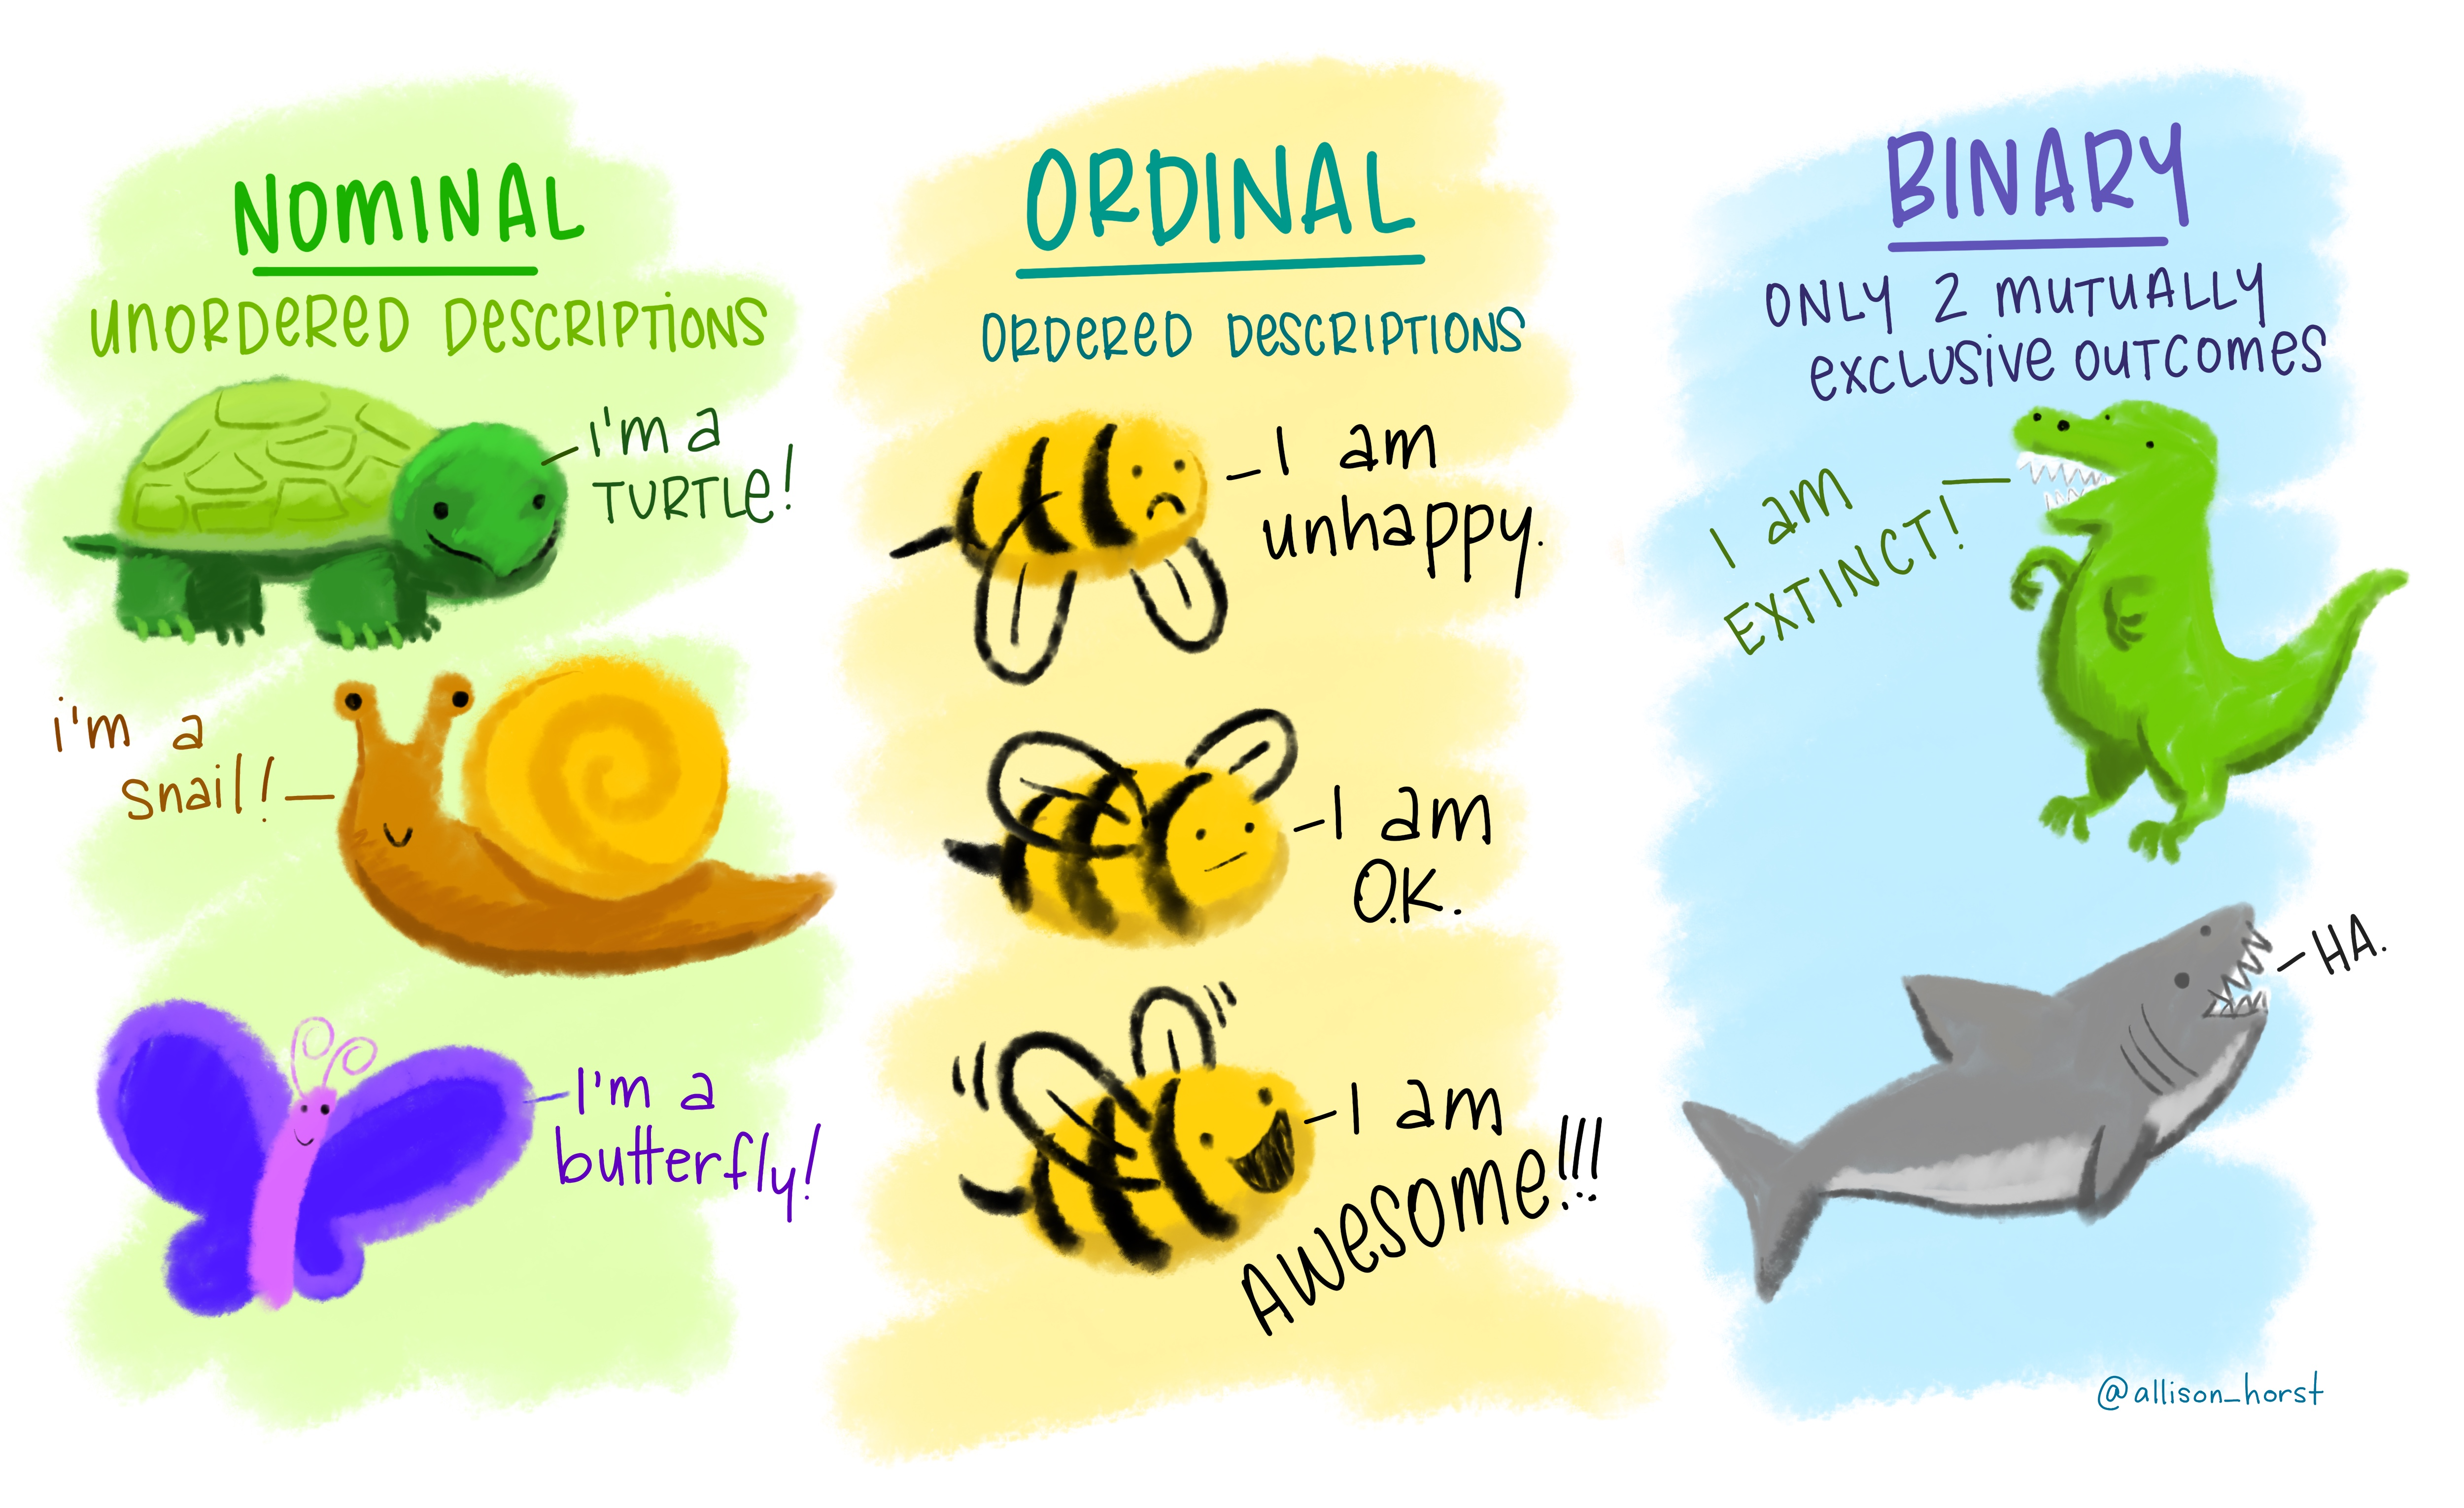
Categorical variables are qualitative, and include,
Nominal variables which cannot be ordered and have names – like sample ID, species, hair color etc…
Binary variables are special types of nominal variables, which have only two options (or for which we only consider two options. Alive/dead, pass/fail, on/off are classic binary variables).
Ordinal variables can be ordered, but do not correspond to a magnitude. For example, bronze, silver and gold medals in the Olympics are ranked from best to worst, but first isn’t some reliable distance away from second or third etc… .
0.1.3 Quiz
After completing this quiz (and ensuring you get everything right), fill out the quiz on canvas as today’s class Quiz.
0.1.4 Definitions
Explanatory variables are variables we think underlie or are associated with the biological process of interest.
Response variables are the outcome we aim to understand.
Numeric variables are quantitative – they can be assigned a meaningful value on the number line.