9 Introduction to Bayesian statistics
Upon completion of this module students should be able to:
- explain the idea of Bayesian statistics.
- compute conditional, marginal, prior and posterior distributions in the context of Bayesian statistics.
- compute conjugate distributions and identify hyperparameters for Bayesian situations.
9.1 Random parameters
So far, parameters used to describe model or populations have been fixed values. In some applications, though, the parameters themselves may be assumed to have distributions. This idea is best introduced using examples.
Example 9.1 (Exam scores) The score achieved by students on an exam is approximately normal with mean \(\theta\). The score achieved by any specific student \(X\) can be modelled with this normal distribution, using this mean \(\theta\). The mean \(\theta\) is not constant, but varies (due to the specific questions that appear on the exam, the amount of study completed by individual students, etc.), and follows an approximately normal distribution (with mean 60 and standard deviation 10).
Example 9.2 (Vehicle crashes) The number of motor vehicle crashes per day occur in a town vary according to a Poisson distribution with mean \(\theta\). The number of crashes on a specific day \(X\) can be modelled with this distribution, but the mean \(\theta\) is 10 per day when fine, and 20 per day when wet. About 10% of days are wet.
Example 9.3 (Goal kicking) The probability that a rugby league goal-kicker lands a goal is \(\theta\). This number of kicks landed \(X\) can be modelled using a binomial distribution with probability \(\theta\), but the probability of a successful kick \(\theta\) may vary (depending on the conditions, where the kick is taken from, who is taking the kick, and so on), such that \(\theta \sim \text{Beta}(4, 4)\).
In each of these examples, a distribution \(f_{X}(x; \theta)\) describes the data for some given value of \(\Theta\). However, the value of \(\Theta\) itself has a distribution, \(f_\Theta(\theta)\), so the actual distribution \(f_{X}(x; \theta)\) depends in which value of \(\Theta\) is realised. Hence, the distribution \(f_X(x; \theta)\) is effectively a conditional distribution \(f_{x|\Theta}(x \mid \Theta)\), and the parameter \(\Theta\) is effectively a random variable.
The marginal distribution of \(X\) (i.e., \(f_X(x)\)) can be found from Def. 6.6 if \(X\) and \(\Theta\) are continuous:
\[\begin{equation} f_X(x) = \int f_{X \mid \Theta}(x, \theta)f_\Theta(\theta)\,d\theta. \tag{9.1} \end{equation}\] For \(X\) and \(\Theta\) discrete, Def. 6.5 yields
\[\begin{equation} p_X(x) = \sum_\theta p_{X \mid \Theta}(x, \theta)p_\Theta(\theta). \tag{9.2} \end{equation}\] The mixed cases can be dealt with similarly:
\[\begin{equation} f_X(x) = \sum_\theta f_{X \mid \Theta}(x, \theta)p_\Theta(\theta) \tag{9.3} \end{equation}\] for \(X\) continuous and \(\Theta\) discrete, and
\[\begin{equation} p_X(x) = \int p_{X \mid \Theta}(x, \theta)f_\Theta(\theta)\,d\theta \tag{9.4} \end{equation}\] for \(X\) discrete and \(\Theta\) continuous.
Only in special cases will these marginal distributions have a standard distribution or closed form. The parameters that describe the distribution of the parameter \(\Theta\) are called hyperparameters.
Example 9.4 (Exam scores) (Follows Example 9.1.) The score \(X\) achieved by a student on an exam is normal with mean \(\Theta\) and standard deviation \(\sigma = 5\); that is, for some given value of \(\Theta\), we have \(X \sim N(\Theta, 5^2)\). The mean \(\Theta\) varies from student to student with a normal distribution, with two hyperparameters: the mean 60 and standard deviation 10; that is, \(\Theta \sim N(60, 10^2)\). From (9.1), the marginal pdf of \(X\) is \[\begin{align} f_X(x) &= \int f_{X \mid \Theta}(x, \theta)f_\Theta(\theta)\,d\theta\notag\\ &= \int_{-\infty}^\infty \frac{1}{5\sqrt{2\pi}} \exp\left[ -\frac{1}{2}\left(\frac{x - \theta}{5}\right)^2 \right] \frac{1}{10\sqrt{2\pi}} \exp\left[ -\frac{1}{2}\left(\frac{\theta - 60}{10}\right)^2 \right]\,d\theta\notag\\ &= \frac{1}{11.18\sqrt{2\pi}} \exp\left[-\frac{1}{2}\left(\frac{x - 60}{11.18}\right)^2\right] \tag{9.5} \end{align}\] after considerable algebra involving completing the square. Then, \(X\sim N(60, 11.18^2)\) (see Fig. 9.1, left panel; note that \(11.18 = \sqrt{5^2 + 10^2}\).)
This describes the distribution of \(X\), taking into account the various values of \(\Theta\) that are possible (as described by \(f_\Theta(\theta)\).)
Example 9.5 (Vehicle crashes) (Follows Example 9.2.) Let \(X\) be the number of motor vehicle crashes per day. Then \(X \sim \text{Pois}(\Theta)\) for some given value of \(\Theta\). However, the mean parameter \(\Theta\) has the distribution by \(\Pr(\Theta = 10) = 0.9\) and \(\Pr(\Theta = 20) = 0.1\), or \[ p_\Theta(\theta) = 0.1^{(\theta - 10)/10} 0.9^{(20 - \theta)/10}\quad\text{for $\theta = 10, 20$}. \] From (9.2), the marginal pf of \(X\) is \[\begin{align} p_X(x) &= \sum_\theta p_{X \mid \Theta}(x, \theta)p_\Theta(\theta)\notag\\ &= 0.9 \frac{e^{-10}10^x}{x!} + 0.1 \frac{e^{-20}{20^x}}{x!}\quad\text{for $x = 0, 1, 2, \dots$}. \tag{9.6} \end{align}\] See Fig. 9.1 (centre panel).
Example 9.6 (Goal kicking) (Follows Example 9.3.) Suppose the goal-kicker takes 10 kicks at goal in a match; the number of successful kicks \(X\) can be be modelled by the binomial distribution \(\text{Bin}(n = 10, p = \Theta)\), where the probability \(\Theta\) has a \(\text{Beta}(4, 4)\) distribution. From (9.4), the marginal pf of \(X\) is
\[\begin{align} p_X(x) &= \int p_{X \mid \Theta}(x, \theta)f_\Theta(\theta)\,d\theta\notag\\ &= \int_0^1 \binom{10}{x}\theta^x(1 - \theta)^{10 - x} \frac{\Gamma(8)}{\Gamma(4)\,\Gamma(4)} \theta^3(1 - \theta)^3\,d\theta\notag\\ &= \frac{\Gamma(8)}{\Gamma(4)\,\Gamma(4)}\binom{10}{x}\int_0^1 \theta^{x + 3}(1 - \theta)^{10 - x + 3}\,d\theta\notag\\ \end{align}\] where the integral can be simplified by seeing it is a Beta function with parameters \(x + 4\) and \(14 - x\), so that \(\int_0^1 \theta^{x + 3}(1 - \theta)^{10 - x + 3}\,d\theta = \Gamma(x - 4)\Gamma(14 - x)/\Gamma(18)\). Then: \[ p_X(x) = \frac{7!\, 10!\, (x + 3)!\, (13 - x)!}{3!^2\, 17!\, x!\, (10 - x)!}\quad\text{for $x = 0 , 1 , 2,\dots, 10$}. \tag{9.7} \] See Fig. 9.1 (right panel).
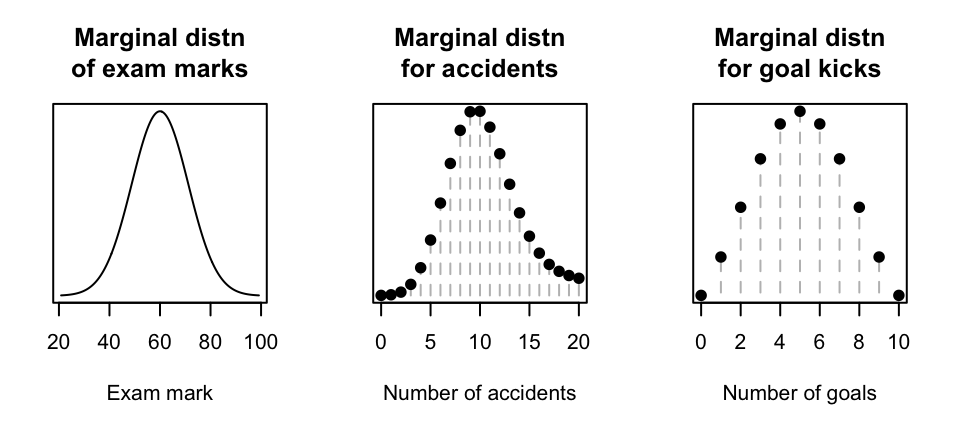
FIGURE 9.1: Marginal distributions
9.2 Bayes’ theorem revisited
Recall Bayes’ theorem in Sect. 1.10.6. Let \(E\) be an event, with \(H_1, \ldots, H_n\) a sequence of mutually exclusive and exhaustive events partitioning the sample space. Then
\[\begin{equation} \Pr(H_n \mid E ) = \frac{\Pr(H_n) \Pr(E \mid H_n) }{\Pr(E)} = \frac{\Pr(H_n) \Pr(E \mid H_n) }{\sum_m \Pr(H_m ) \Pr(E \mid H_m )} \end{equation}\] assuming that \(\Pr(E) \neq 0\). Bayes’ theorem extends to random variables.
Suppose that \(X\) and \(Y\) are discrete random variables, where \(p_Y(y)\) is the pf for \(Y\) and \(p_{X \mid Y}(x,y)\) is the conditional pmf for \(X\) given \(Y\). Then the conditional pmf of \(Y\) given \(X\) is
\[\begin{align} p_{Y \mid X}(y, x) &= \frac{p_{X, Y}(x, y)}{p_X(x)} \\ &= \frac{p_{X \mid Y}(x, y)p_Y(y)}{\sum_y p_{X \mid Y}(x, y)p_Y(y)}. \tag{9.8} \end{align}\]
In their most usual form, the above equations for the combinations of continuous and discrete random variables produce these results:
\[\begin{align} f_{Y \mid X}(y, x) &= \frac{f_{X, Y}(x, y)}{f_X(x)} = \frac{f_{X \mid Y}(x, y)f_Y(y)}{\int_y f_{X \mid Y}(x, y)f_Y(y)\,dy} = \frac{f_{X \mid Y}(x, y)f_Y(y)}{f_X(x)}; \tag{9.9}\\ p_{Y \mid X}(y, x) &= \frac{f_{X, Y}(x, y)}{p_X(x)} = \frac{f_{X \mid Y}(x, y)p_Y(y)}{\sum_y f_{X \mid Y}(x, y)p_Y(y)} = \frac{f_{X \mid Y}(x, y)p_Y(y)}{p_X(x)}; \tag{9.10}\\ f_{Y \mid X}(y, x) &= \frac{f_{X, Y}(x, y)}{p_X(x)} = \frac{p_{X \mid Y}(x, y)f_Y(y)}{\int_y p_{X \mid Y}(x, y)f_Y(y)\,dy} = \frac{p_{X \mid Y}(x, y)f_Y(y)}{p_X(x)}. \tag{9.11} \end{align}\]
In all cases (9.8) to (9.11), the left-hand side shows that the distribution is a function of \(y\), given the observed data \(X\). The denominator of the right-hand side is only a function of the observed data \(X\), and contains no unknowns (so is effectively a normalising constant whose value ensures that the expression is a valid probability function).
Because of this, sometimes these expressions in (9.8) to (9.11) are written as proportionalities rather than equalities by omitting the denominator (the normalising constant); also, write \(\Theta\) as the parameter of interest:
\[\begin{align*} f_{\Theta|X}(\theta \mid x) &\propto f_{X|\Theta}(x\mid \theta) \times f_\Theta(\theta)\\ \text{Posterior distn} &\propto \text{Sampling distn} \times \text{Prior distn}. \end{align*}\] Here:
- The prior distribution: This is the distribution of the parameter \(\Theta\) that is assumed before the data \(X\) are observed, perhaps based on past experience.
- The sampling distribution or the likelihood function: This describes the distribution from which the data are assumed to come.
- The posterior distribution: This describes the distribution of the parameter \(\Theta\), after the data \(X\) is observed.
The distribution for \(\Theta\) is assumed prior to seeing the data (i.e., \(f_\Theta(\theta)\)), and is then adjusted with the knowledge of the data \(X\) to produce the conditional (or posterior) distribution \(f_{\Theta|X}(\theta\mid x)\).
In this context:
- \(\Theta\) is a parameter of interest.
- The original, or unconditional distribution \(f_\Theta(\theta)\) models our prior beliefs about the parameter \(\theta\). This is called the prior distribution (modelling our beliefs about the parameter of the distribution prior to seeing the data).
- We then observe the data \(X\).
- Using this extra available information, the description of \(\theta\) is updated. This is the conditional distribution \(f_{\Theta \mid X}(\theta, x)\), called the posterior distribution in this context.
Example 9.7 (Exam scores) (Follows Examples 9.1 and 9.4.) The conditional pdf of the mean score \(\Theta\), given an observed exam score \(X = x\), follows directly from (9.9) on substituting (9.5):
\[\begin{align} f_{\Theta \mid X}(\theta, x) &= \frac{f_{X|\Theta}(x, \theta)f_\Theta(\theta)}{f_X(x)}\notag\\ &= \frac{\frac{1}{5\sqrt{2\pi}} \exp\left[ -\frac{1}{2}\left(\frac{x - \theta}{5}\right)^2 \right] \frac{1}{10\sqrt{2\pi}} \exp\left[ -\frac{1}{2}\left(\frac{\theta - 60}{10}\right)^2 \right]} {\frac{1}{11.18\sqrt{2\pi}} \exp\left[ -\frac{1}{2}\left(\frac{x - 60}{11.18}\right)^2 \right]}\notag\\ &=\frac{1}{4.472\sqrt{2\pi}} \exp\left[ -\frac{1}{2}\left(\frac{\theta - (0.8x + 12)}{4.472}\right)^2 \right] \tag{9.12} \end{align}\] after some algebraic manipulation; i.e., \(\Theta | (X = x)\sim N(0.8x + 12, 4.472^2)\).
This distribution derived above is for the mean score, given an observed value of \(x\). Thus we have:
- The initial (prior) distribution about the mean score (Example 9.4): \(\Theta \sim N(60, 10^2)\).
- After seeing an exam score \(x\), the adjusted (posterior) distribution of the mean score is \(\Theta\mid X\sim N(0.8x + 12, 4.472^2)\).
Consider the implications:
- If observed exam score is \(x = 60\) (i.e., equal to the prior belief about the mean), then there is no change to the prior mean: \(0.8\times 60 + 12 = 60\). That is, the mean of the prior distribution is 60, and the data don’t provide any evidence to change this, so the mean of the posterior distribution is also 60. Note, however, that the variance is smaller, as our confidence in that value of the parameter has increased.
- If observed exam score is less than \(60\) (e.g., \(x = 50\)), the original expectation is adjusted down from the original assumption of a mean of 60, since \(0.8\times 50 + 12 = 52\).
- If observed exam score is greater than \(60\) (e.g., \(x = 70\)), the original expectation is adjusted up from the original assumption of a mean of 60, since \(0.8\times 70 + 12 = 68\).
See Fig. 9.2. In other words, our prior belief of the mean score is adjusted in light of the observed evidence to produce the posterior distribution. The extra observations adds to the confidence of the estimate (i.e., reduced variance).
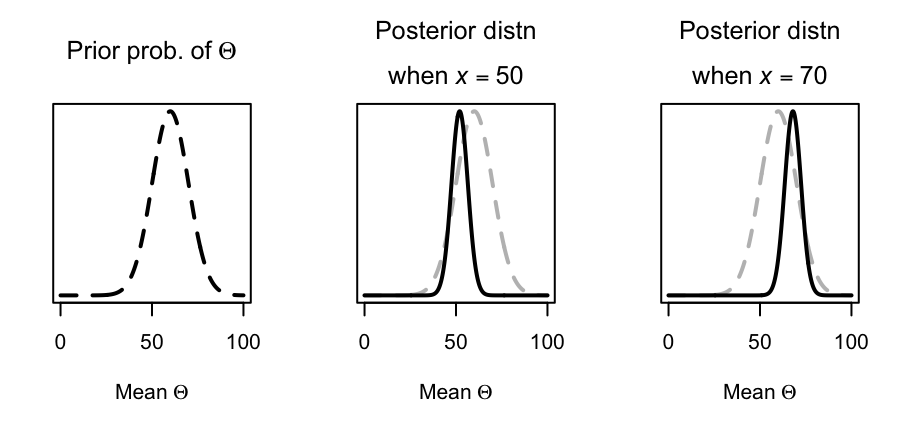
FIGURE 9.2: Exam scores: The prior distribution for the mean \(\Theta\) (left panel) and the posterior distribution when \(x = 50\) centre panel) and when \(x = 70\) (right panel). The dashed grey lines in the two right plots shows the prior distribution.
Example 9.8 (Vehicle crashes) (Follows Example 9.1 and 9.5.) From (9.6) and (9.9), the conditional pf of the mean number of accidents per day \(\Theta\) given \(X\) is \[\begin{align} p_{\Theta \mid X}(\theta, x) &= \frac{f_{X \mid \Theta}(x, \theta)f_\Theta(\theta)}{p_X(x)}\notag\\ &= \begin{cases} \displaystyle \frac{0.9\frac{e^{-10}10^x}{x!}} {0.9 \frac{e^{-10}10^x}{x!} + 0.1 \frac{e^{-20}{20^x}}{x!}} & \text{for $\theta = 10$}\\[6pt] \displaystyle \frac{0.1\frac{e^{-20}20^x}{x!}} {0.9 \frac{e^{-10}10^x}{x!}+ 0.1 \frac{e^{-20}{20^x}}{x!}} & \text{for $\theta = 20$}. \end{cases}\notag\\ &= \begin{cases} \displaystyle \frac{0.9 e^{-10}10^x} {0.9 e^{-10}10^x + 0.1 e^{-20}{20^x}} & \text{for $\theta = 10$}\\[6pt] \displaystyle \frac{0.1 e^{-20}20^x} {0.9 e^{-10}10^x + 0.1 e^{-20}{20^x}} & \text{for $\theta = 20$}. \tag{9.13} \end{cases} \end{align}\]
So the prior belief about \(\Theta\) is that \[ p_\Theta(\theta) = \begin{cases} 0.9 & \text{for $\theta = 10$ (i.e., fine)};\\ 0.1 & \text{for $\theta = 20$ (i.e, wet)}. \end{cases} \] After observing the number of crashes, the prior belief is adjusted accordingly to produce the posterior distribution (Eq. (9.13)); i.e.:
If we observe \(x = 8\) crashes, the prior belief is adjusted to \[ p_{\Theta\mid X}(\theta \mid X) = \begin{cases} 0.9987 & \text{for $\theta = 10$ (i.e., fine)};\\ 0.0013 & \text{for $\theta = 20$ (i.e., wet)}. \end{cases} \]
If we observe \(x = 17\) crashes, the prior belief is adjusted to \[ p_{\Theta|X}(m \mid \theta) = \begin{cases} 0.602 & \text{for $\theta = 10$ (i.e., fine)};\\ 0.398 & \text{for $\theta = 20$ (i.e., wet)}. \end{cases} \] See Fig. 9.3.
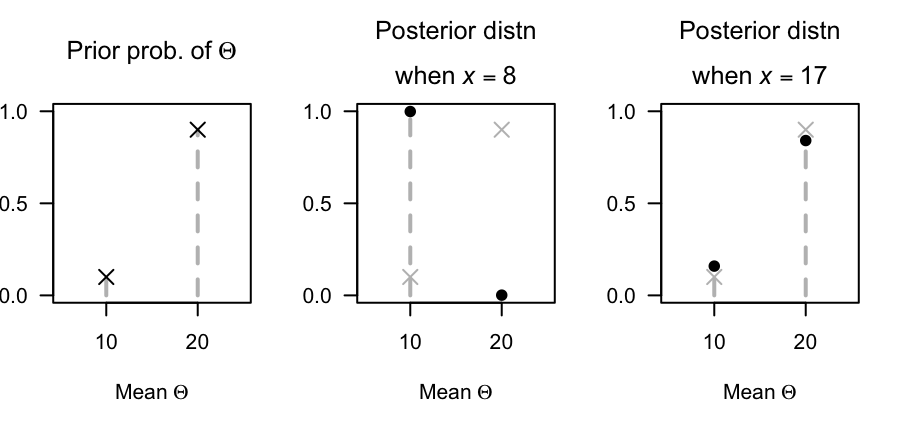
FIGURE 9.3: Vehicle crashes: The prior distribution for \(\Theta\) (left panel) and the posterior distribution when \(x = 8\) crashes (centre panel) and when \(x = 17\) crashes (right panel). The grey crosses in the two right plots shows the prior distribution.
Example 9.9 (Goal kicking) (Follows Example 9.3 and 9.6.) From (9.4), the conditional pdf of \(\Theta\) given \(X\) is \[ f_{\Theta \mid X}(\theta, x) = \frac{p_{X \mid \Theta}(x, \theta) f_\Theta(\theta)}{p_X(x)} \] where \(X \mid \theta \sim \text{Bin}(n = 10, p = \theta)\) so that \[ p(X \mid\Theta) = \binom{10}{x}\theta^x (1 - \theta)^{10 - x}, \] and where \(p_X(x)\) is given in (9.7), and \(\Theta \sim \text{Beta}(4, 4)\). Putting the pieces together: \[\begin{align} f_{\Theta \mid X}(\theta, x) &= \frac{ \binom{10}{x}\theta^x (1 - \theta)^{10 - x} \frac{\Gamma(8)}{\Gamma(4)\Gamma(4)} \theta^3 (1 - \theta)^3} {\frac{7!\, 10!\, (x + 3)!\, (13 - x)!}{3!^2\, 17!\, x!\, (10 - x)!} } \\ &= \frac{17!\theta^{x + 3} (1 - \theta)^{13 - x}}{(x + 3)! (13 - x)!} \tag{9.14} \end{align}\] which corresponds to a posterior distribution for \(\Theta\) of \(\text{Beta}(4 + x, 14 - x)\). In contrast, the prior distribution for \(\Theta\) was \(\text{Beta}(4, 4)\).
After observing the 10 kicks, the prior belief is adjusted accordingly:
- If the number of kicks made is \(5/10 = 0.5\), the prior belief is adjusted to \(\text{Beta}(9, 9)\), but the mean remains as \(9/(9 + 9) = 0.5\);
- If the number of kicks made is \(8/10 = 0.8\), the prior belief is adjusted upwards; \(\text{Beta}(12, 6)\) where the mean becomes \(12/(12 + 6) = 0.67\);
- If the number of kicks made is \(1/10 = 0.1\), the prior belief is adjusted downwards: \(\text{Beta}(5, 13)\) where the mean becomes \(5/(5 + 13) = 0.28\).
See Fig. 9.4.
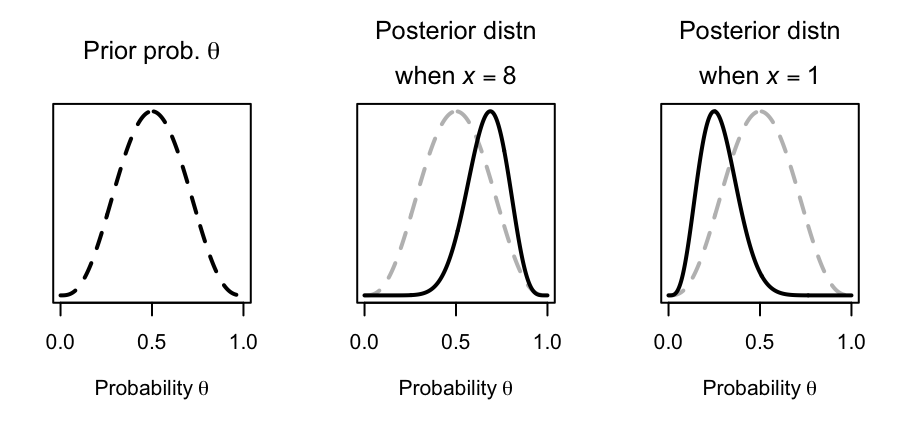
FIGURE 9.4: Goal kicking: The prior distribution for \(\theta\) (left panel) and the posterior distribution when \(x = 8\) (i.e., lands 8 kicks out of 10; centre panel) and when \(x = 1\) (i.e., lands 1 kick out of 10; right panel). The grey vertical lines correspond to the distribution means. The dashed grey lines in the two right plots show the prior distribution.
Applying meaning to the conditional distribution of parameters, such as those in (9.12), (9.13) and (9.14), has historically been controversial in statistics. However, the idea of modifying a parameter of a distribution based on new information has proven constructive, and is the basis of an important branch of statistics called Bayesian statistics.
The algebra involved in deriving posterior distributions is, except in special cases (Table 9.1), intractable and so numerical methods are necessary (including simulation techniques). If the prior and posterior distributions are the same type of distribution (e.g., both normal distribution), they are called conjugate distributions. The prior and posterior distribution combinations in 9.1) and conjugate distributions.
| distribution \(f(X\mid\Theta)\) | distribution \(f(\Theta)\) | distribution \(f(\Theta\mid X\)) |
|---|---|---|
| \(X \sim \text{Bin}(m, p)\) | \(p \sim \text{Beta}(a, b)\) | \(p \mid X \sim \text{Beta}(a + \sum x, b + mn - \sum x)\) |
| \(X \sim \text{Gam}(\alpha, \beta)\) | \(\beta \sim \text{Gam}(\alpha_0, \beta_0)\) | \(\beta \mid X \sim \text{Gam}(\alpha_0 + n\alpha, \beta_0 + \sum x)\) |
| \(X \sim \text{Pois}(\lambda)\) | \(\lambda \sim \text{Gam}(\alpha_0, \beta_0)\) | \(\lambda \mid X \sim \text{Gam}(\alpha_0 + \sum x, \beta_0 + n)\) |
| \(X \sim N(\mu, \sigma^2)\) | \(\mu \sim N(\mu_0, \sigma^2_0)\) | \(\mu \mid X \sim N(\mu_P, \sigma_P^2)\) |
| where \(\mu_P = \displaystyle \frac{1}{1/\sigma_0^2 + n/\sigma^{2}} \left(\frac{\mu _0}{\sigma _0^2} + \frac{\sum_{i = 1}^n x_{i}}{\sigma^2}\right)\) | ||
| and \(\sigma_P^2 = \left( \frac{1}{\sigma_0^2} + \frac{n}{\sigma^2} \right)^{-1}\) |
9.3 Exercises
Selected answers appear in Sect. D.9.
Exercise 9.1 In studies of human reproduction (Paul 2005), the number of menstrual cycles until pregnancy is denoted \(Y\), where \(Y\) is often modelled using a geometric distribution: \(Y\sim \text{Geom}(\theta)\), where \(\theta\) is the pre-cycle conception probability. \(\theta\) is usually considered constant for each couple, but can vary between couples with a beta distribution: \(\theta\sim \text{Beta}(m, n)\).
- Determine the posterior probability \(f(\theta\mid y)\), and identify the distribution in terms of known distributions (including parameters). (The normalising constant is not needed.)
- Determine the prior probability \(\theta\) if \(m = 1.2\) and \(n = 2\), and hence the expected number of cycles till pregnancy.
- Determine the posterior probability \(\theta\) if \(m = 1.2\) and \(n = 2\), and a couple takes three cycles to fall pregnant.