Chapter 6 Wrangling Rows in R with Filter
In this chapter, we will introduce you ways to wrangle rows in R. You will often want to focus your analysis on particular observations, or rows, in your dataset. This chapter will show you how to include the rows you want, and exclude the rows you don’t want. The main function in the tidyverse for doing this is filter(). The filter() function uses logical statements, or conditions, to decide whether to keep or exclude rows in your dataset.
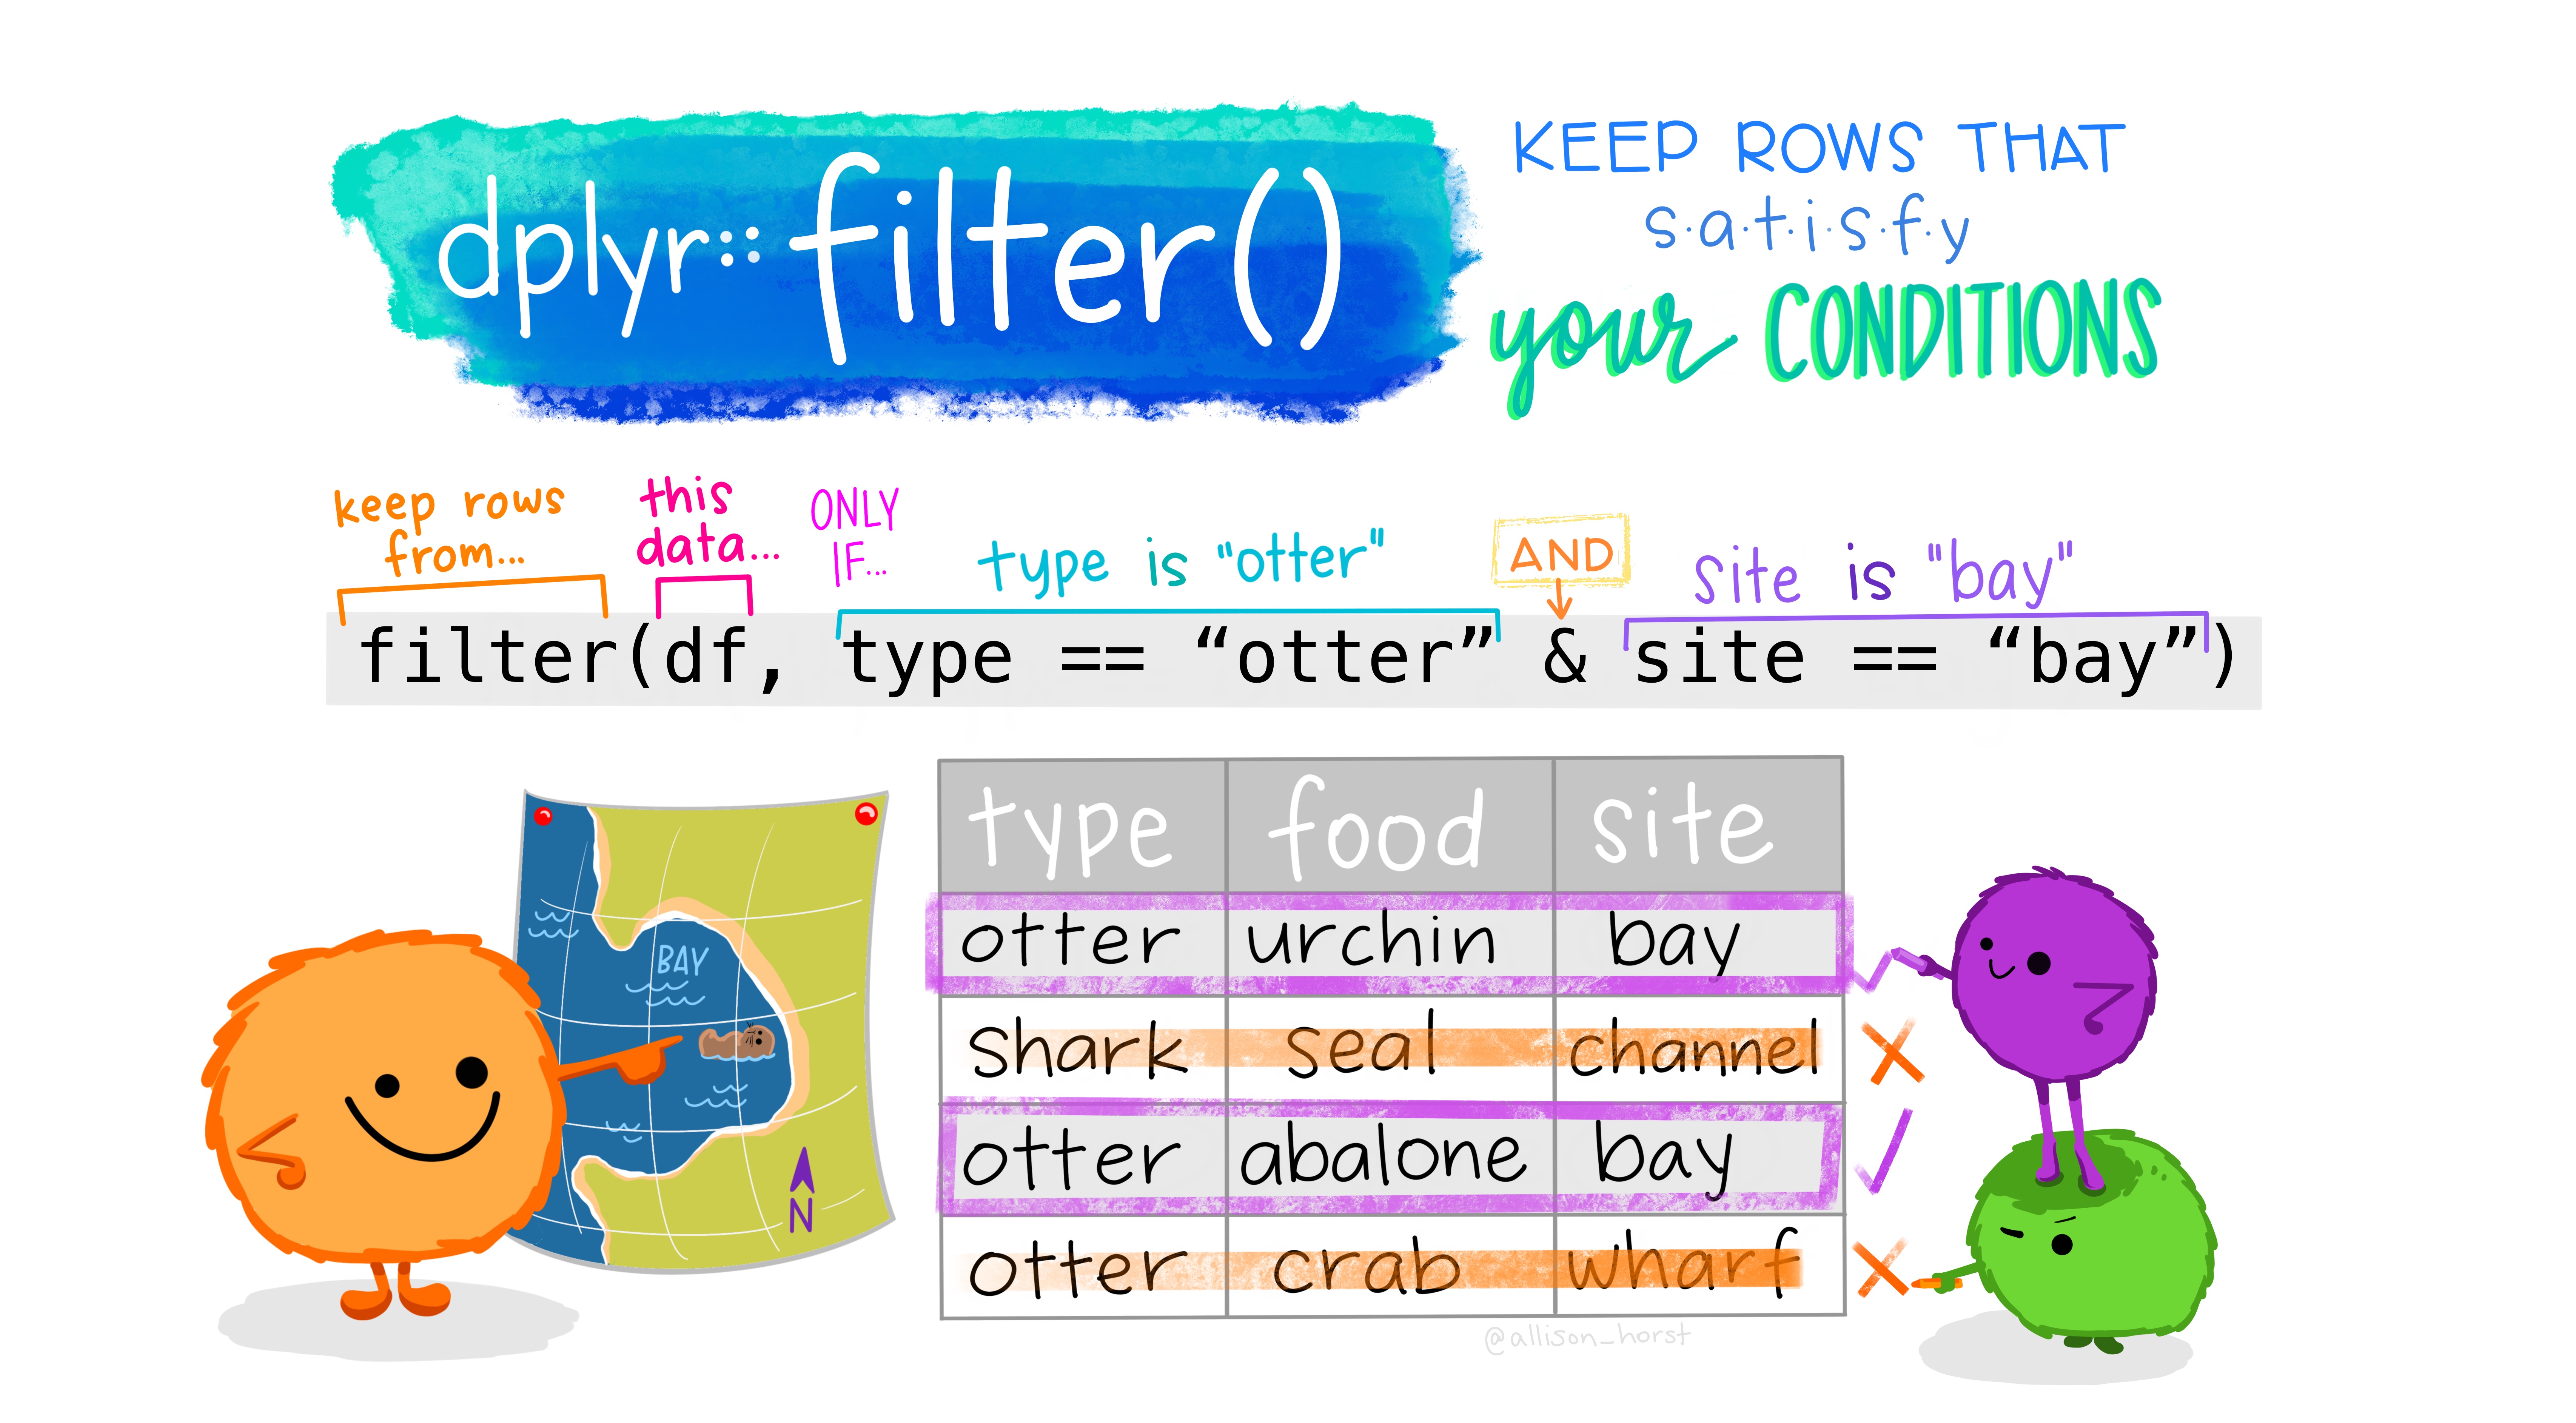
Figure 6.1: Artwork by Allison Horst, https://www.allisonhorst.com
6.1 Goals for this Chapter
- Understand logical statements
- Filter rows based on numeric values
- Filter rows based on string values and regex
- Filter rows based on dates
- Combine filters with boolean logic symbols, like AND (&) and OR(|)
- Filter on missing (NA) values
- Filter rows for duplicates/distinct observations
- Slicing rows based on row number/position
- Sampling rows as random samples
6.3 Pathway for this Chapter
This Chapter is part of the DATA WRANGLING pathway. Chapters in this pathway include
- What is Tidy Data?
- Filtering Rows
- Counting, Grouping, and Summarizing Rows
- Arranging and Ranking Rows
- Selecting Columns
- Mutating to Make New Variables
- Rearranging Untidy data with {tidyr} and {pivotr}
6.4 Logical Statements in R
Logical statements in R are important for defining something that is TRUE or FALSE for each row, or observation, in your data. A typical logical statement involves a variable, and some criteria to test each observation of that variable, resulting in a TRUE or FALSE for each row. Typical examples of logical statements include:
sbp > 140troponin_i > 9.0creatinine >= 2.5gfr <= 60Each of these examples tests each row in the database with the stated criterion, and results in a vector of TRUE or FALSE values for each row (observation) of the variable in the logical statement. The filter() function will act on these TRUE and FALSE values to include (TRUE) or exclude (FALSE) the observations from the result.
6.5 Filtering on Numbers - Starting with A Flipbook
This flipbook will show you step-by-step examples of how to filter rows of observations based on logical statements involving numbers. In each logical statement, a variable will be compared with a numeric value via a mathematical operator. These operators can include comparisons with
greater than (>)
greater than or equal to (>=)
less than (<)
less than or equal to (<=)
equal to (==) notice two equals signs to test equality
near() - an equality test that works with tiny decimal differences
The general format for filter statements is:
filter(variable [comparison operator] value), like
filter(sbp > 140) will keep only rows with systolic blood pressure values greater than 140.
If you have not used a flipbook before, you can click on the frame below to activate it, then use the right and left arrow keys to move forward and back through the examples.
With each forward step in the code on the left, examine the resulting output on the right. Make sure you understand how the output was produced.
In many of the examples, a select() function is used to reduce the number of columns before the filter() step to make the results more clear.
You saw several examples of filtering, including
| Example | Code |
|---|---|
| equality to a value | filter(recurrence == 1) |
| greater than a value | filter(preop_psa > 20) |
| near a value | filter(near(preop_psa, 10)) |
| near a value with a set tolerance | filter(near(preop_psa, 17, tol = 1.5)) |
| between 2 values | filter(between(preop_psa, 10, 13)) |
| in a list of values | filter(preop_psa %in% c(10,13,17)) |
6.5.1 Your Turn - learnr exercises
Try this out yourself, with interactive coding exercises below, written with the {learnr} package.
For each exercise, you can type in the code required,by the
instructions, then click on the blue Run Code button at the top right
of the exercise to test your code. Watch out for a red x in the left
margin - that identifies a coding error - hover over it for an
explanation of what is wrong. If you get stuck, you can click on the
Hint button to get a hint, and if needed, the Copy Clipboard button to
copy the hint so that you can paste it into the Exercise box.
6.6 Filtering on Multiple Criteria with Boolean Logic
You can use multiple filters on your data, and combine these with the boolean symbols
AND (symbol &)
OR (symbol | ) - the vertical line, often on the keyboard above the backslash character ( \ )
XOR - exclusive OR, so that the whole logical statement is true if either statement A is true, or statement B is true, but NOT if both are true. parentheses and combinations thereof.
NEGATION - an exclamation point ( ! ) placed before an equals sign or a variable in a logical statement makes it mean the opposite.
and you can use parentheses as well, to control the order of operations.
You saw several examples of filtering, including
| Example | Code |
|---|---|
| AND | filter(age > 65 & t_vol>1) |
| OR | filter(age > 69 | t_vol > 1) |
| exclusive OR (XOR) | filter(xor(age > 69, t_vol > 1)) |
| AND with negation (!) | filter(age > 64 & aa != 1) |
6.6.1 Your Turn - learnr exercises
Try this out yourself, with interactive coding exercises below, written with the {learnr} package.
For each exercise, you can type in the code required,by the
instructions, then click on the blue Run Code button at the top right
of the exercise to test your code. Watch out for a red x in the left
margin - that identifies a coding error - hover over it for an
explanation of what is wrong. If you get stuck, you can click on the
Hint button to get a hint, and if needed, the Copy Clipboard button to
copy the hint so that you can paste it into the Exercise box.
6.7 Filtering Strings
You can use == to test exact equality of strings, but you can also use str_detect from the {stringr} package for more flexible matching, and combine it with the magic of regex (regex ~ Regular expressions) to do complicated filtering on character string variables in datasets.
The typical formats for string filtering are
filter(variable == “string”) for an exact match, or
filter(str_detect(variable, pattern = “string”)) [note two parentheses at the end to completely close the parentheses with str_detect]
You saw several examples of filtering strings, including
| Example | Code |
|---|---|
| matches “oma” | filter(str_detect(diagnosis, “oma”)) |
| negated match | filter(!str_detect(diagnosis, pattern = “Hodgkin”)) |
| regex for wild card | filter(str_detect(diagnosis, pattern = “lympho.+ic”)) |
| regex wild card | filter(str_detect(diagnosis, “myelo.*”)) |
| exact match | filter(diagnosis == “myelofibrosis”) |
6.7.1 Your Turn - learnr exercises
Try matching strings yourself, in the interactive coding exercises below, written with the {learnr} package.
For each exercise, you can type in the code required,by the
instructions, then click on the blue Run Code button at the top right
of the exercise to test your code. Watch out for a red x in the left
margin - that identifies a coding error - hover over it for an
explanation of what is wrong. If you get stuck, you can click on the
Hint button to get a hint, and if needed, the Copy Clipboard button to
copy the hint so that you can paste it into the Exercise box.
6.8 Filtering Dates
You can use the {lubridate} package to format strings for logical tests, and filter your observations by date, month, year, etc. Dates are commonly formatted in ISO 8601 format, or YYYY-MM-DD, for 4-digit year, 2-digit month, and 2-digit day. The {lubridate} package can convert these to dates if the ymd() function is applied to a string formatted this way.
The typical formats for date filtering are
filter(date == ymd(“2002-10-06”)) for an exact match, or
filter(between(datevar, ymd(“2020-01-01”, ymd(“2020-06-30”))
filter(datevar > today() - years(1)) for the past year
<<<<<<< Updated upstream
You saw several examples of filtering dates, including
| Example | Code |
|---|---|
| between 2 dates | filter(between(fake_date, ymd(“2020-03-01”), ymd(“2020-03-31”) |
| 24 months prior to today | filter(fake_agvhd_date > today() - months(24)) |
| filter to weekdays 1 or 7 (weekend) | filter(wday(fake_bmt_date) %in% c(1,7)) |
6.8.1 Your Turn - learnr exercises
Try matching dates yourself, in the interactive coding exercises below, written with the {learnr} package.
For each exercise, you can type in the code required,by the
instructions, then click on the blue Run Code button at the top right
of the exercise to test your code. Watch out for a red x in the left
margin - that identifies a coding error - hover over it for an
explanation of what is wrong. If you get stuck, you can click on the
Hint button to get a hint, and if needed, the Copy Clipboard button to
copy the hint so that you can paste it into the Exercise box.
6.9 Filtering Out or Identifying Missing Data
You can use the is.na(), drop_na() and negation with ! to help identify and filter out (or in) the missing data, or observations that are incomplete. Common formats for this include
is.na(variable) - filters for observations where the variable is missing
!is.na(variable) - filters for observations where the variable is not missing
janitor::remove_empty(“rows”) - removes completely empty rows (helpful if you are importing a messy dataset)
drop_na() - without filter, this drops any observations with at least one NA value in the row.
drop_na(variable1, variable2) - without filter, this drops any observations with at least one NA value iin the variable1 or variable2 columns.
6.9.1 Working with Missing data
A common need when doing DEV (Data Exploration and Validation) is to find your missing datapoints, so that you can figure out why they are missing, and whether you can fix this using other records, including the medical record.
Another common scenario, when you can’t find or fix missing data, is that you want to drop observations which are missing in a particular variable.
Sometimes you will need to drop whole empty rows, which usually happens because of poor formatting of the data (often in a spreadsheet).
Sometimes you will need to drop observations that have missing data in any field, which is important in modeling. Linear and logistic models generally only run on complete cases, where all predictors and outcomes are non-missing.
You can also impute missing data points, if there are not too many (<10%), and these are truly missing completely at random (MCAR), which is often not the case. Usually there is a bias, so that particular types of study participants have more missing data than others. The packages {missForest} and {mice} can be helpful for imputation when MCAR assumptions are met. Imputation is beyond the scope of this chapter, and should generally be done in consultation with a statistician, as the assumptions involved are very important.
You saw several examples of filtering missing data, including
| Example | Code |
|---|---|
| filtering for the missing observations in a variable | fi lter(is.na(fake_date)) |
| filter for the non-missing data in a variable | filter (!is.na(fake_dx_date)) |
| removing empty rows | remove_empty(“rows”) |
| removing incomplete cases | drop_na() |
6.10 Filtering Out Duplicate observations
You can use the distinct() function and the {janitor} package to help you find duplicated observations/rows for fixing or removal from your dataset.
Common formats for this include
distinct(dataset) - filters for rows that are distinct from all the other rows (non-duplicates).
janitor::get_dupes(dataset) - filters for observations that are duplicated in all variables, counts them, and displays them in duplicated groups.
You saw several examples of filtering duplicate data, including
| Example | Code |
|---|---|
| distinct observations | distinct(dataset) |
| finding duplicates | get_dupes(dataset) |
| making the complementary dataset | dataset_whole %>% anti_join(data_subset) |
6.11 Slicing Data by Row
You can use the slice() family of functions to cut out a chunk of your observations/rows by position in the dataset..
Common formats for this include
slice(X:Y) - filters for rows X to Y by position (row number).
slice_max(variable, n = N) - filters for observations with the maximum N values for a single variable.
slice_min(variable, prop = 0.0N) - filters for observations with the minimum proportion of 0.0N values for a single variable.
slice_head and slice_tail - filter for observations by position in the top (or bottom) N or top/bottom proportion.
You saw several examples of slicing data, including
| Example | Code |
|---|---|
| slice by position | slice(100:200) |
| slice by top values in variable | slice_max(age, n=20) |
| slice by bottom values in variable | slice_min(pan_day, prop = 0.01) |
| slice by top or bottom position | slice_tail(prop = 0.01) |
6.12 Randomly Sampling Your Rows
You can use the slice_sample() function to take a random subset of large datasets, or to build randomly selected training and testing sets fo modeling.
Common formats for this include
slice_sample(prop = 0.N) - randomly samples N % of your rows.
slice_sample(n = N) - randomly samples N of your rows.
You saw several examples of sampling data, including
| Example | Code |
|---|---|
| sampling a proportion | slice_sample(prop = 0.3) |
| sampling N rows | slice_sample(n = 50) |
6.13 Further Challenges
Try filtering on your own computer.
Install R and Rstudio, as in Chapter 2.
Then make sure you have the following packages installed, as in the Installing Packages chapter:
tidyverse
medicaldata
Read in data from the medicaldata datasets with data(name)
Then try some of the following challenges
filter the cytomegalovirus dataset for rows with time to acute gvhd < 6 months and CD3 dose > 4
filter the opt dataset for Birthweight between 2500 grams and 3500 grams, or Apgar >=6
filter the covid_testing dataset for females tested in the first 30 days of the pandemic with positive results
6.14 Explore More about Filtering
Some helpful resources include:
Suzan Baert’s blog series on dplyr, part 3 about filtering is found here.
The tidyverse guide to filtering, found here.
A blog post on filtering by Michael Toth, found here.
The RYouWithMe series from RLadiesSyndey post on filtering here.