Chapter 7 Quantile-Quantile Plot

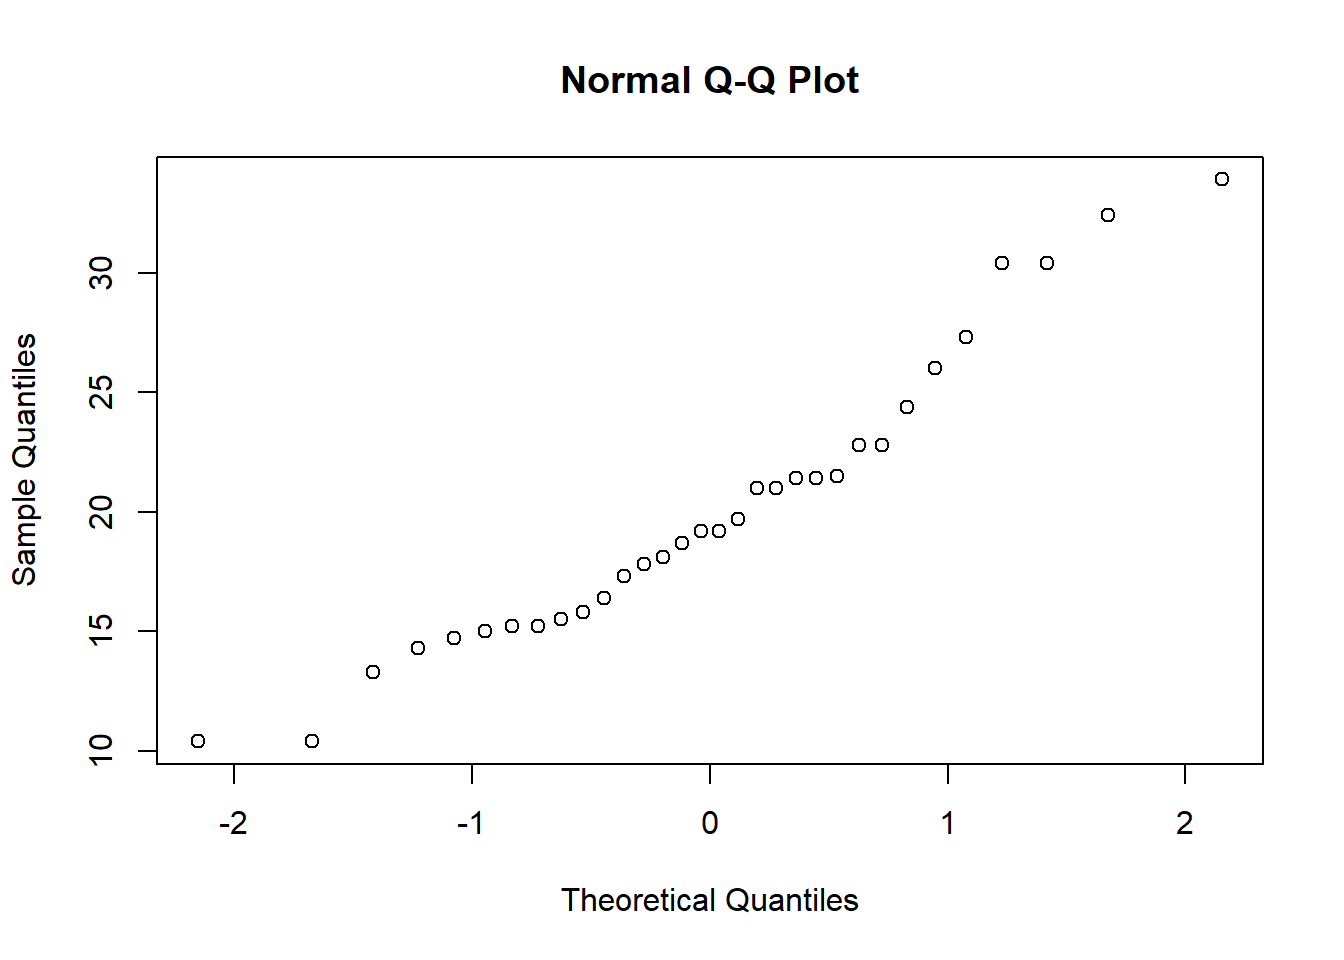
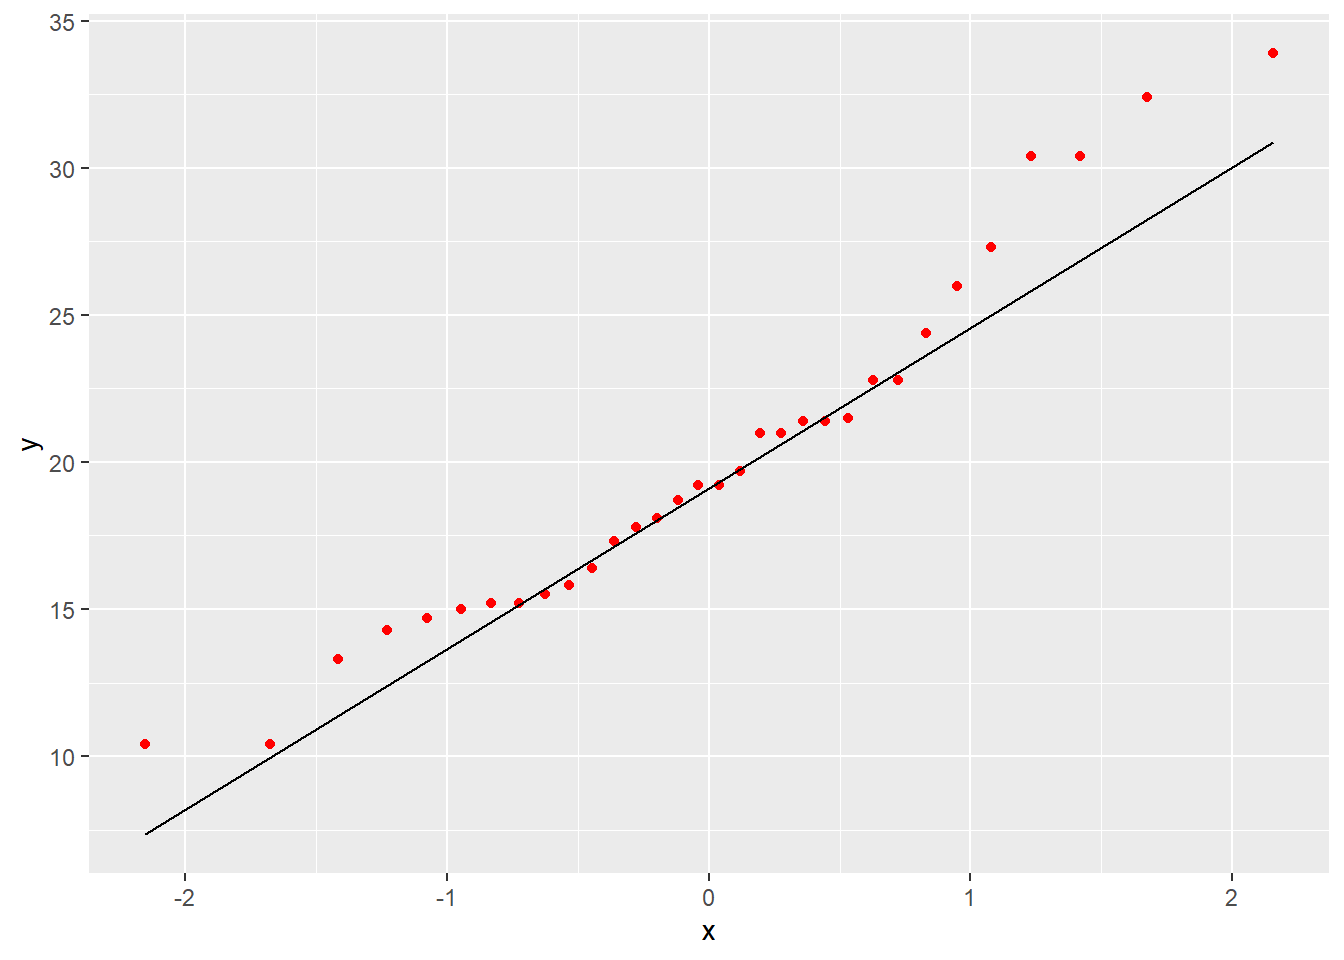
The quantile-quantile (q-q) plot is a graphical technique for determining whether the variable of interest follows the normal distribution or not.

7.1 How to draw a QQ Plot in base R?

qqnorm(mtcars$mpg) #a simple qqplot in R

7.2 How can we draw QQ Plot in ggplot2?

qplot(sample = mpg, data = mtcars)

ggplot(mtcars, aes(sample=mpg))+stat_qq()

This way is the better one.

ggplot(mtcars, aes(sample=mpg))+stat_qq(col="red") #with red color

7.3 Adding QQ Line to Plot

ggplot(mtcars, aes(sample=mpg))+stat_qq(col="red")+ stat_qq_line()

7.4 Change QQ-plot colors by groups

ggplot(mtcars) +stat_qq(aes(sample = mpg, colour = factor(cyl)))