Chapter 11 Dumbell Plot
Dumbell plot, or Dumbell Chart, is an efficient tool to display the change of the variable between two different time points, two conditions or the differences between two groups.
Rather than the most of the ggplot objects, you should manipulate your dataset to make a dumbell plot. In addition to ggplot2, we also use ggalt package for it.
Consider uspopchange data from gcookbook package.
uspopchange <- gcookbook::uspopchangemin_change = aggregate(Change~Region,data=uspopchange,min)
max_change = aggregate(Change~Region,data=uspopchange,max)
dumbell_data=cbind(min_change,max_change)
dumbell_data## Region Change Region Change
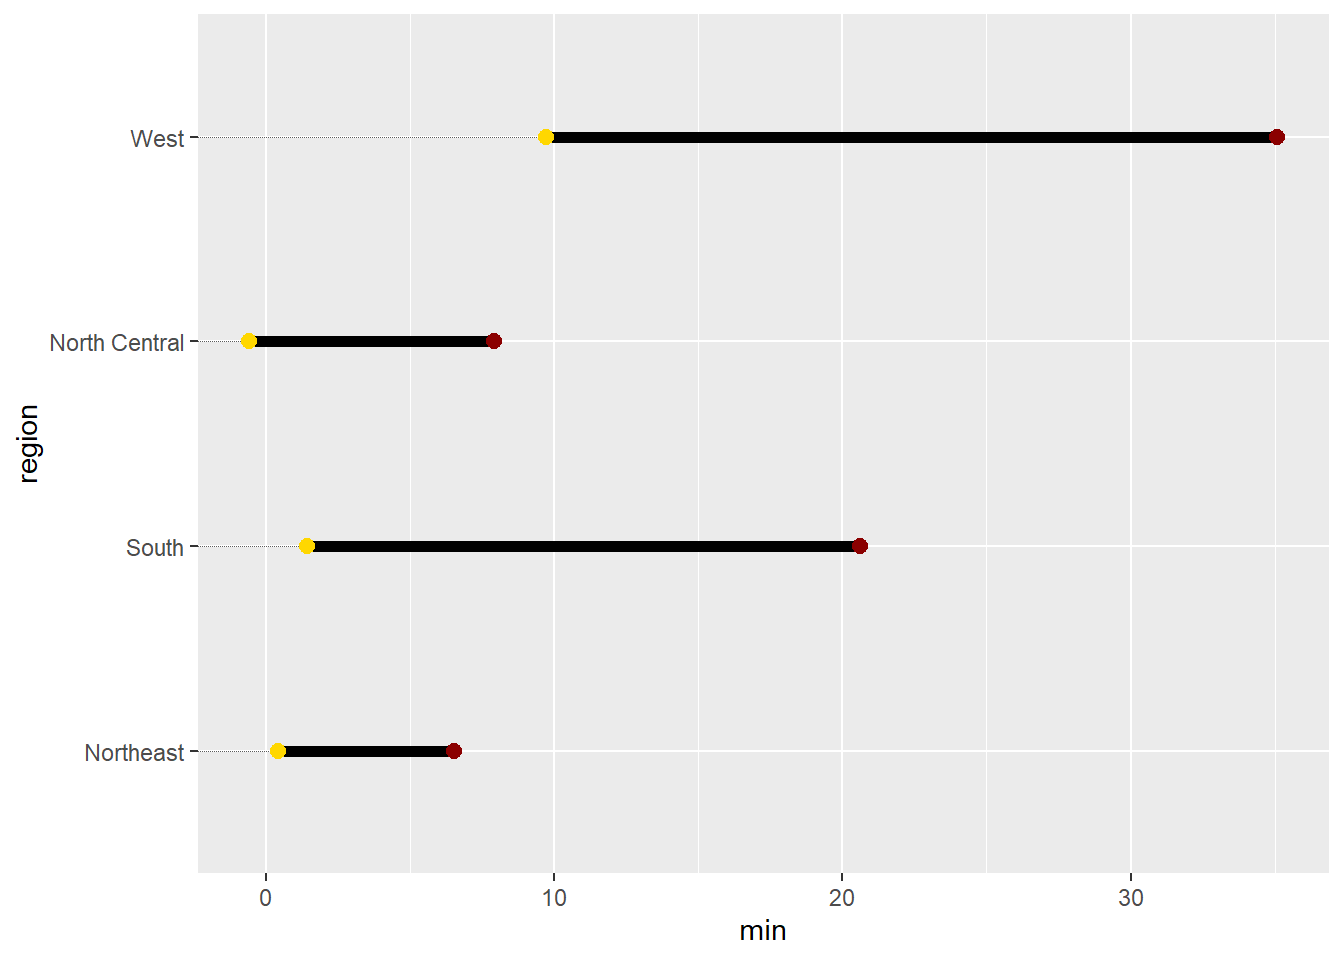
## 1 Northeast 0.4 Northeast 6.5
## 2 South 1.4 South 20.6
## 3 North Central -0.6 North Central 7.9
## 4 West 9.7 West 35.1dumbell_data = dumbell_data[,-3]
colnames(dumbell_data) = c("region","min","max")
dumbell_data## region min max
## 1 Northeast 0.4 6.5
## 2 South 1.4 20.6
## 3 North Central -0.6 7.9
## 4 West 9.7 35.1This is how your data looks like.
library(ggalt)ggplot(dumbell_data, aes(y=region, x= min, xend=max)) +
geom_dumbbell(size=2, color="black",
colour_x = "gold1", colour_xend = "darkred",
dot_guide=TRUE, dot_guide_size=0.1)