Chapter 12 Apperance and Customization
The apperance of ggplot objects can be imporved using themes in ggplot2 package and other theme packages such as ggthemes and bbplot.
Consider uspopchange data from gcookbook package.
uspopchange <- gcookbook::uspopchanget = table(uspopchange$Region)
df = data.frame(t)
df## Var1 Freq
## 1 Northeast 9
## 2 South 16
## 3 North Central 12
## 4 West 13ggplot(df,aes(x=Var1,y=Freq,fill=Var1))+geom_bar(stat="identity",width=0.5)+
labs(title="Distribution of Region",y="Freq",x = "Region")+scale_fill_manual(values=c("darkred","gold1","maroon","steelblue"))+geom_text(aes(label=Freq),vjust=-0.25,fontface="bold")+theme_bw()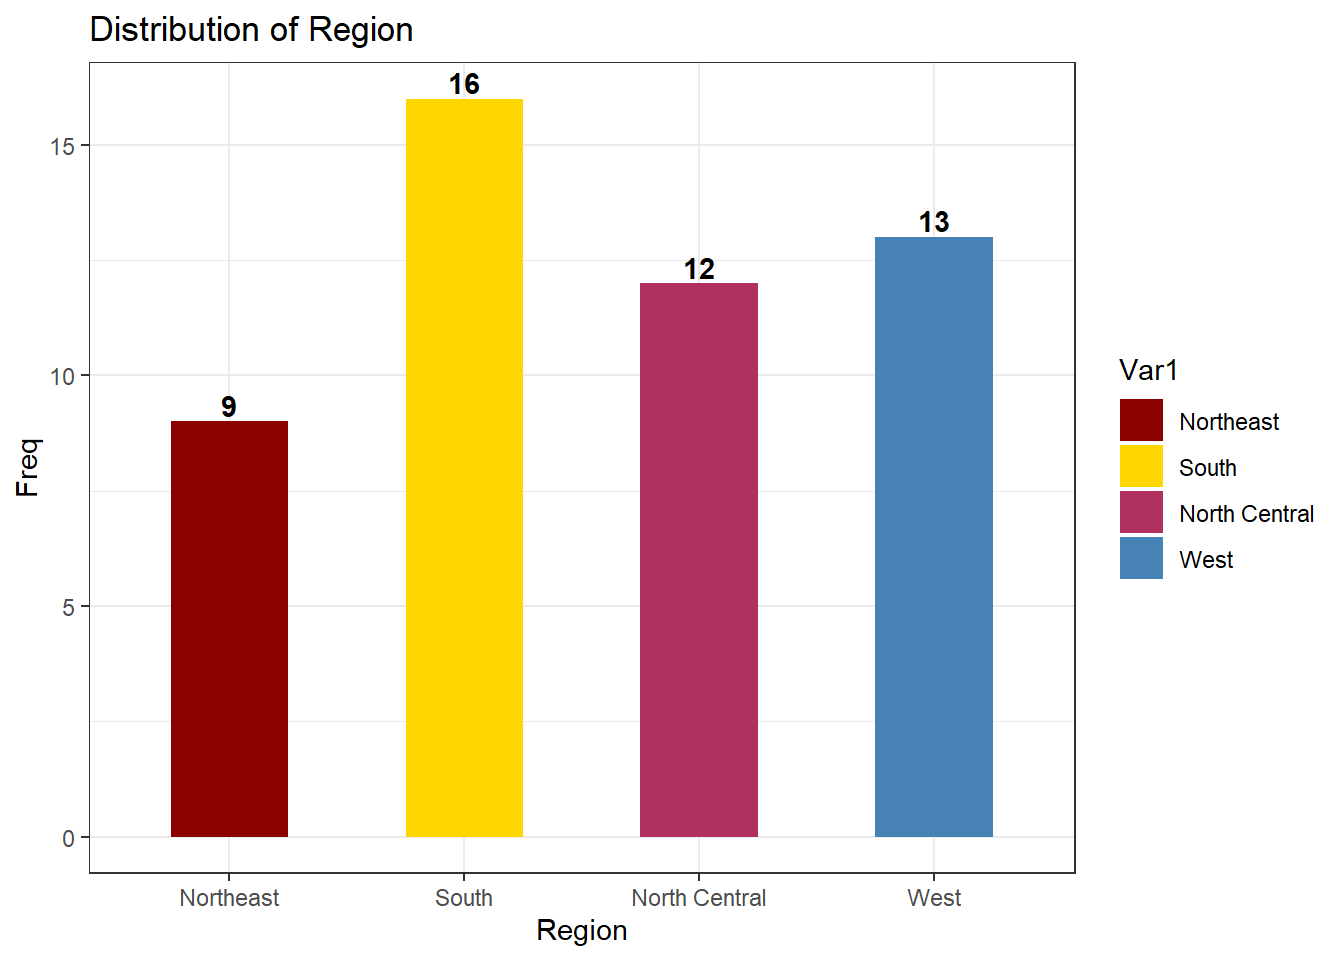
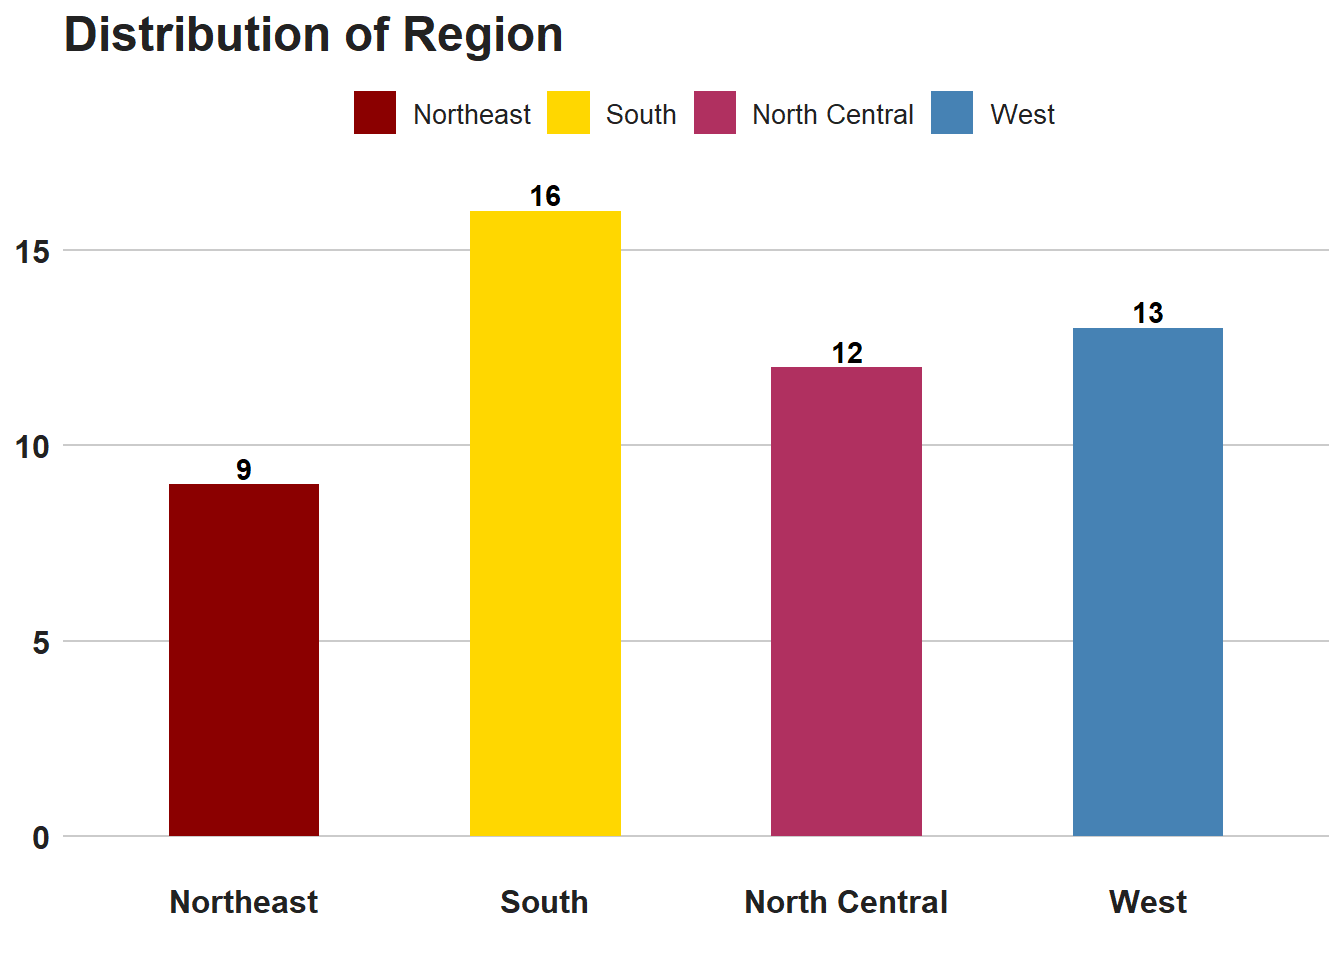
library(bbplot)
ggplot(df,aes(x=Var1,y=Freq,fill=Var1))+geom_bar(stat="identity",width=0.5)+
  labs(title="Distribution of Region",y="Freq",x = "Region")+scale_fill_manual(values=c("darkred","gold1","maroon","steelblue"))+geom_text(aes(label=Freq),vjust=-0.25,fontface="bold")+bbc_style()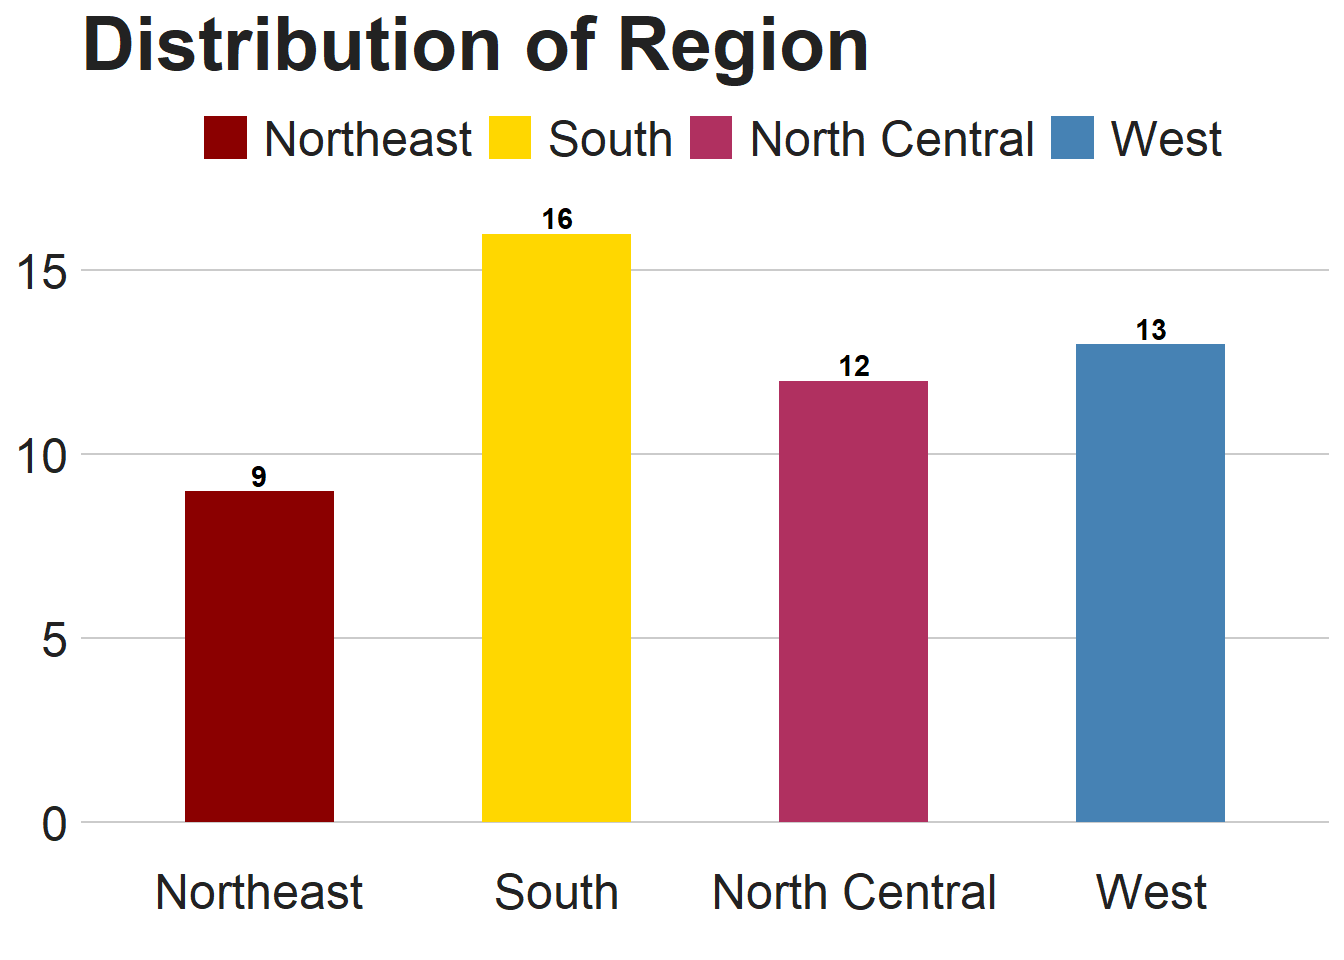
library(ggthemes)
ggplot(df,aes(x=Var1,y=Freq,fill=Var1))+geom_bar(stat="identity",width=0.5)+
  labs(title="Distribution of Region",y="Freq",x = "Region")+scale_fill_manual(values=c("darkred","gold1","maroon","steelblue"))+geom_text(aes(label=Freq),vjust=-0.25,fontface="bold")+theme_fivethirtyeight()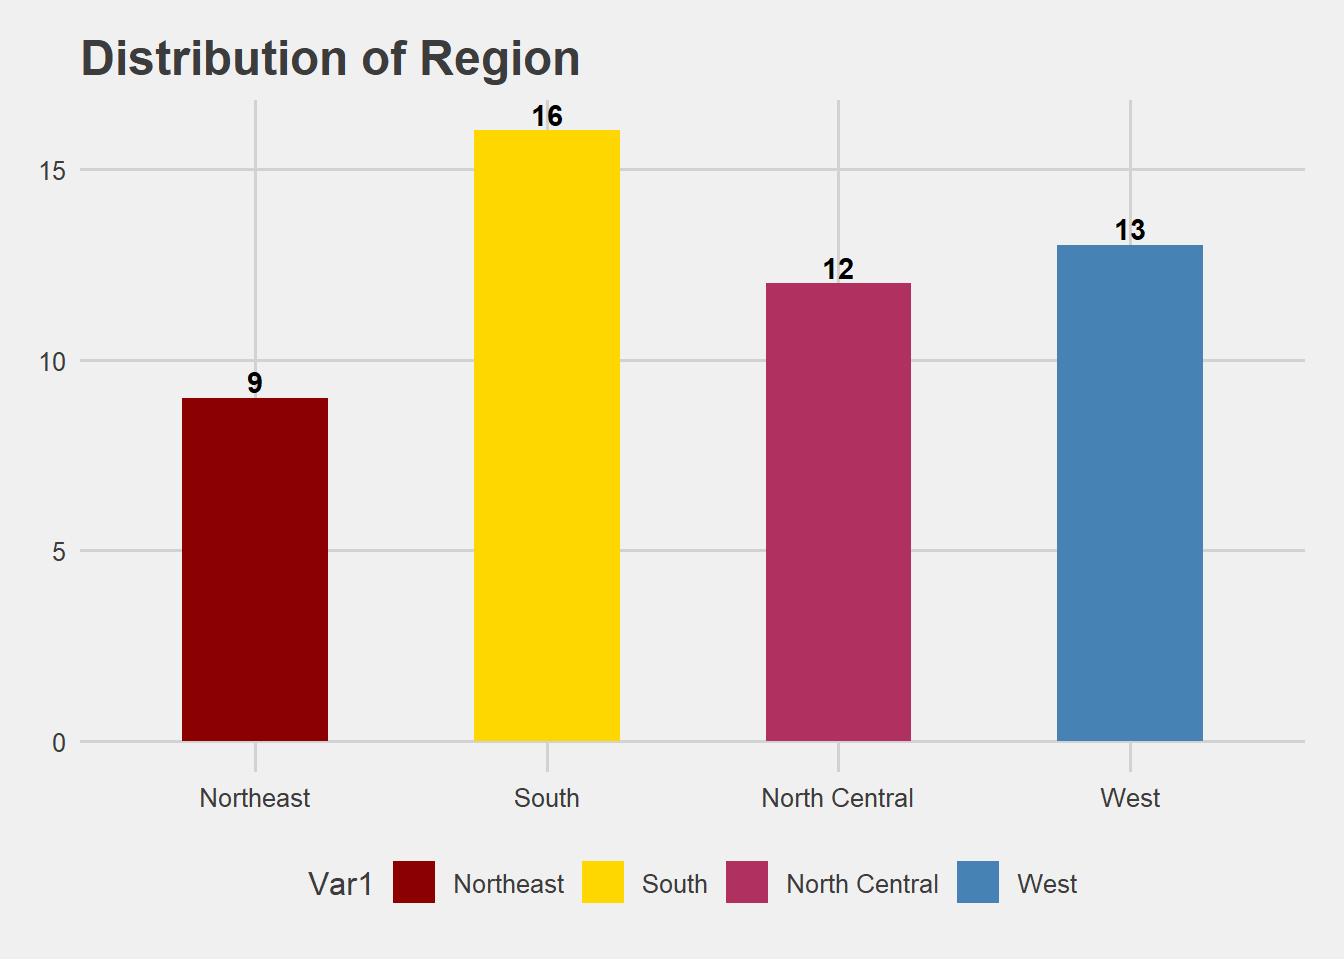
library(ggthemes)
ggplot(df,aes(x=Var1,y=Freq,fill=Var1))+geom_bar(stat="identity",width=0.5)+
  labs(title="Distribution of Region",y="Freq",x = "Region")+scale_fill_manual(values=c("darkred","gold1","maroon","steelblue"))+geom_text(aes(label=Freq),vjust=-0.25,fontface="bold")+theme_economist_white()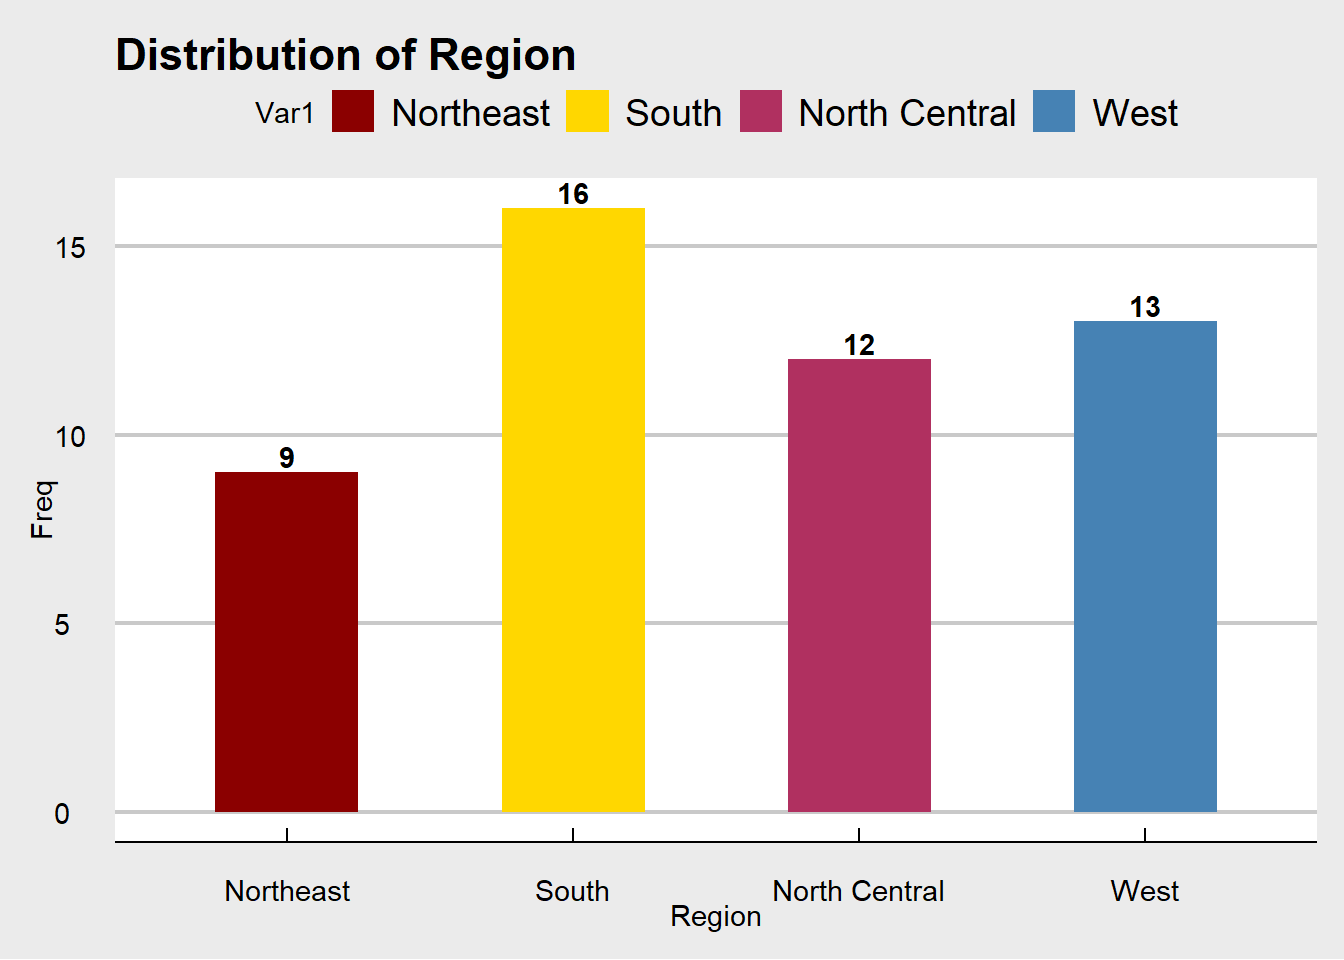
You can also use theme() function for customization.
library(bbplot)
ggplot(df,aes(x=Var1,y=Freq,fill=Var1))+geom_bar(stat="identity",width=0.5)+
labs(title="Distribution of Region",y="Freq",x = "Region")+scale_fill_manual(values=c("darkred","gold1","maroon","steelblue"))+geom_text(aes(label=Freq),vjust=-0.25,fontface="bold")+bbc_style()+
  theme(plot.title = element_text(size=18),axis.text = element_text(size=12,face="bold"),legend.text = element_text(size=10))