6.4 Simulating a simple health center
Let’s say we want to simulate an ambulatory consultation where a patient is first seen by a nurse for an intake, next by two doctors for the consultation and finally by administrative staff to schedule a follow-up appointment.
We can construct a patient trajectory which defines all these steps.
patient <- trajectory("patients' path") %>%
  ## add an intake activity
  seize("nurse", 1) %>%
  timeout(function() rnorm(1, 15)) %>%
  release("nurse", 1) %>%
  ## add a consultation activity
  seize("doctor", 2) %>%
  timeout(function() rnorm(1, 20)) %>%
  release("doctor", 2) %>%
  ## add a planning activity
  seize("administration", 1) %>%
  timeout(function() rnorm(1, 5)) %>%
release("administration", 1)plot(patient)Once the trajectory is known, you may attach arrivals to it and define the resources needed. In the example below, three types of resources are added: the nurse and administration resources, each one with a capacity of 2, and the doctor resource, with a capacity of 4. The last method adds a generator of arrivals (patients) following the trajectory patient. The time between patients is about 5 minutes.
Let’s run the simulation using replication.
envs <- lapply(1:100, function(i) {
simmer("health center") %>%
  add_resource("nurse", 3) %>%
  add_resource("doctor", 4) %>%
  add_resource("administration", 2) %>%
  add_generator("patient", patient, function() rexp(1, 1/5)) %>%
    run(until=480)
}
)
Let’s observe the results.
plot(get_mon_resources(envs),metric= "utilization")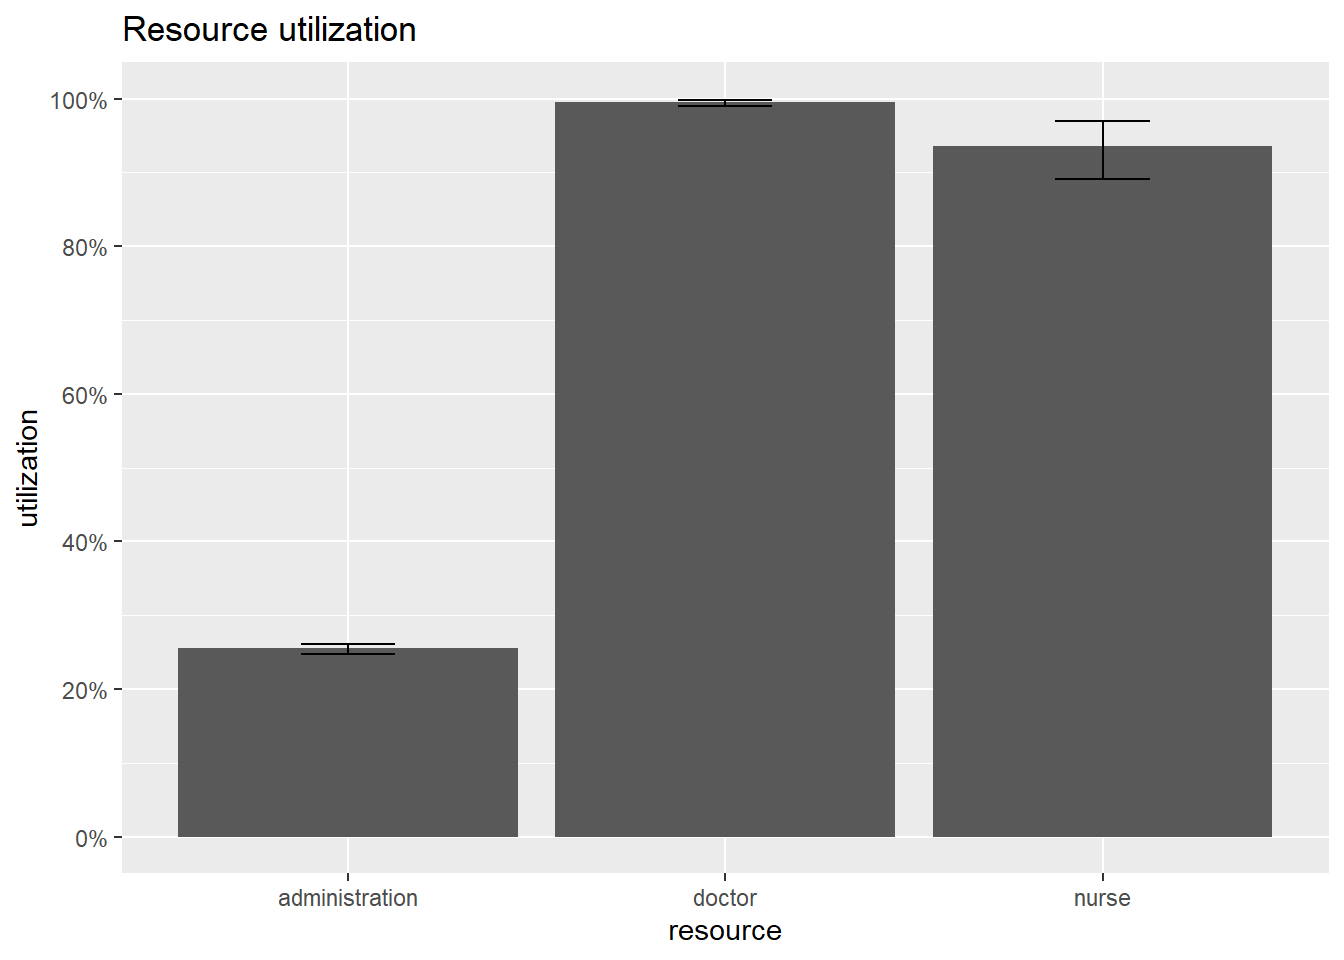
plot(get_mon_resources(envs), metric = "usage", items = "server")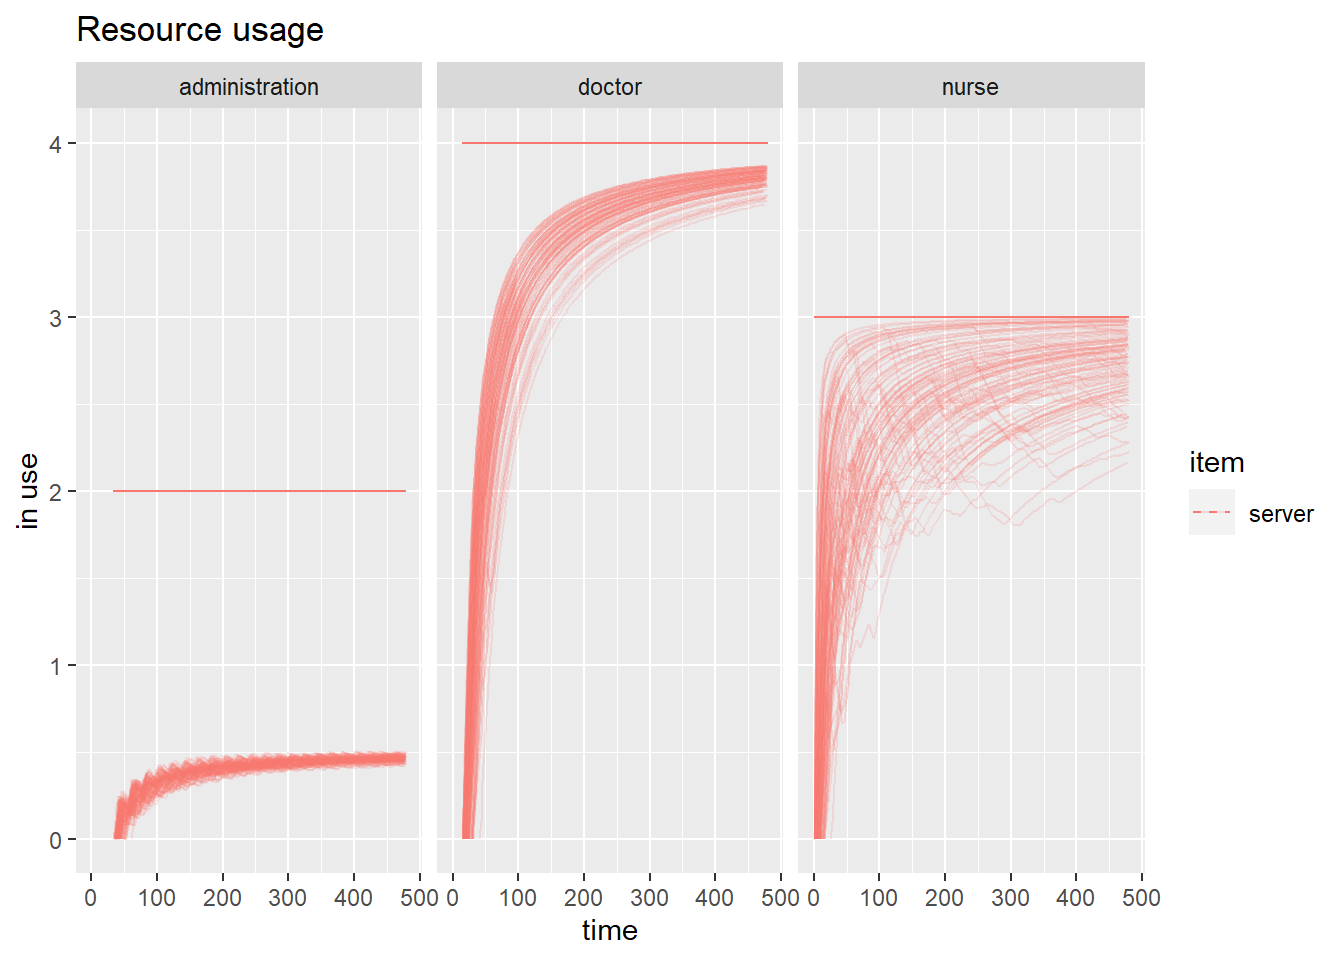
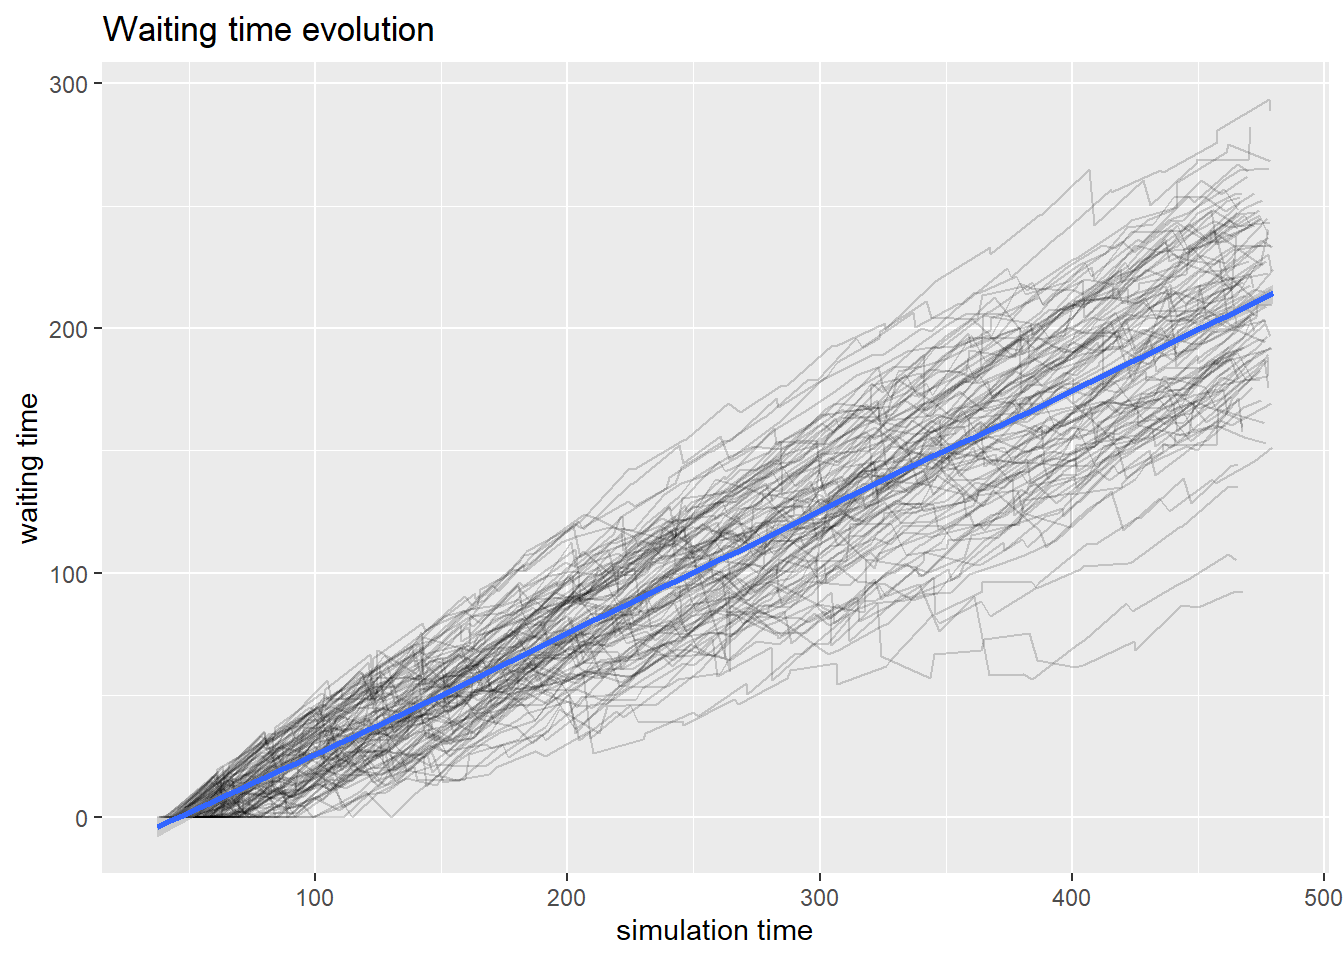
plot(get_mon_arrivals(envs), metric = "waiting_time")## `geom_smooth()` using method = 'gam' and formula 'y ~ s(x, bs = "cs")'