2 MEPS Data
2.1 Introduction
Throughout this case study, you will be using data from the Medical Expenditure Panel Survey (MEPS). This chapter will provide a brief background on the MEPS data in order to ground us before we get started with the rest of the module.
2.2 What is MEPS
MEPS is a family of surveys intended to provide nationally representative estimates of health expenditure, utilization, payment sources, health status, and health insurance coverage among individuals in the United States. In other words, MEPS is an ongoing study aimed at providing researchers information to understand how people in the U.S. get and pay for health care.
MEPS is sponsored by two government bodies: the Agency for Healthcare Research and Quality (AHRQ) and the Centers for Disease Control and Prevention (CDC). These agencies administer the survey in three general components:
- The Core Household Component
- The Insurance/Employer Component
- The Medical Provider Component
We will be focusing our attention in this module only the Household Component. The Household Component, among other items, will include information from families and individuals on:
- The health status of Americans
- Health insurance coverage and access
- The use of health care services and associated costs
- Medical conditions in the U.S.
- Demographics (age, ethnicity, income, etc.)
2.3 MEPS Panel Survey Design
At its core, the MEPS Household Component is a panel survey. A panel survey is a type of longitudinal study which surveys and measures a particular group of people over time. In the case of MEPS, each household that is surveyed is surveyed a total of five times (or 5 interview rounds) over a period of two years.
For the duration of this module, we will be using data from the 2018 Full Year Consolidated Data File, which covers two panels of individuals. There will be a total of 30,461 persons in our dataset, and these people correspond to the 30,461 persons who participated in the MEPS Household Component of the MEPS survey in 2018.
These 30,461 individuals consists of persons from two panels, or groups, of surveys that were conducted during 2018: Panel 22 and Panel 23. Panel 22 consists of 14,988 persons, and Panel 23 contains 15,473 persons. In our data, we will have access to information from the third, fourth, and fifth round interviews from Panel 22 and rounds 2 and 3 from Panel 23.
Now, for the purposes of this module, we will not be paying attention to any of the details concerned with the separate panels - you can think of these two panels as just one group of individuals. The reason we call out this distinction, however, is to avoid confusion when we load and use the data.
For example, when you load the dataset into R in the next chapter, there will be a column called ADFLST42. This column will have a 1 (YES) or 2 (NO) to indicate whether an individual had a flu vaccine within the past 12 months. Now, the reason there’s a 42 at the end of the column name, is to indicate that this question was taken from Round 4 of Panel 22, and Round 2 of Panel 23.
Again, for the purposes of what we will be using the data for, you can ignore the 42 and just think of it as an indicator variable for who did or did not receive a flu shot in the past 12 months. In short, you do not need to pay attention to the fact that some columns will have a 42 at the end of them - it’s simply signaling which round of interview the information came from.
2.4 Using the Documentation
Any time you’re using a new dataset, it is especially helpful to have resources available to you to look up information about specific columns and values in the data. MEPS provides both a documentation PDF as well as a codebook PDF to help researchers, such as yourselves, understand the dataset. These files are located here, and are specific to the 2018 Household Component data that we will be using.
The documentation PDF contains a wealth of information regarding the design of the surveys, variables included in the dataset, and how values were defined and populated. Please use the documentation as a resource if you ever need to look up the meaning of a particular variable, how it was assessed in the surveys, or any other questions that you have about the data.
2.5 Using the Codebook
The codebook is another useful document provided to help you quickly understand the contents of the Household Component Data. The codebook includes lists of all the 1,500+ columns included in the full dataset, and a quick description of what these variables are. Importantly, it also includes a section that lists each variable, along with the data type of the variable, and the possible values the variable may take on, along with the person-counts of those values.
For example, one variable, or field, that we’ll use later in this module is the MNHLTH42 field. If you had never worked with the MEPS data before, you may go to the codebook and look up the MNHLTH42 field to see what the field is assessing, what the data type of the field is, and what the possible values are.
The image below depicts what you would find in the codebook when you search for MNHLTH42:
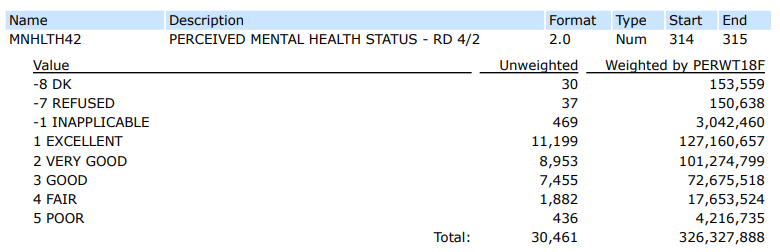
From this, you would be able to conclude the following:
- This variable is assessing a person’s perceived mental health status as of the Round 4 interview for Panel 22, and the Round 2 interview for Panel 23.
- The variable is in a numeric format
- The field can take on the possible values of -8, -7, -1, 1, 2, 3, 4, and 5, which corresponds to DK (don’t know), REFUSED, INAPPLICABLE, EXCELLENT, and so forth. In general, any value that is negative represents some type of invalid or uncollected response to the survey question.
- In the dataset, 11,199 individuals (out of the 30,461 total) indicated they had excellent perceived mental health status. 8,953 indicated their perceived mental health status was good, and so forth.
2.6 A Note on Person-Weighting
You may also notice in the image above, that there is an additional column that says “Weighted by PERWT18F”. While out of the scope of this module, the MEPS data contains variables that essentially allow you to extrapolate the survey results to a national population in the U.S. using complex survey weighting techniques (these techniques would be covered in a more advanced complex survey statistics course).
In other words, there are 30,461 individuals who took part in the MEPS survey in 2018, but each one of these individuals is assigned a person-weight which, in simple terms, corresponds to how many people in the U.S. that person is “representative of”.
You’ll notice that the sum of the Weighted by PERWT18F is equal to 326,327,888, which is intended to correspond to the U.S. population. So for example, the MEPS codebook is telling you that 11,199 out of the 30,461 survey respondents indicated they have excellent perceived mental health status, and this would translate to about 127 million individuals across the entire United States population.
Again, these survey weighting techniques are out of scope for this module, but it is worth noting their existence as researchers in practice would often use them to infer their results to a national scale.