1 Problem Solving with Data
1.1 Introduction
This chapter will introduce you to a general approach to solving problems and answering questions using data. Throughout the rest of the module, we will reference back to this chapter as you work your way through your own data analysis exercises.
The approach is applicable to actuaries, data scientists, general data analysts, or anyone who intends to critically analyze data and develop insights from data.
This framework, which some may refer to as The Data Science Process includes the following five main components:
- Data Collection
- Data Cleaning
- Exploratory Data Analysis
- Model Building
- Inference and Communication

Note that all five steps may not be applicable in every situation, but these steps should guide you as you think about how to approach each analysis you perform.
In the subsections below, we’ll dive into each of these in more detail.
1.2 Data Collection
In order to solve a problem or answer a question using data, it seems obvious that you must need some sort of data to start with. Obtaining data may come in the form of pre-existing or generating new data (think surveys). As an actuary, your data will often come from pre-existing sources within your company. This could include querying data from databases or APIs, being sent excel files, text files, etc. You may also find supplemental data online to assist you with your project.
For example, let’s say you work for a health insurance company and you are interested in determining the average drive time for your insured population to the nearest in-network primary care providers to see if it would be prudent to contract with additional doctors in the area. You would need to collect at least three pieces of data:
- Addresses of your insured population (internal company source/database)
- Addresses of primary care provider offices (internal company source/database)
- Google Maps travel time API to calculate drive times between addresses (external data source)
In summary, data collection provides the fundamental pieces needed to solve your problem or answer your question.
1.3 Data Cleaning
We’ll discuss data cleaning in a little more detail in later chapters, but this phase generally refers to the process of taking the data you collected in step 1, and turning it into a usable format for your analysis. This phase can often be the most time consuming as it may involve handling missing data as well as pre-processing the data to be as error free as possible.
Depending on where you source your data will have major implications for how long this phase takes. For example, many of us actuaries benefit from devoted data engineers and resources within our companies who exert much effort to make our data as clean as possible for us to use. However, if you are sourcing your data from raw files on the internet, you may find this phase to be exceptionally difficult and time intensive.
1.4 Exploratory Data Analysis
Exploratory Data Analysis, or EDA, is an entire subject itself. In short, EDA is an iterative process whereby you:
- Generate questions about your data
- Search for answers, patterns, and characteristics of your data by transforming, visualizing, and summarizing your data
- Use learnings from step 2 to generate new questions and insights about your data
We’ll cover some basics of EDA in Chapter 4 on Data Manipulation and Chapter 5 on Data Visualization, but we’ll only be able to scratch the surface of this topic.
A successful EDA approach will allow you to better understand your data and the relationships between variables within your data. Sometimes, you may be able to answer your question or solve your problem after the EDA step alone. Other times, you may apply what you learned in the EDA step to help build a model for your data.
1.5 Model Building
In this step, we build a model, often using machine learning algorithms, in an effort to make sense of our data and gain insights that can be used for decision making or communicating to an audience. Examples of models could include regression approaches, classification algorithms, tree-based models, time-series applications, neural networks, and many, many more. Later in this module, we will practice building our own models using introductory machine learning algorithms.
It’s important to note that while model building gets a lot of attention (because it’s fun to learn and apply new types of models), it typically encompasses a relatively small portion of your overall analysis from a time perspective.
It’s also important to note that building a model doesn’t have to mean applying machine learning algorithms. In fact, in actuarial science, you may find more often than not that the actuarial models you create are Microsoft Excel-based models that blend together historical data, assumptions about the business, and other factors that allow you make projections or understand the business better.
1.6 Inference and Communication
The final phase of the framework is to use everything you’ve learned about your data up to this point to draw inferences and conclusions about the data, and to communicate those out to an audience. Your audience may be your boss, a client, or perhaps a group of actuaries at an SOA conference.
In any instance, it is critical for you to be able to condense what you’ve learned into clear and concise insights and convince your audience why your insights are important. In some cases, these insights will lend themselves to actionable next steps, or perhaps recommendations for a client. In other cases, the results will simply help you to better understand the world, or your business, and to make more informed decisions going forward.
1.7 Wrap-Up
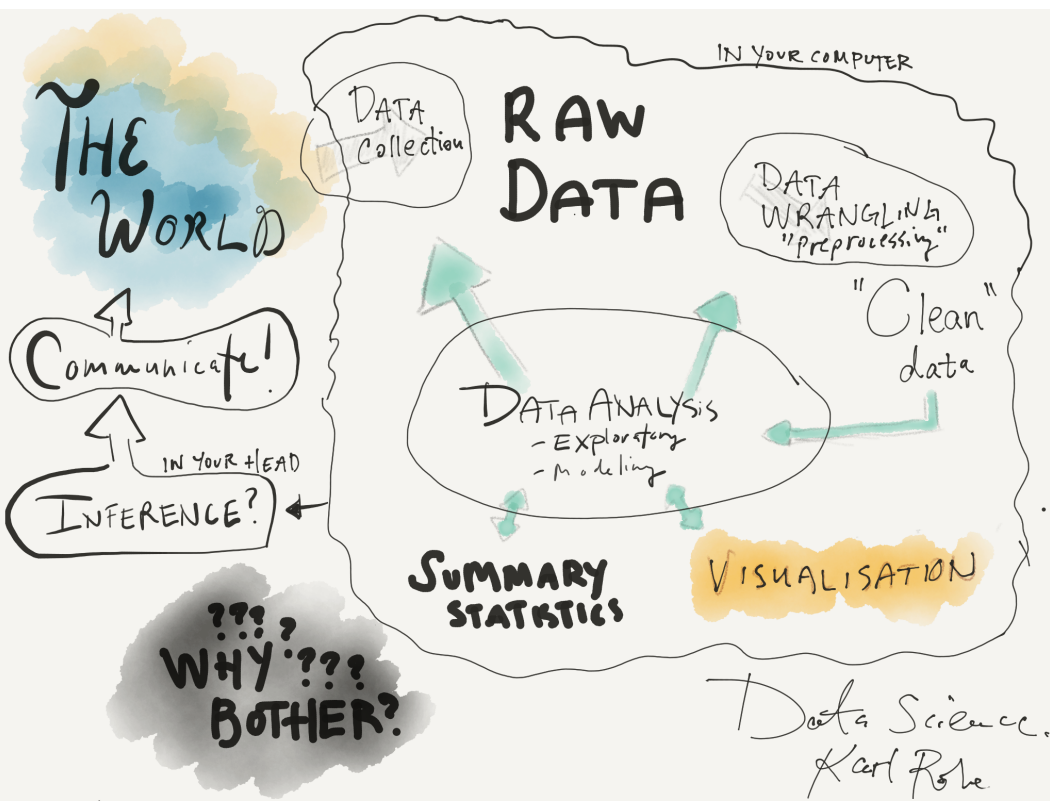
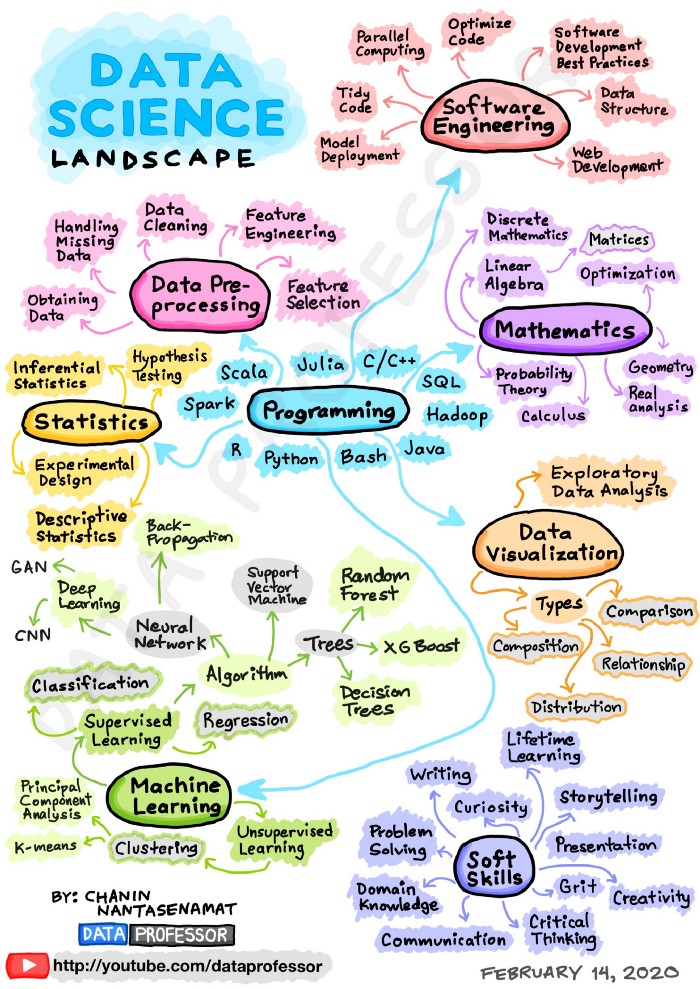
As we conclude this chapter, take a few minutes to look at a couple alternative visualizations that others have used to describe the processes and components of performing analyses. What do they have in common?
Sources:
- Karl Rohe - Professor of Statistics at the University of Wisconsin-Madison
- Chanin Nantasenamat - Associate Professor of Bioinformatics and Youtuber at the “Data Professor” channel