Raster
Load data
Rasters
Load prepared rasters.
Pinch-points
Load buffered pinch-point polygons
# buffered pinch point polygons
load("3_pipeline/store/pp_s_clip_clus_buf_ext.rData")

# study area
load("1_data/manual/study_area.rdata")

# load clipped road data
load("1_data/manual/v_road_clip.rdata")

# load polygon representing North Central Region of Saskatchewan region of the ribbon of green
load("1_data/manual/nscr.rdata")

# pinch point clusters
load("3_pipeline/tmp/pp_s_clip_clus.rData")

# buffered pinchpoints
load("3_pipeline/store/pp_s_clip_clus_buf.rData")
Prepare rasters
Stack rasters into a single object
Extract data
Check the extreme values if the raster stack to identity any values that shouldn’t be included (e.g. -9999).
Summary table
Extract and summarize raster data within each pinch-point polygon
#calculate mean
pp_r_mean<-extract(r_stack,  pp_s_clip_clus_buf_ext, fun=mean, na.rm=TRUE)
colnames(pp_r_mean)<-paste("mean", substr(colnames(pp_r_mean), 1, nchar(colnames(pp_r_mean))-5), sep="_")

#calculate sd
pp_r_sd<-extract(r_stack,  pp_s_clip_clus_buf_ext, fun=sd, na.rm=TRUE)
colnames(pp_r_sd)<-paste("sd", substr(colnames(pp_r_sd), 1, nchar(colnames(pp_r_sd))-5), sep="_")

#calculate max
pp_r_max<-extract(r_stack,  pp_s_clip_clus_buf_ext, fun=max, na.rm=TRUE)
colnames(pp_r_max)<-paste("max", substr(colnames(pp_r_max), 1, nchar(colnames(pp_r_sd))-3), sep="_")

#calculate min
pp_r_min<-extract(r_stack,  pp_s_clip_clus_buf_ext, fun=min, na.rm=TRUE)
colnames(pp_r_min)<-paste("min", substr(colnames(pp_r_min), 1, nchar(colnames(pp_r_sd))-3), sep="_")


##### Cell data #########
pp_r_l_mean<-extract(cell_clip,  pp_s_clip_clus_buf_ext, fun=mean, na.rm=TRUE)
colnames(pp_r_l_mean)<-paste("mean_cell", substr(colnames(pp_r_l_mean), 1, nchar(colnames(pp_r_l_mean))-5))

#calculate sd
pp_r_l_sd<-extract(cell_clip,  pp_s_clip_clus_buf_ext, fun=sd, na.rm=TRUE)
colnames(pp_r_l_sd)<-paste("sd_cell", substr(colnames(pp_r_l_sd), 1, nchar(colnames(pp_r_l_sd))-5))

#calculate max
pp_r_l_max<-extract(cell_clip,  pp_s_clip_clus_buf_ext, fun=max, na.rm=TRUE)
colnames(pp_r_l_max)<-paste("max_cell", substr(colnames(pp_r_l_max), 1, nchar(colnames(pp_r_l_sd))-3))

#calculate min
pp_r_l_min<-extract(cell_clip,  pp_s_clip_clus_buf_ext, fun=min, na.rm=TRUE)
colnames(pp_r_l_min)<-paste("min_cell", substr(colnames(pp_r_l_min), 1, nchar(colnames(pp_r_l_sd))-3))


#combine metrics into a single table
pp_r<-cbind(ID=pp_s_clip_clus_buf_ext$ID, pp_r_min, pp_r_max, pp_r_mean, pp_r_sd, pp_r_l_min, pp_r_l_max, pp_r_l_mean, pp_r_l_sd)


pp_r<-cbind(pp_r, pp_r_l_min, pp_r_l_max, pp_r_l_mean, pp_r_l_sd )
#reorder columns
pp_r<-pp_r[,c("ID","min_slope", "max_slope", "mean_slope", "sd_slope", "min_aspect", "max_aspect", "mean_aspect", "sd_aspect", "min_cell", "max_cell", "mean_cell", "sd_cell")]

# save
save(pp_r,file="3_pipeline/store/pp_r.rData")| ID | min_slope | min_aspect | max_slope | max_aspect | mean_slope | mean_aspect | sd_slope | sd_aspect | min_cell | max_cell | mean_cell | sd_cell |
|---|---|---|---|---|---|---|---|---|---|---|---|---|
| 1 | 0.0812411 | 9.523023 | 29.51549 | 350.7695 | 9.270331 | 259.04827 | 7.952051 | 57.05700 | 0.0000456 | 0.0056719 | 0.0019634 | 0.0015081 |
| 2 | 0.0704860 | 3.451188 | 36.16954 | 350.3948 | 9.332548 | 116.92821 | 8.964192 | 117.51785 | 0.0000672 | 0.0058609 | 0.0015163 | 0.0012145 |
| 3 | 0.0015890 | -1.000000 | 36.34338 | 355.8282 | 10.351893 | 61.10899 | 8.540351 | 74.69963 | 0.0006340 | 0.0118666 | 0.0041836 | 0.0021918 |
| 4 | 0.0302920 | 7.249906 | 32.39600 | 355.5254 | 10.835116 | 274.18811 | 9.079490 | 99.14873 | 0.0001906 | 0.0114184 | 0.0038657 | 0.0031939 |
| 5 | 0.5257717 | 17.686188 | 15.55570 | 304.5115 | 6.774683 | 71.43680 | 3.858803 | 61.59105 | 0.0002890 | 0.0057767 | 0.0022719 | 0.0014625 |
| 6 | 0.3955552 | 37.618832 | 14.68072 | 347.2162 | 5.808701 | 137.50692 | 3.444783 | 61.99655 | 0.0003289 | 0.0172053 | 0.0062886 | 0.0043468 |
| 7 | 2.5336754 | 158.527191 | 32.88671 | 341.4302 | 14.066558 | 310.33579 | 9.399289 | 26.40259 | 0.0003269 | 0.0035523 | 0.0017525 | 0.0010484 |
| 8 | 0.1472756 | 29.808361 | 29.34639 | 302.2689 | 12.175097 | 119.74625 | 7.320759 | 33.05506 | 0.0003237 | 0.0137275 | 0.0033210 | 0.0027728 |
| 9 | 0.0011139 | -1.000000 | 19.93499 | 357.6785 | 5.804861 | 266.47090 | 4.539194 | 88.67824 | 0.0007211 | 0.0043416 | 0.0018871 | 0.0006696 |
| 10 | 0.5570856 | 36.425022 | 11.98081 | 311.1764 | 4.675243 | 82.88598 | 3.742990 | 32.59775 | 0.0001137 | 0.0002259 | 0.0001730 | 0.0000241 |
| 11 | 0.4183576 | 23.960176 | 36.29103 | 316.6076 | 15.518173 | 171.71226 | 7.504589 | 48.60800 | 0.0001316 | 0.0389883 | 0.0038852 | 0.0081698 |
| 12 | 0.2824213 | 8.322483 | 36.79930 | 346.5271 | 12.061293 | 279.54274 | 9.658006 | 34.58862 | 0.0002528 | 0.0044315 | 0.0016714 | 0.0010472 |
| 13 | 1.4415734 | 84.780663 | 29.49452 | 216.7601 | 11.417863 | 176.32245 | 5.478304 | 17.11099 | 0.0009026 | 0.0554351 | 0.0064237 | 0.0077582 |
| 14 | 3.7535818 | 130.068848 | 19.73516 | 173.1658 | 11.018893 | 151.23519 | 3.648061 | 12.60279 | 0.0016754 | 0.0879066 | 0.0317502 | 0.0264956 |
Summary histograms
Create a histogram of raster values for each pinch point.
poly<-pp_s_clip_clus_buf_ext
#poly$ID <- 1:length(poly)
poly$layer <- NULL
d <- data.frame(poly)
v<-extract(r_stack,  poly, na.rm=TRUE, df=TRUE)

vd <- merge(d, v, by="ID")
vd<- vd[-c(3)]
save(vd, file="3_pipeline/tmp/vd.rData")

# x<-vd[vd$ID==1,]
# h<-hist(aspect_clip)

############# Slope plot #################

# basemap
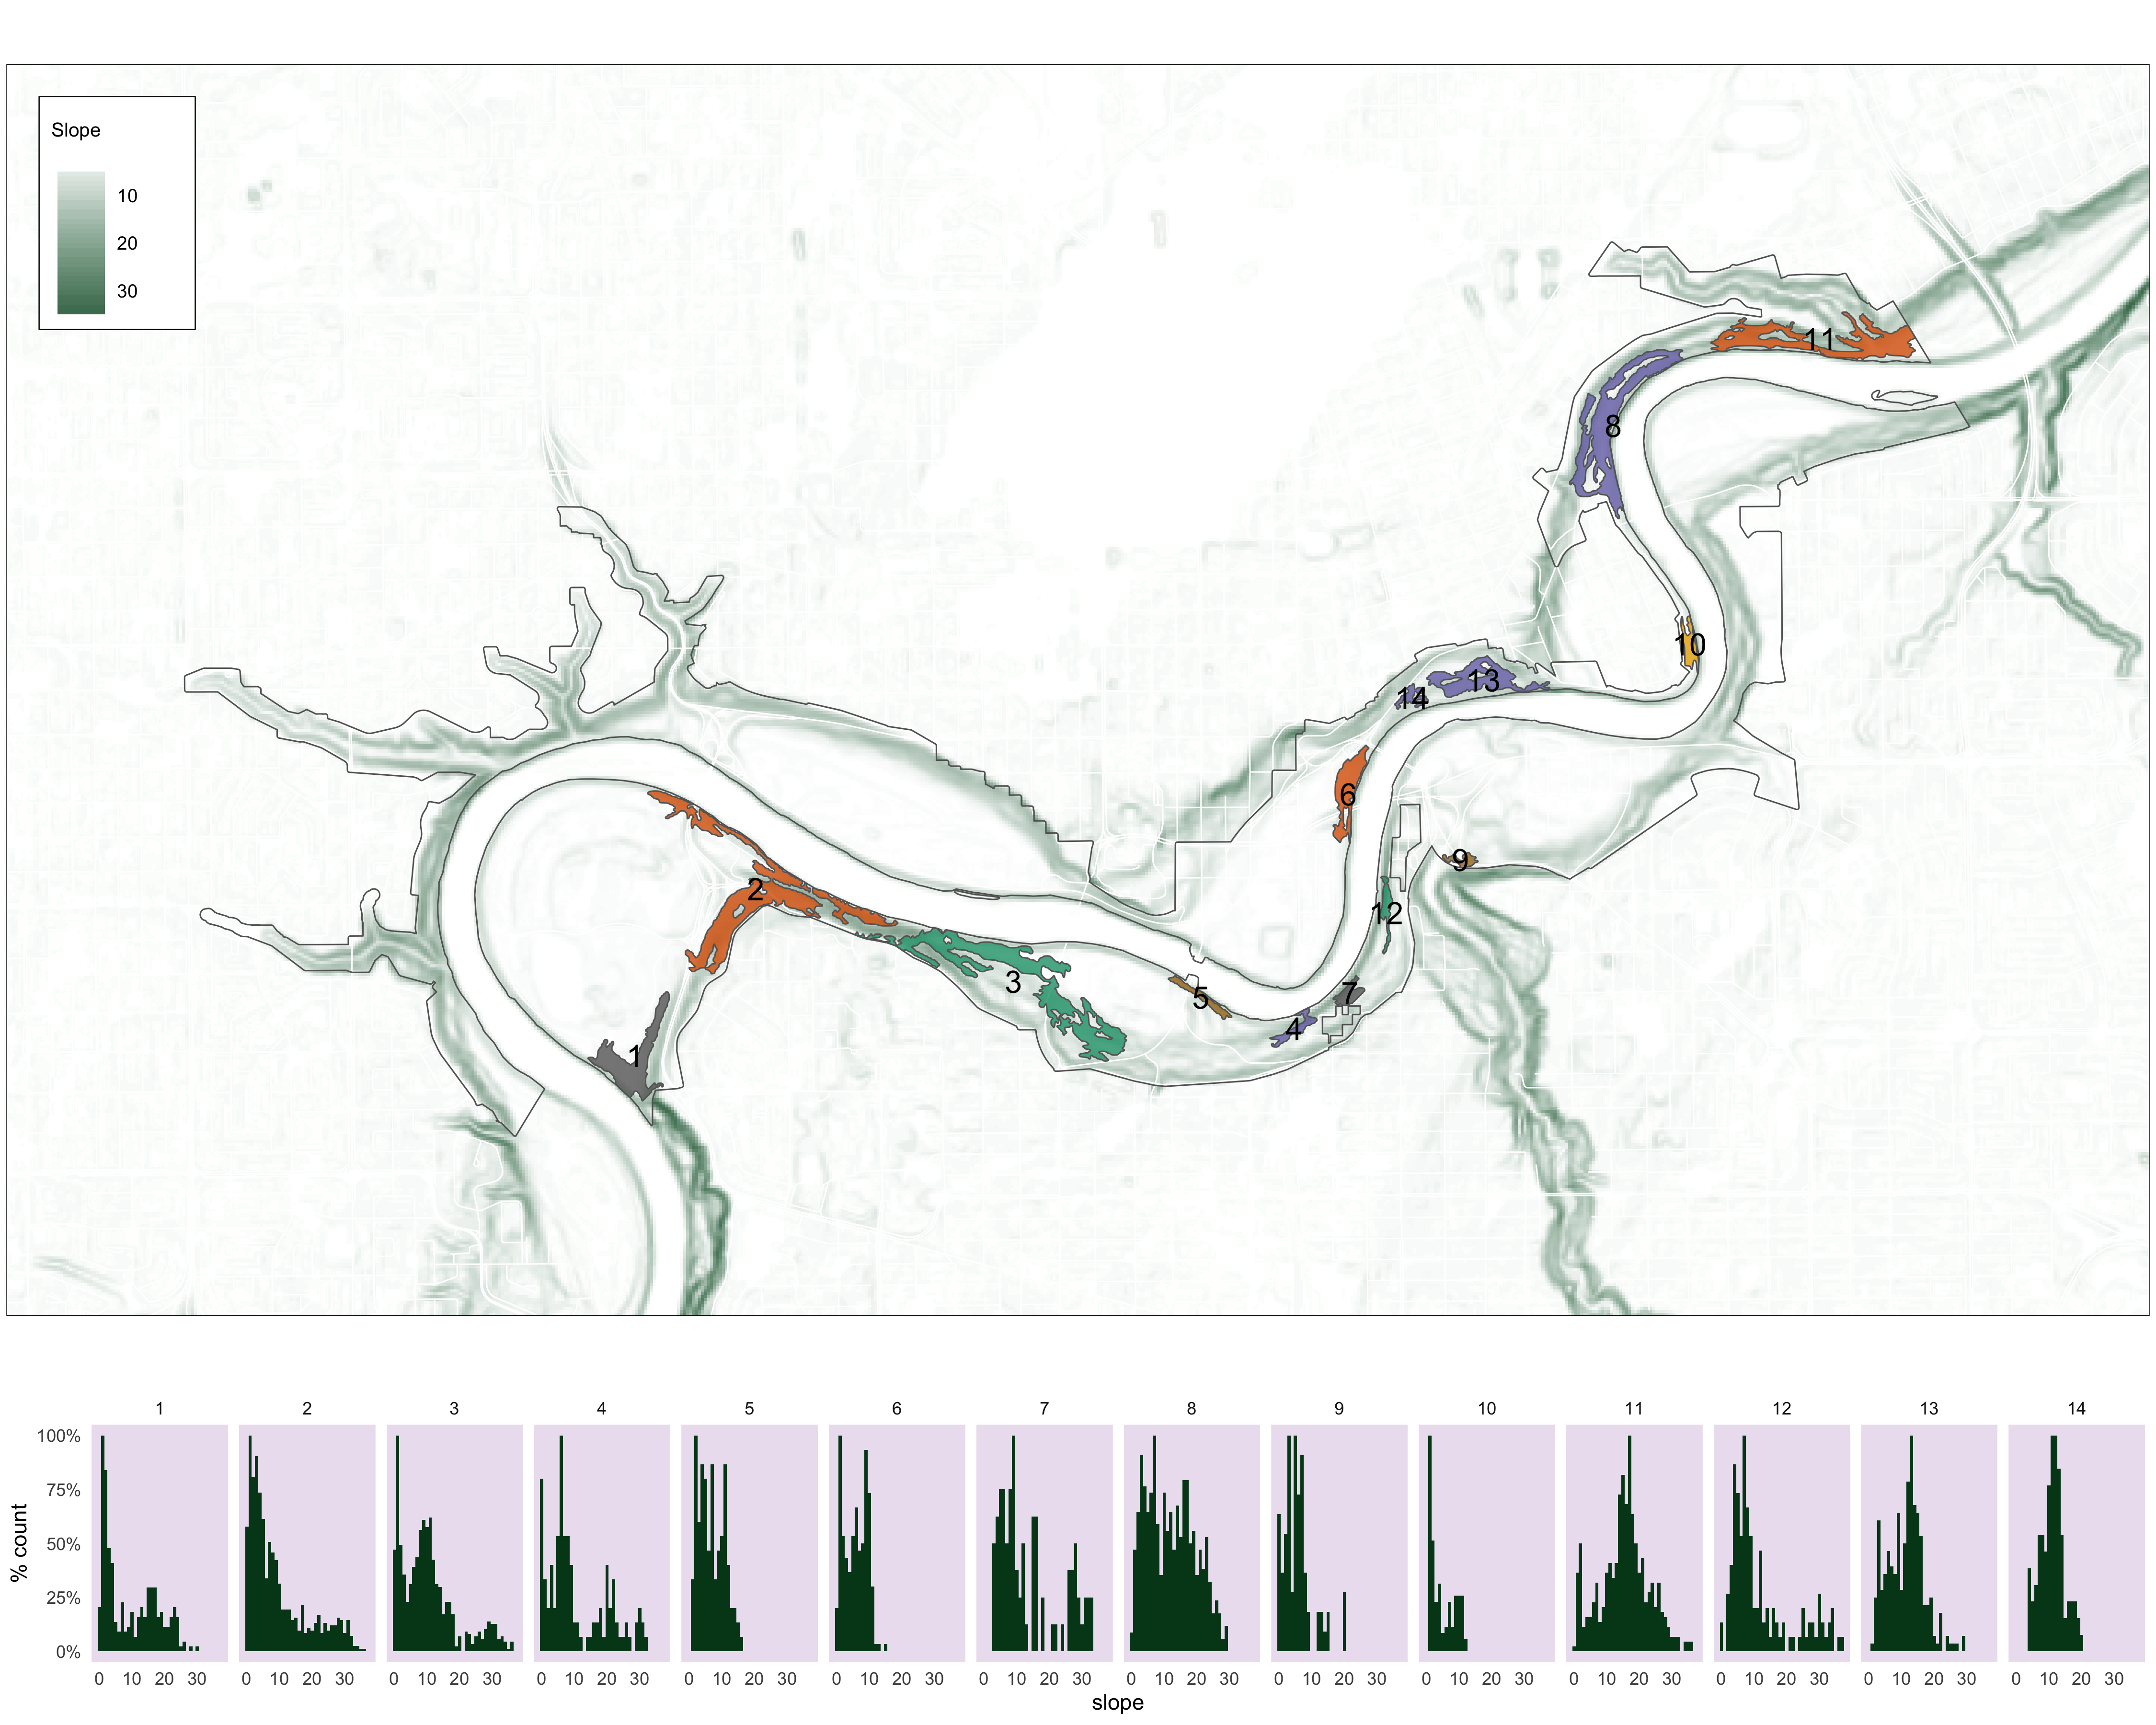
m4<-
  tm_shape(slope_clip)+
    tm_raster(palette = c("white", "#00441b"),
      title = "Slope",
              contrast = c(0,.8),
              style = "cont")+
   tm_shape(v_road_clip)+tm_lines(col="white")+
  tm_layout(bg.col="#d9d9d9")+
  tm_shape(nscr)+
    tm_fill(col="white", alpha=.4)+
    tm_borders(col = "#636363")+
  tm_shape(pp_s_clip_clus)  +
    tm_fill(col="MAP_COLORS", palette = "Dark2", alpha=.8)+
    tm_borders(alpha=1)+
   tm_shape(pp_s_clip_clus_buf)+
    tm_text(text = "group",
          col="black",
          size = 1.3)+
  tm_layout(legend.outside = FALSE,
            legend.text.size = .8,
            legend.bg.color="white",
            legend.frame=TRUE,
            legend.title.size=1,
            legend.frame.lwd=.8,
            )
m4

#convert tmap to grob
g1<-tmap_grob(m4)


# create hist plots in ggplot convert to grob objects which will be plotted in tmap.

g2<-vd%>%
    ggplot(aes(x = slope_clip)) +
    geom_histogram(binwidth=1, position = "identity", aes(y=..ncount..), fill="#00441b") +
  #geom_density(alpha=.2, fill="#FF6666")+
    scale_y_continuous(labels = percent_format())+
  labs(x="slope", y="% count")+
    theme(#panel.background = element_blank(),
          axis.ticks=element_blank(),
          strip.background =element_rect(fill="white"),
          panel.background = element_rect(fill="#ece2f0"),
          panel.grid.major = element_blank(),
          panel.grid.minor = element_blank())+
  facet_grid(~ID)
  # geom_vline(aes(xintercept=grp.mean),
  #           color="blue", linetype="dashed", size=1)+
g2


lay2 <- rbind(c(1),
              c(1),
              c(1),
              c(1),
              c(2))

m2<-arrangeGrob(g1, g2, layout_matrix =lay2)

ggsave("4_output/maps/summary/raster_slope_hist_map.png", m2, width=15, height=12
       )

############# Aspect plot #################

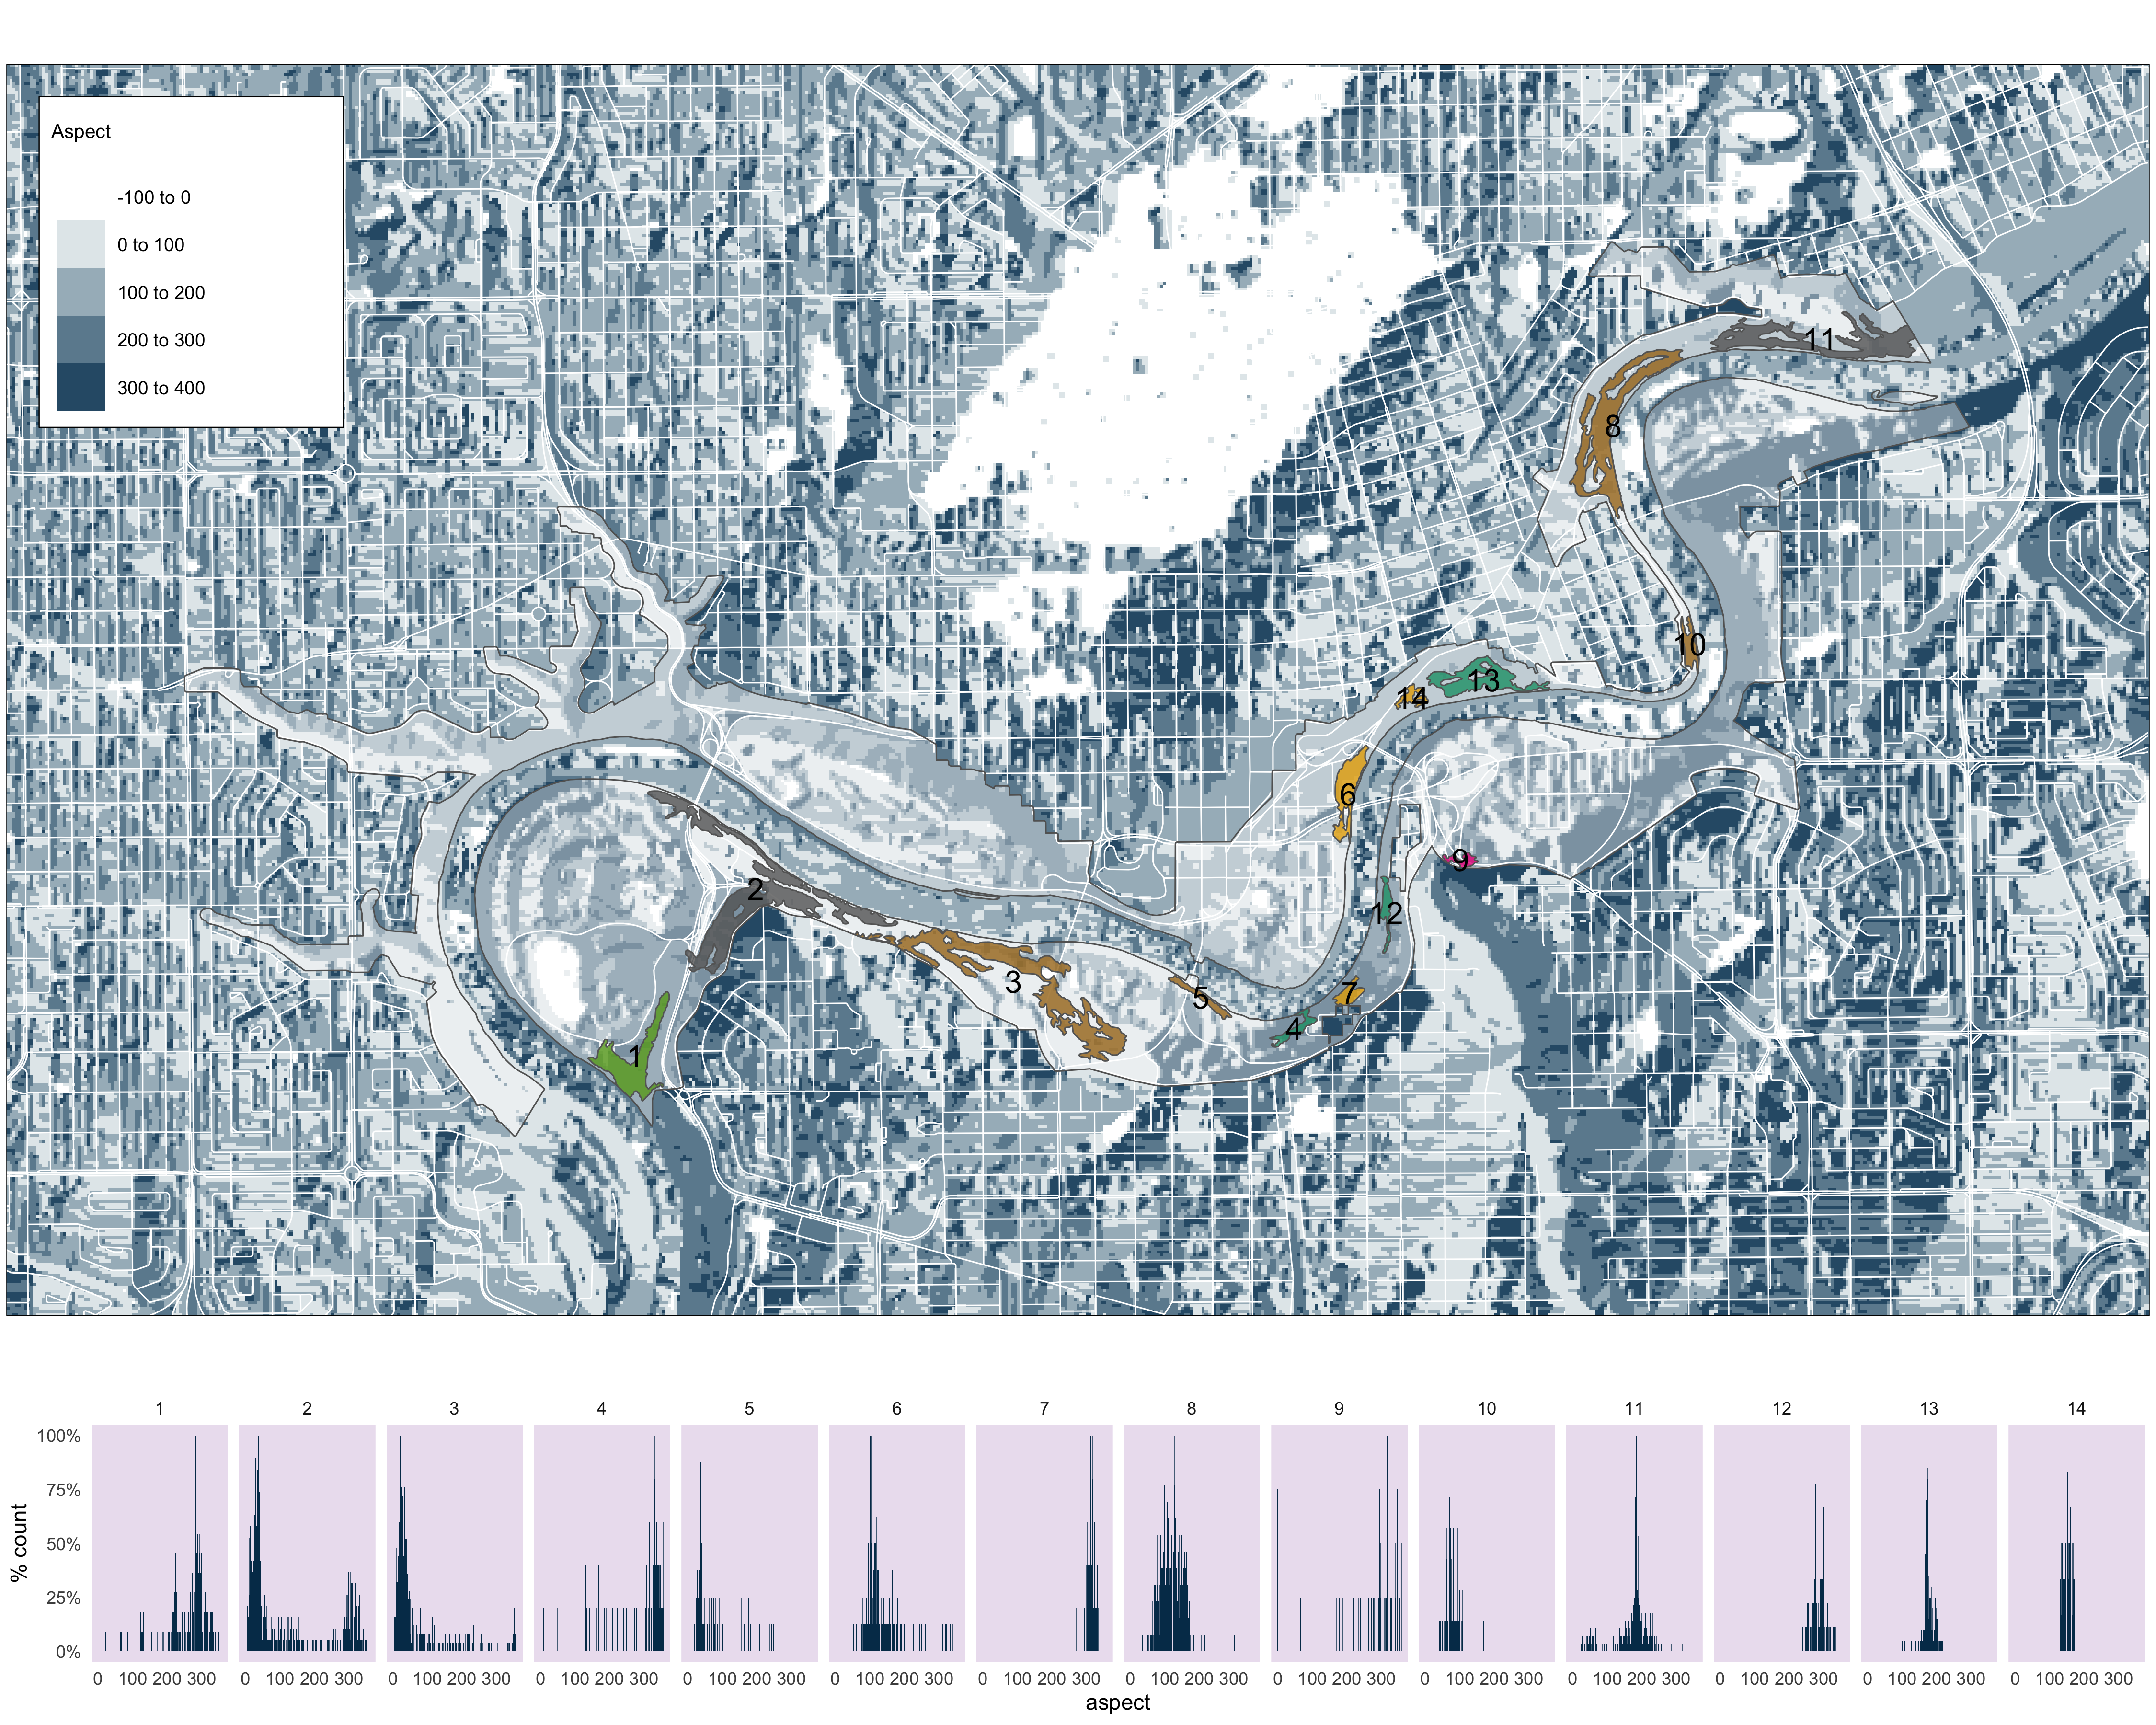
m5<-
  tm_shape(aspect_clip)+
    tm_raster(palette= c("white", "#023858"),
              title = "Aspect",
              contrast = c(0,.8))+
  tm_shape(v_road_clip)+tm_lines(col="white")+
  tm_layout(bg.col="#d9d9d9")+
  tm_shape(nscr)+
    tm_fill(col="white", alpha=.4)+
    tm_borders(col = "#636363")+
  tm_shape(pp_s_clip_clus)  +
    tm_fill(col="MAP_COLORS", palette = "Dark2", alpha=.8)+
    tm_borders(alpha=1)+
   tm_shape(pp_s_clip_clus_buf)+
    tm_text(text = "group",
          col="black",
          size = 1.3)+


  tm_layout(legend.outside = FALSE,
            legend.text.size = .8,
            legend.bg.color="white",
            legend.frame=TRUE,
            legend.title.size=1,
            legend.frame.lwd=.8,
            )
m5

g3<-tmap_grob(m5)


g4<-vd%>%
    ggplot(aes(x = aspect_clip)) +
    geom_histogram(binwidth=1, position = "identity", aes(y=..ncount..), fill="#023858") +
  #geom_density(alpha=.2, fill="#FF6666")+
    scale_y_continuous(labels = percent_format())+
  labs(x="aspect", y="% count")+
    theme(#panel.background = element_blank(),
          axis.ticks=element_blank(),
          strip.background =element_rect(fill="white"),
          panel.background = element_rect(fill="#ece2f0"),
          panel.grid.major = element_blank(),
          panel.grid.minor = element_blank())+
  facet_grid(~ID)
  # geom_vline(aes(xintercept=grp.mean),
  #           color="blue", linetype="dashed", size=1)+
g4


m3<-arrangeGrob(g3, g4, layout_matrix =lay2)

ggsave("4_output/maps/summary/raster_aspect_hist_map.png", m3, width=15, height=12)


######## Cell phone use ##############

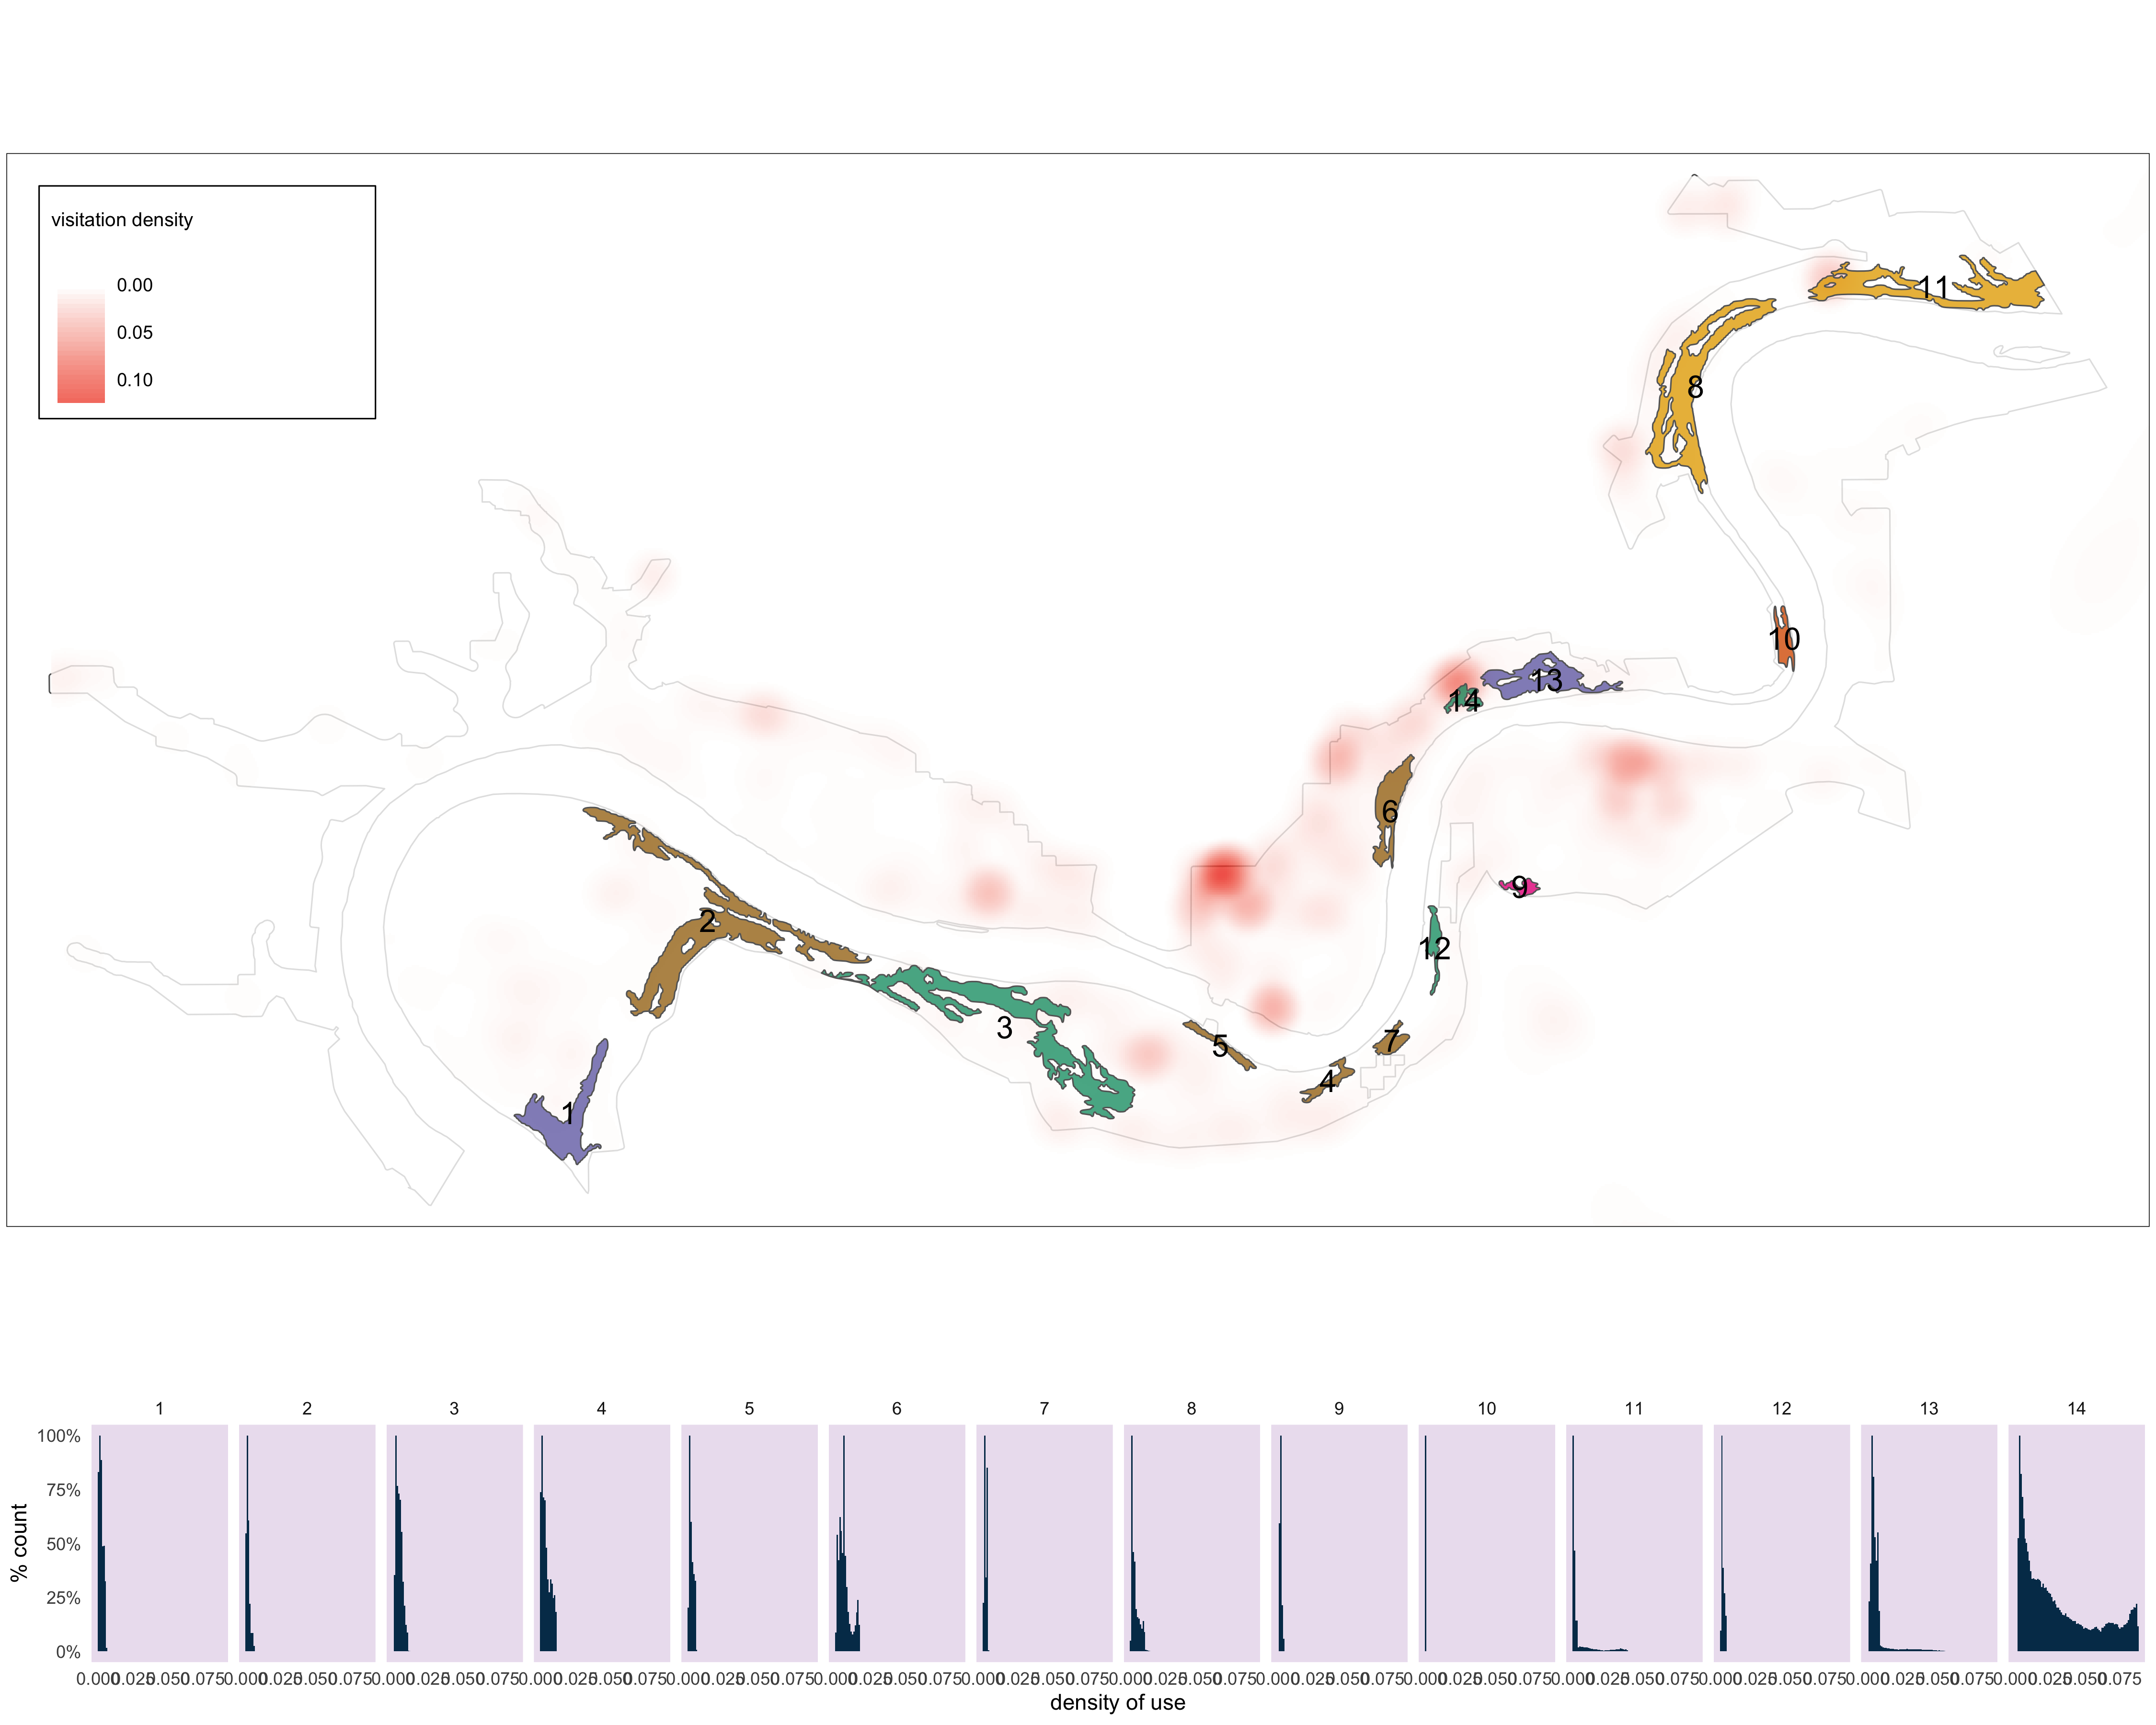
m6<-
  #tm_shape(v_road_clip)+tm_lines(col="#636363")+
  #tm_layout(bg.col="#d9d9d9")+
  tm_shape(nscr)+
    tm_fill(col="white", alpha=.4)+
    tm_borders(col = "#636363")+
  tm_shape(cell_clip)+
    tm_raster(palette = c("white", "#f03b20"),
      title = "visitation density",
              contrast = c(0, 1),
              style = "cont",
      alpha = .8)+
  tm_shape(pp_s_clip_clus)  +
    tm_fill(col="MAP_COLORS", palette = "Dark2", alpha=.8)+
    tm_borders(alpha=1)+
   tm_shape(pp_s_clip_clus_buf)+
    tm_text(text = "group",
          col="black",
          size = 1.3)+
  tm_layout(legend.outside = FALSE,
            legend.text.size = .8,
            legend.bg.color="white",
            legend.frame=TRUE,
            legend.title.size=1,
            legend.frame.lwd=1,
            )
m6

g5<-tmap_grob(m6)

poly<-pp_s_clip_clus_buf_ext
#poly$ID <- 1:length(poly)
poly$layer <- NULL
d <- data.frame(poly)
v<-extract(cell_clip,  poly, na.rm=TRUE, df=TRUE)

vd <- merge(d, v, by="ID")
vd<- vd[-c(3)]


g6<-vd%>%
    ggplot(aes(x = Visitation_Density_InclRoads_20210625)) +
    geom_histogram(binwidth=.001, position = "identity", aes(y=..ncount..), fill="#023858") +
  #geom_density(alpha=.2, fill="#FF6666")+
    scale_y_continuous(labels = percent_format())+
  labs(x="density of use", y="% count")+
    theme(#panel.background = element_blank(),
          axis.ticks=element_blank(),
          strip.background =element_rect(fill="white"),
          panel.background = element_rect(fill="#ece2f0"),
          panel.grid.major = element_blank(),
          panel.grid.minor = element_blank())+
  facet_grid(~ID)
  # geom_vline(aes(xintercept=grp.mean),
  #           color="blue", linetype="dashed", size=1)+
g6


m7<-arrangeGrob(g5, g6, layout_matrix =lay2)

ggsave("4_output/maps/summary/raster_cell_hist_map.png", m7, width=15, height=12)
Figure 3.8: Histograms of slope values for each pinch point.

Figure 3.9: Histograms of aspect values for each pinch point.

Figure 3.10: Histograms of cellphone density values for each pinch point.