Multivariate maps
Multivariate plots summarizing composition of pinch-point buffers.
Slope
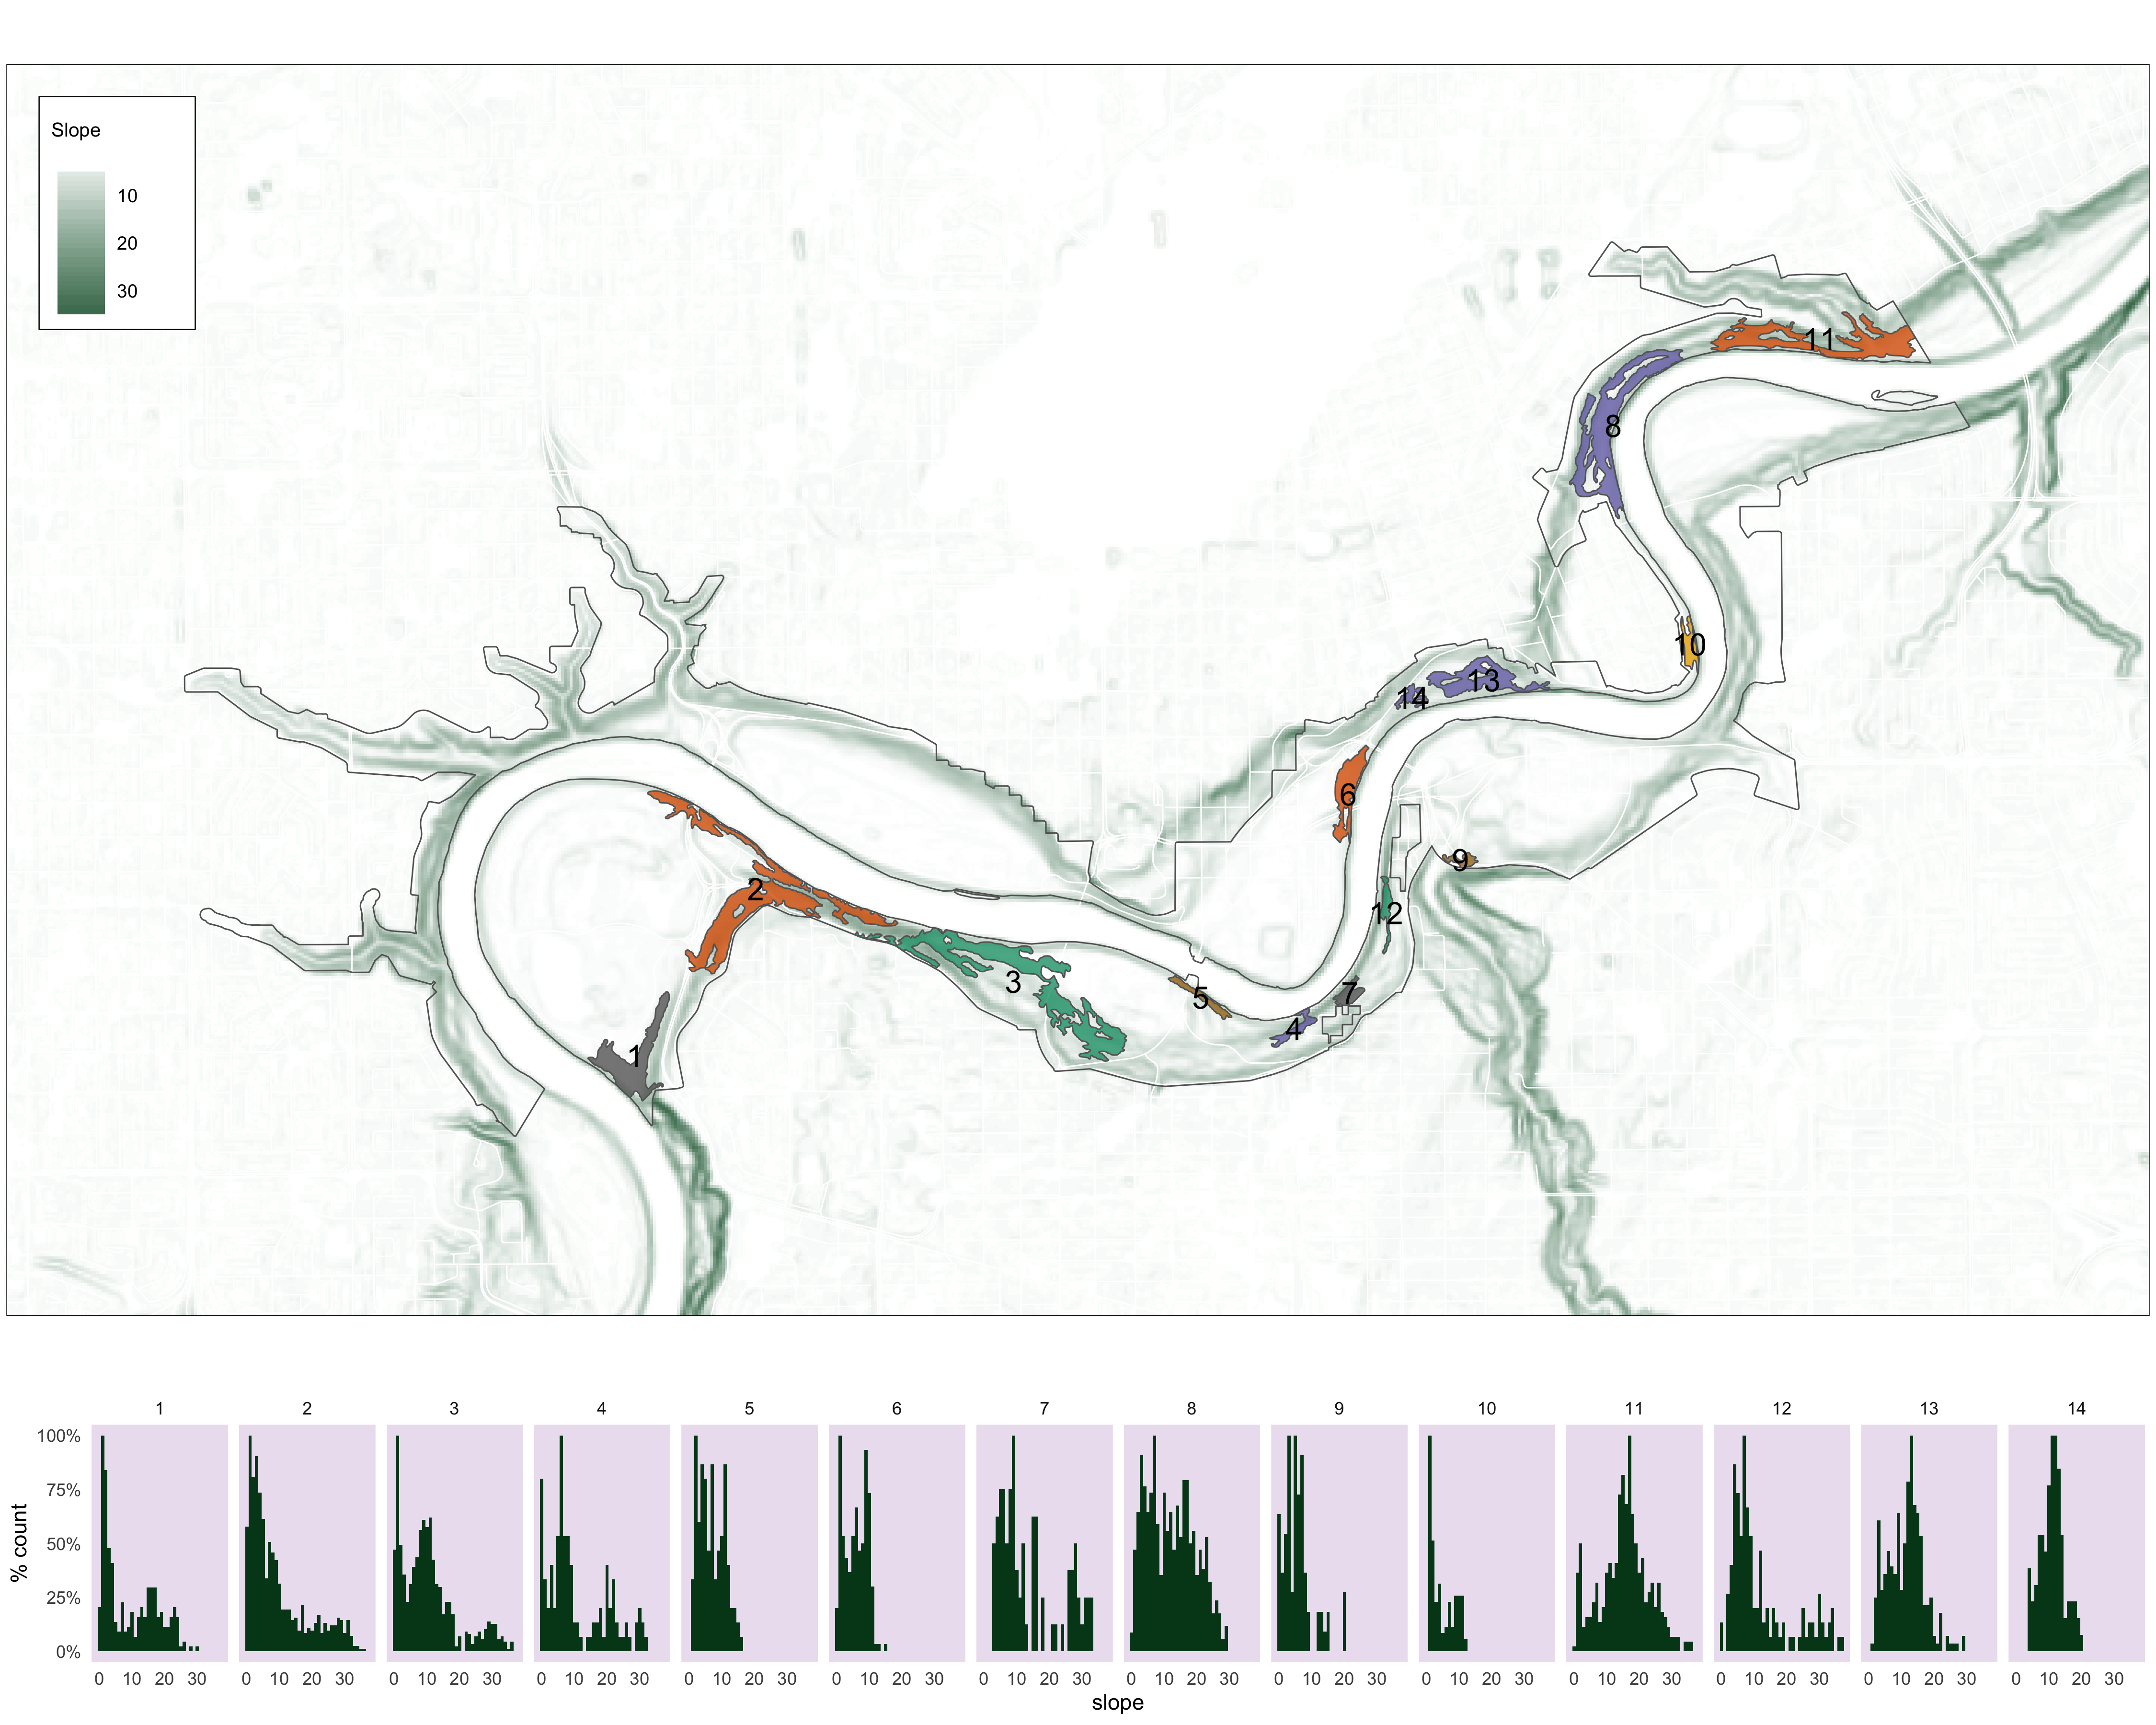
Figure 4.25: Histograms of slope values for each pinch point.
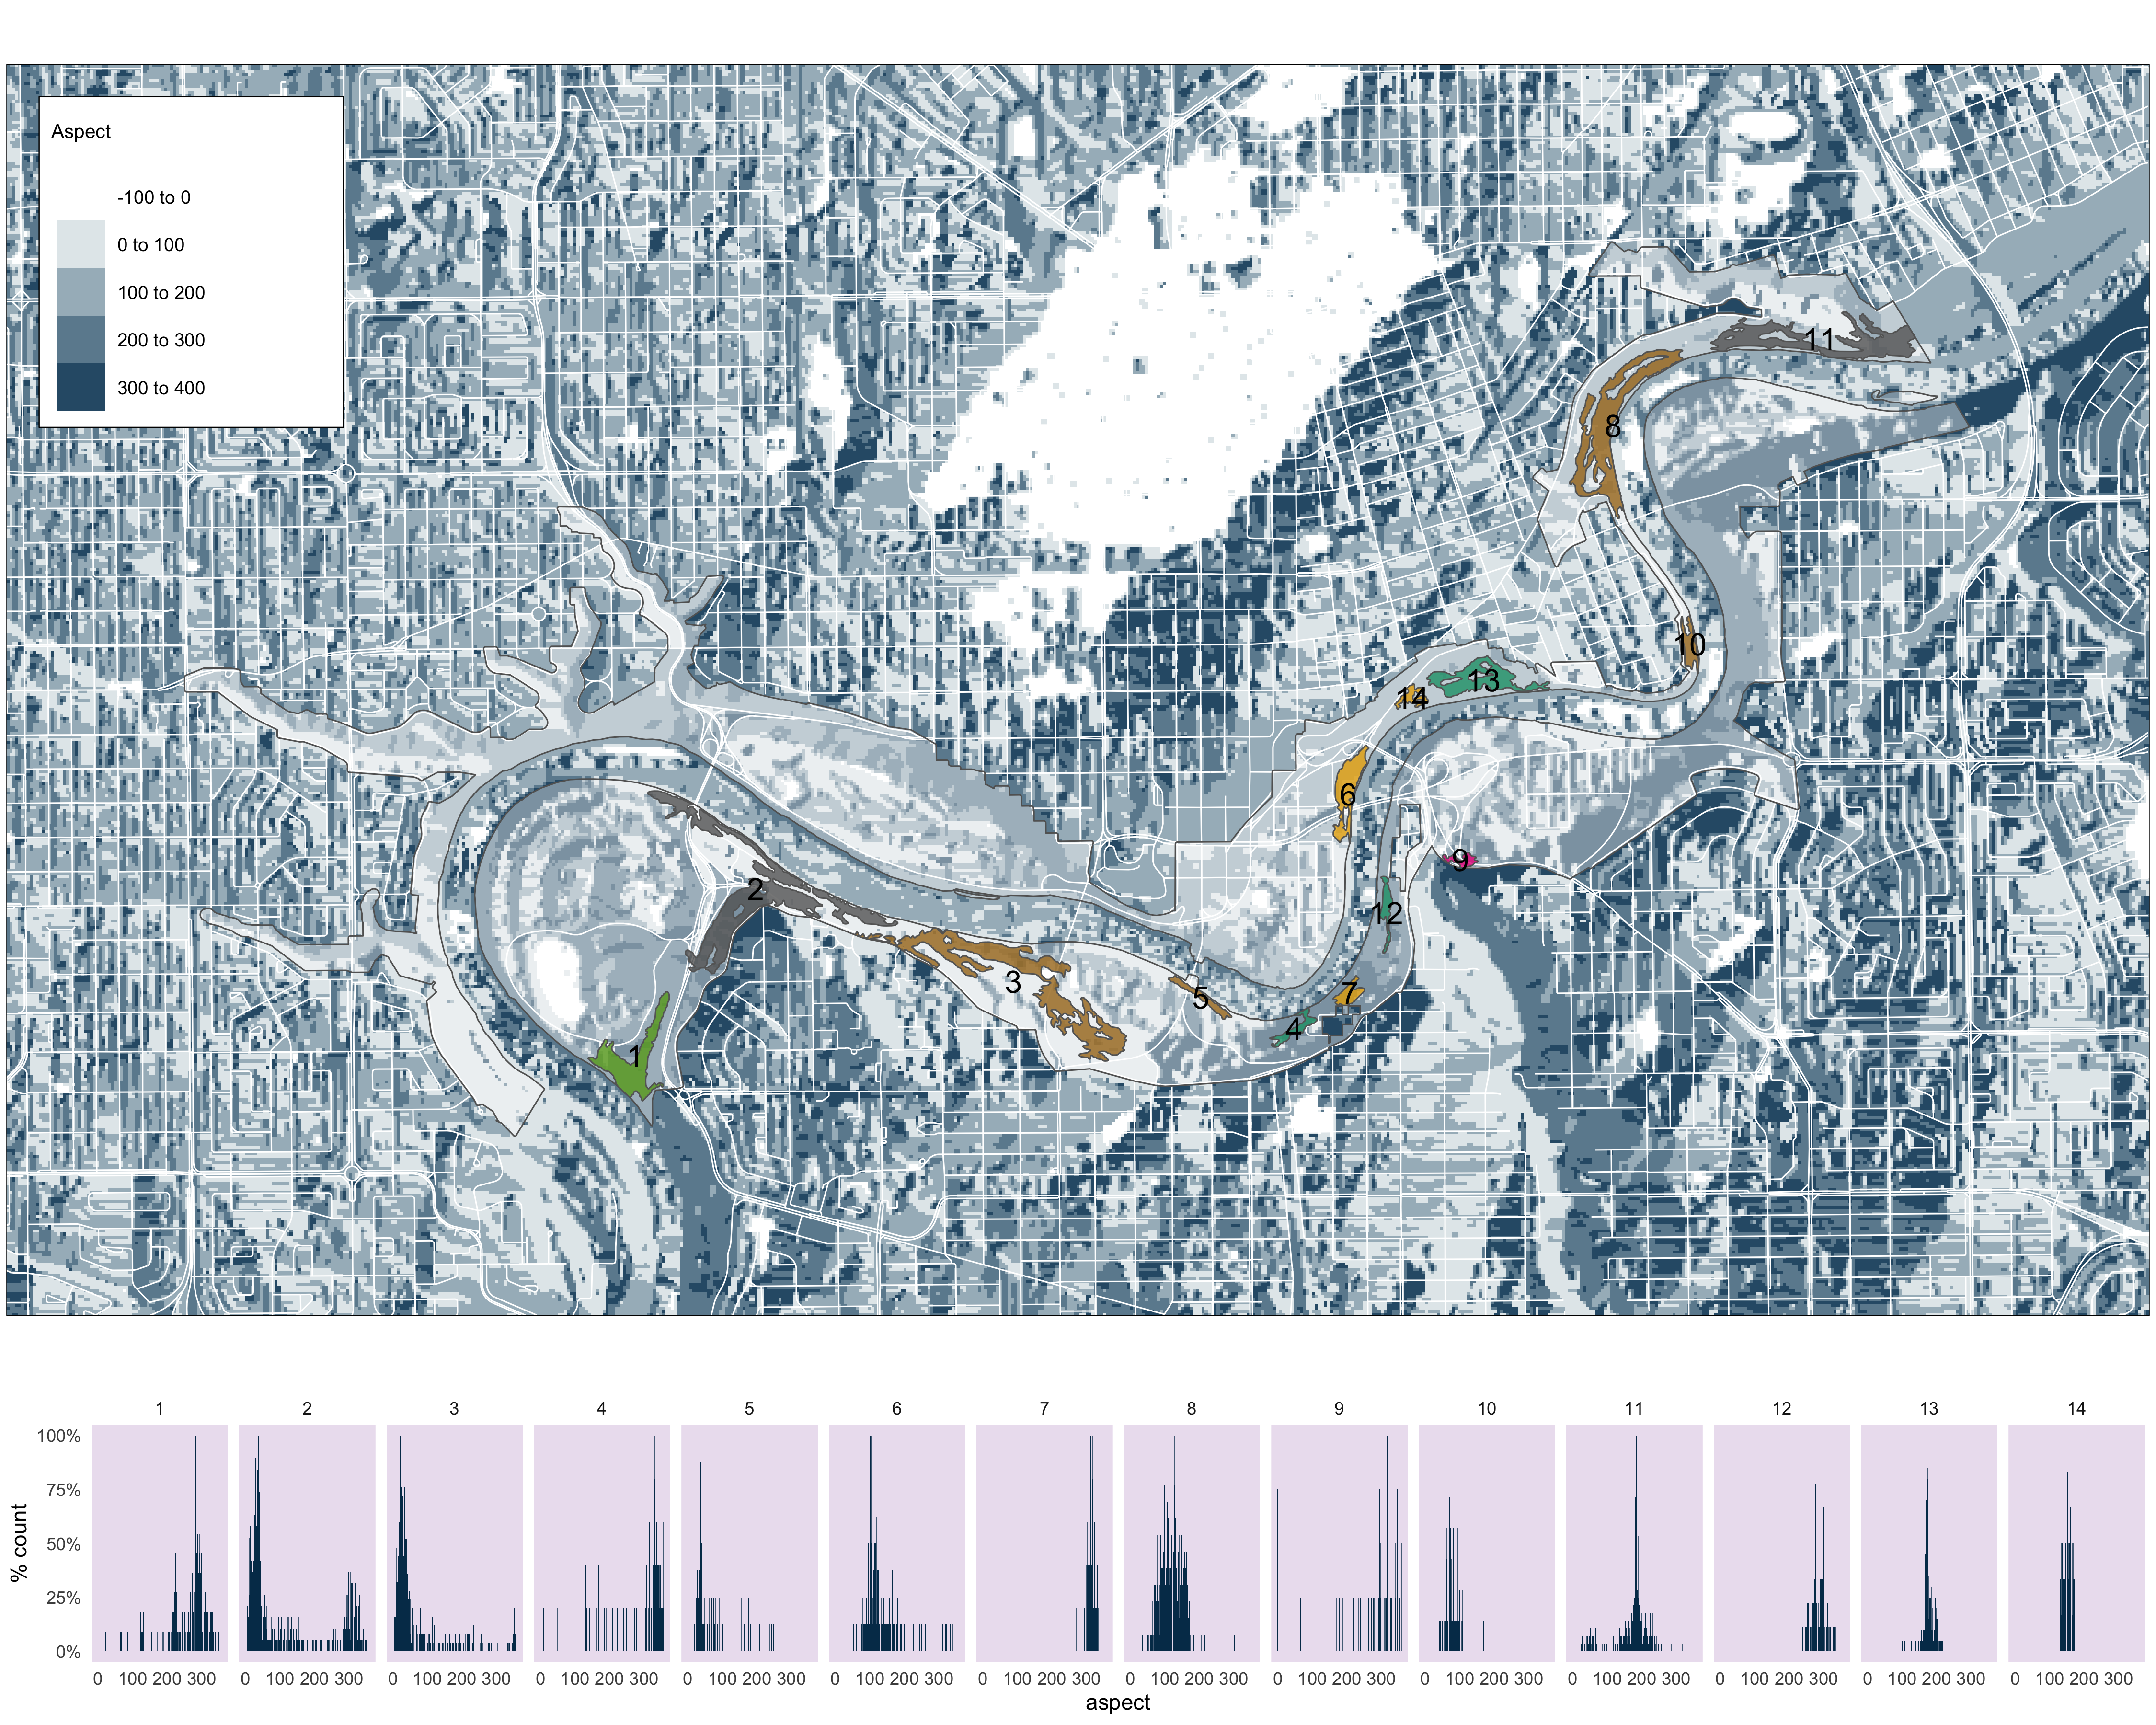
Figure 4.26: Histograms of aspect values for each pinch point.
Vegetation cover
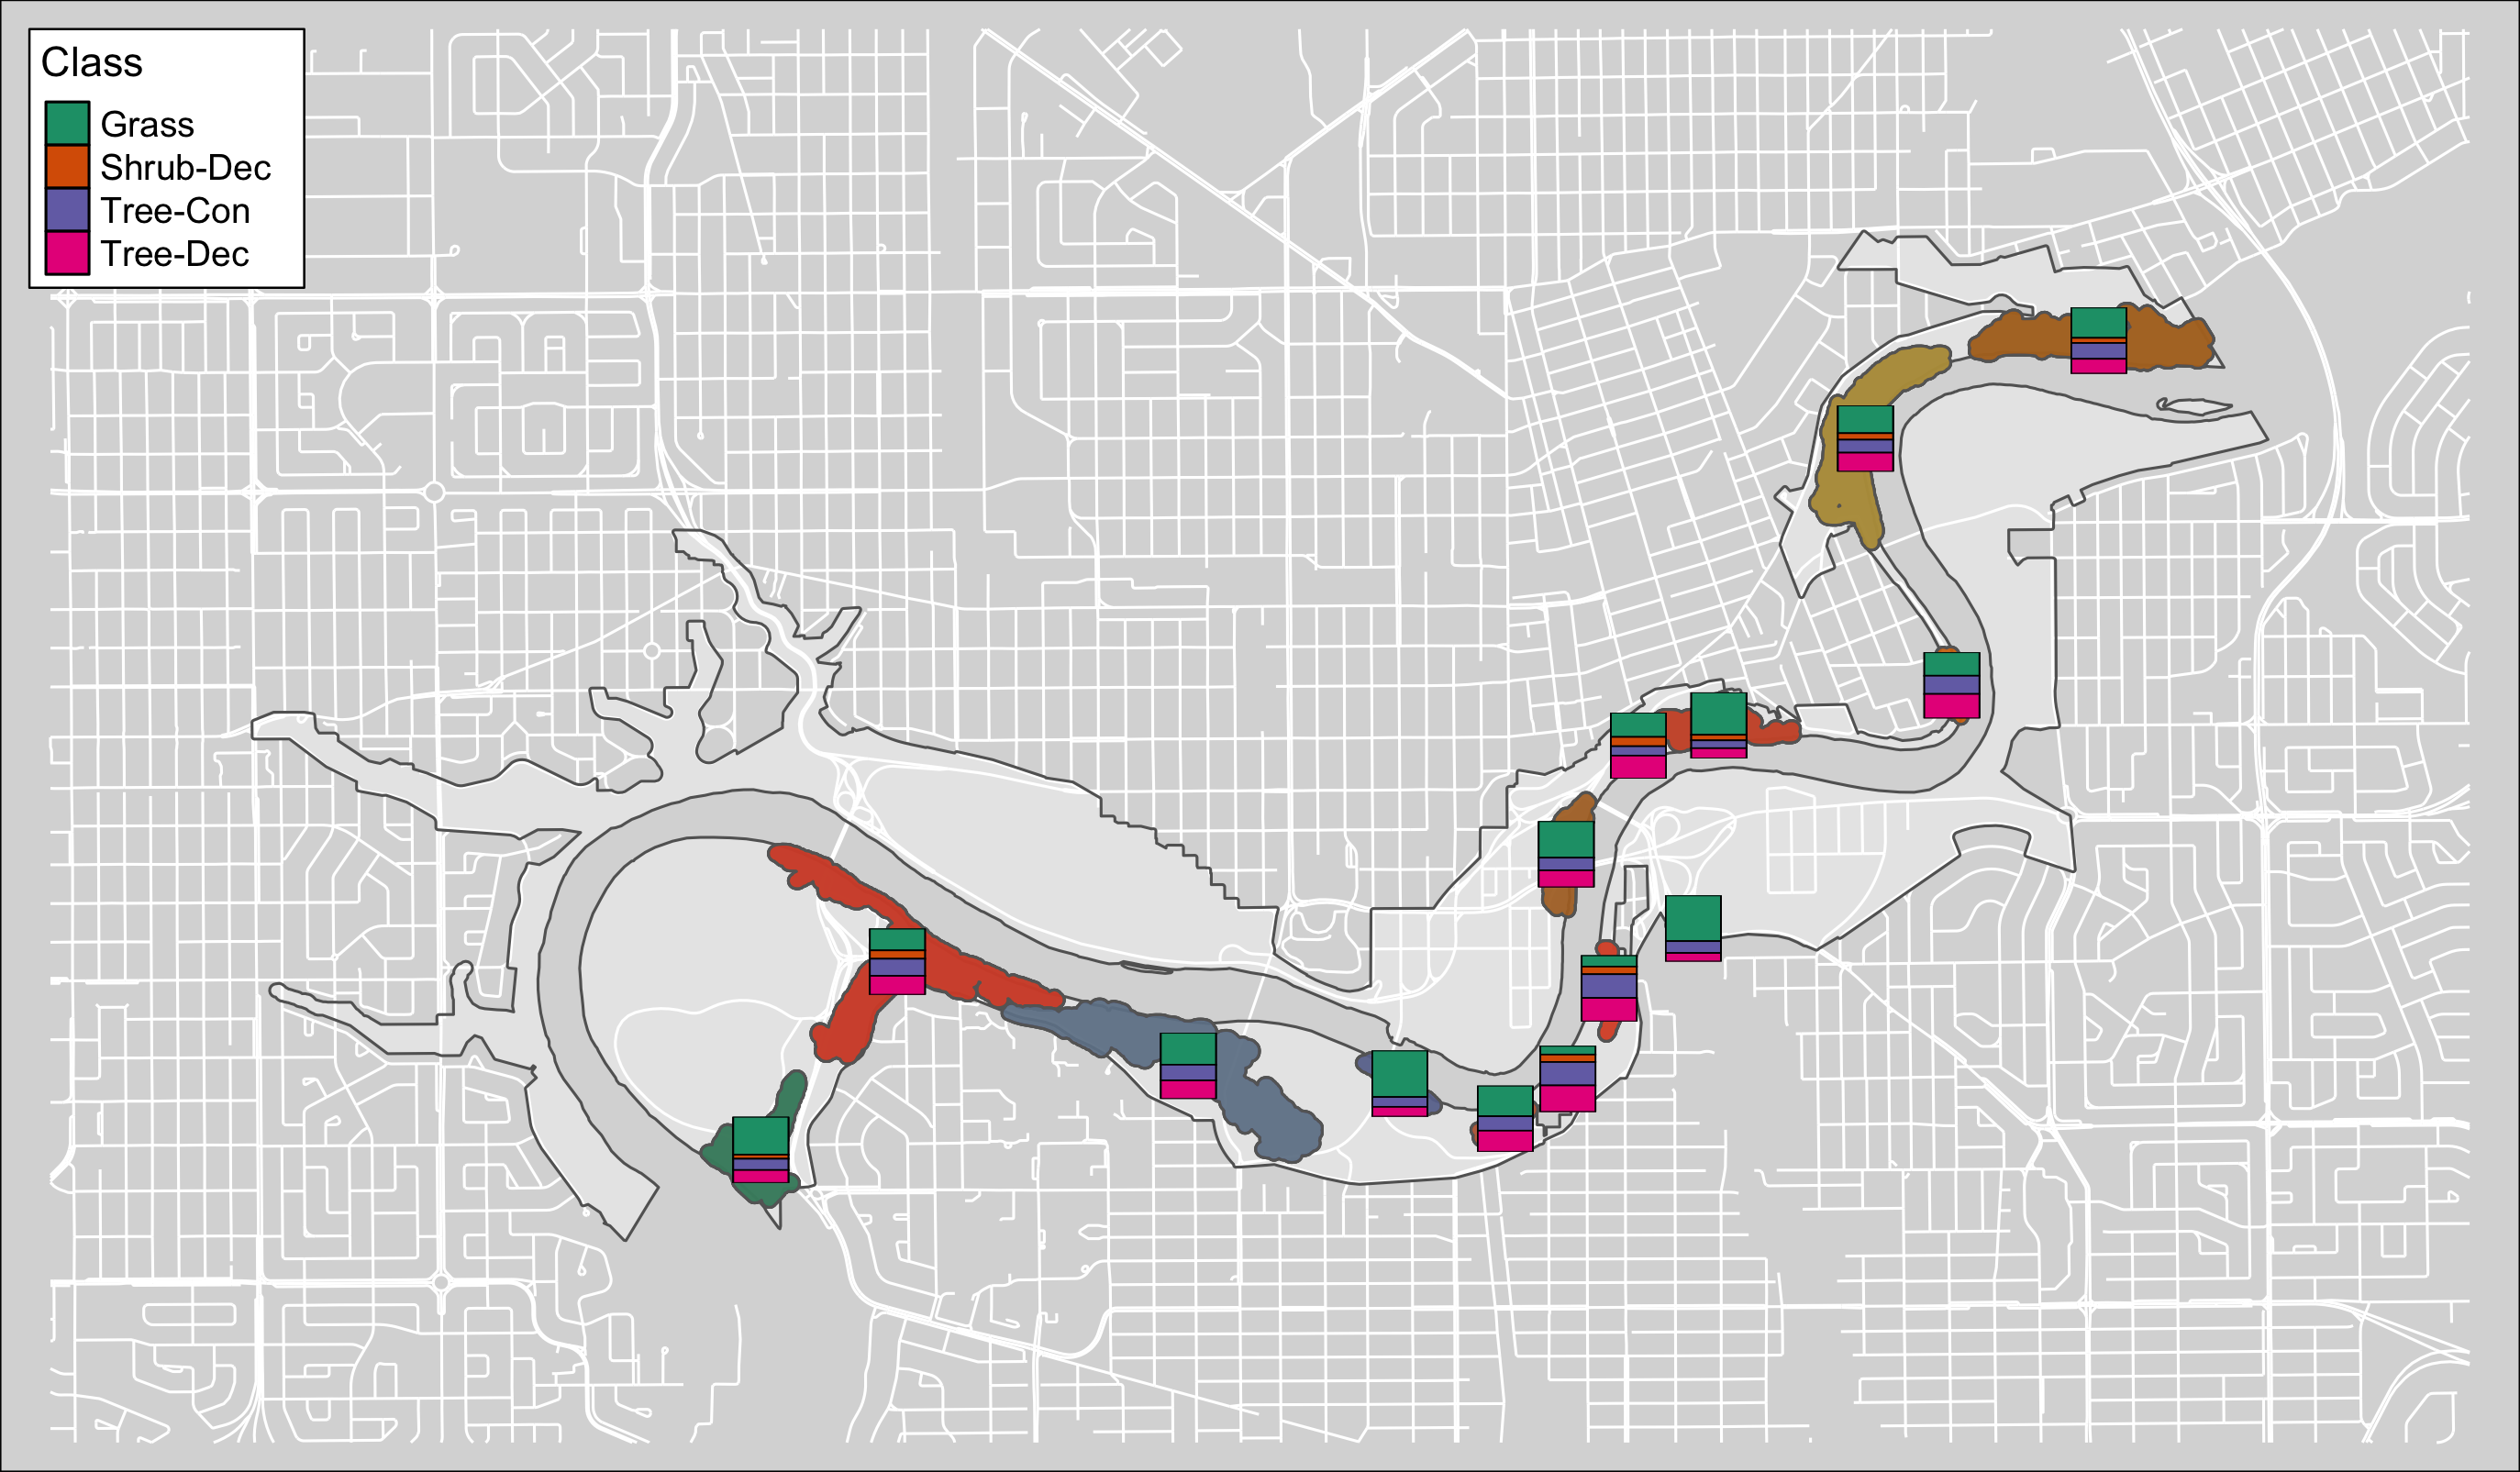
Figure 4.27: Canopy poly class map #1.
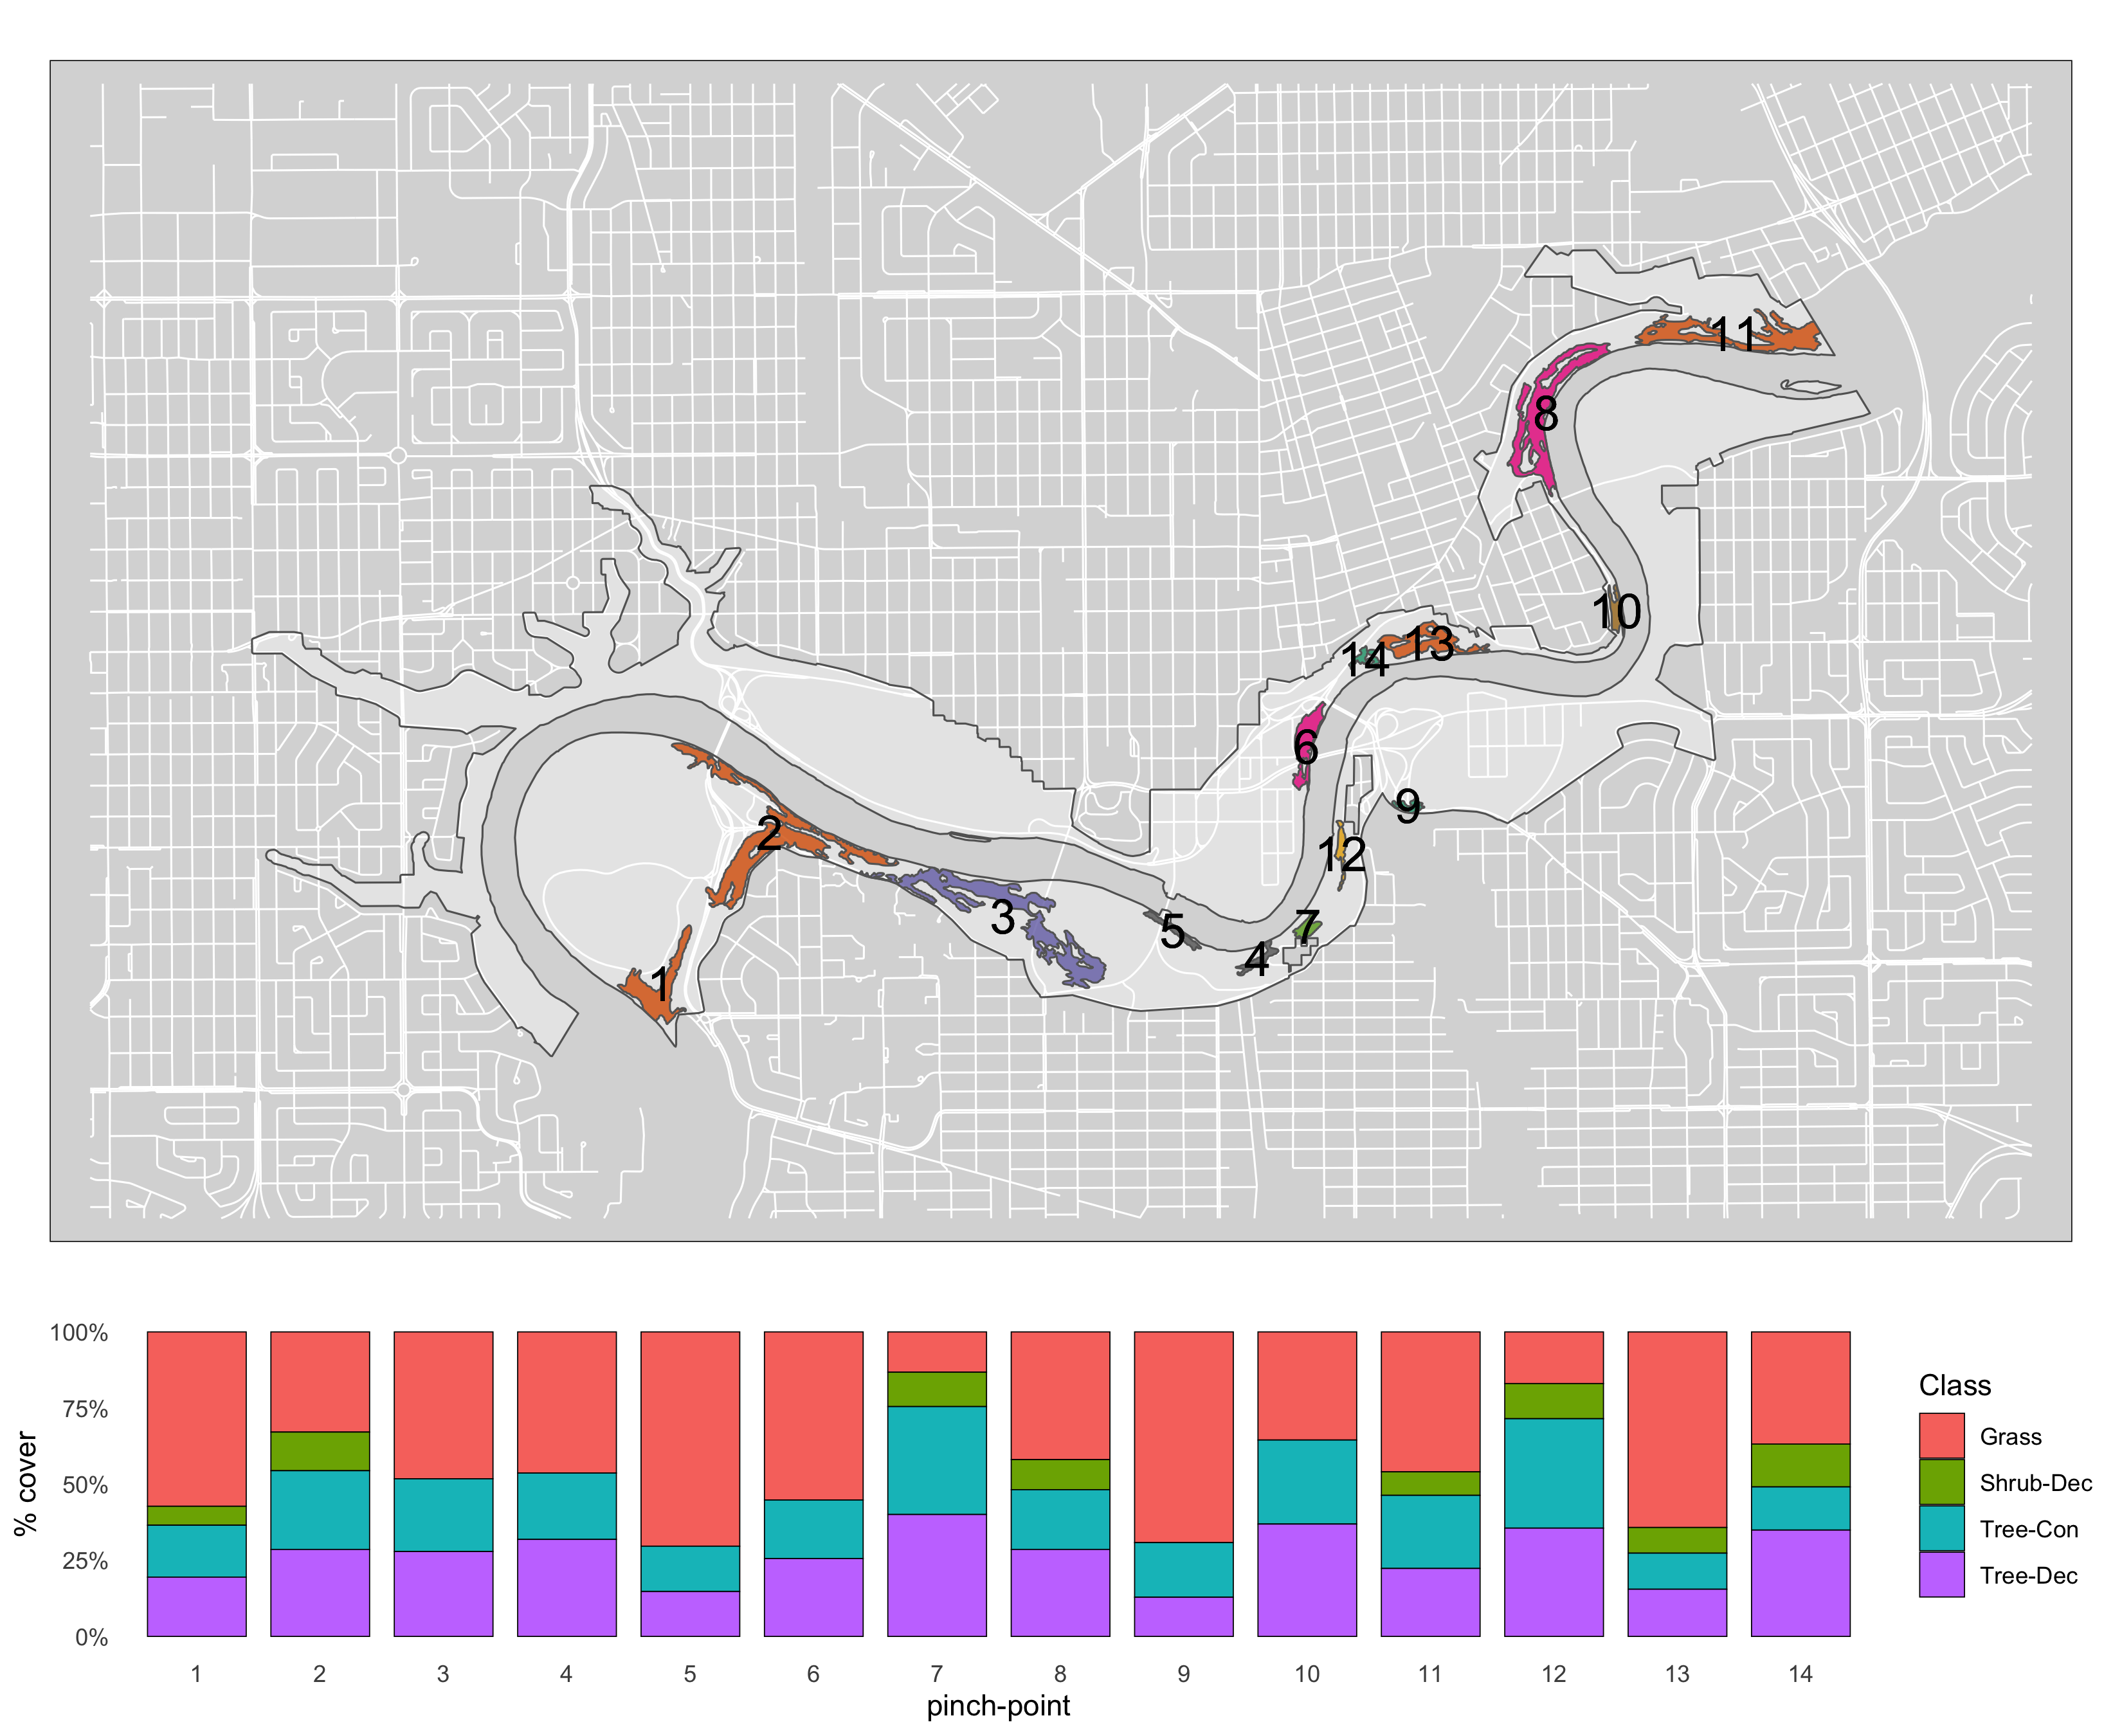
Figure 4.28: Canopy poly class map #2.
Landcover
Data was from the UPLVI layer.
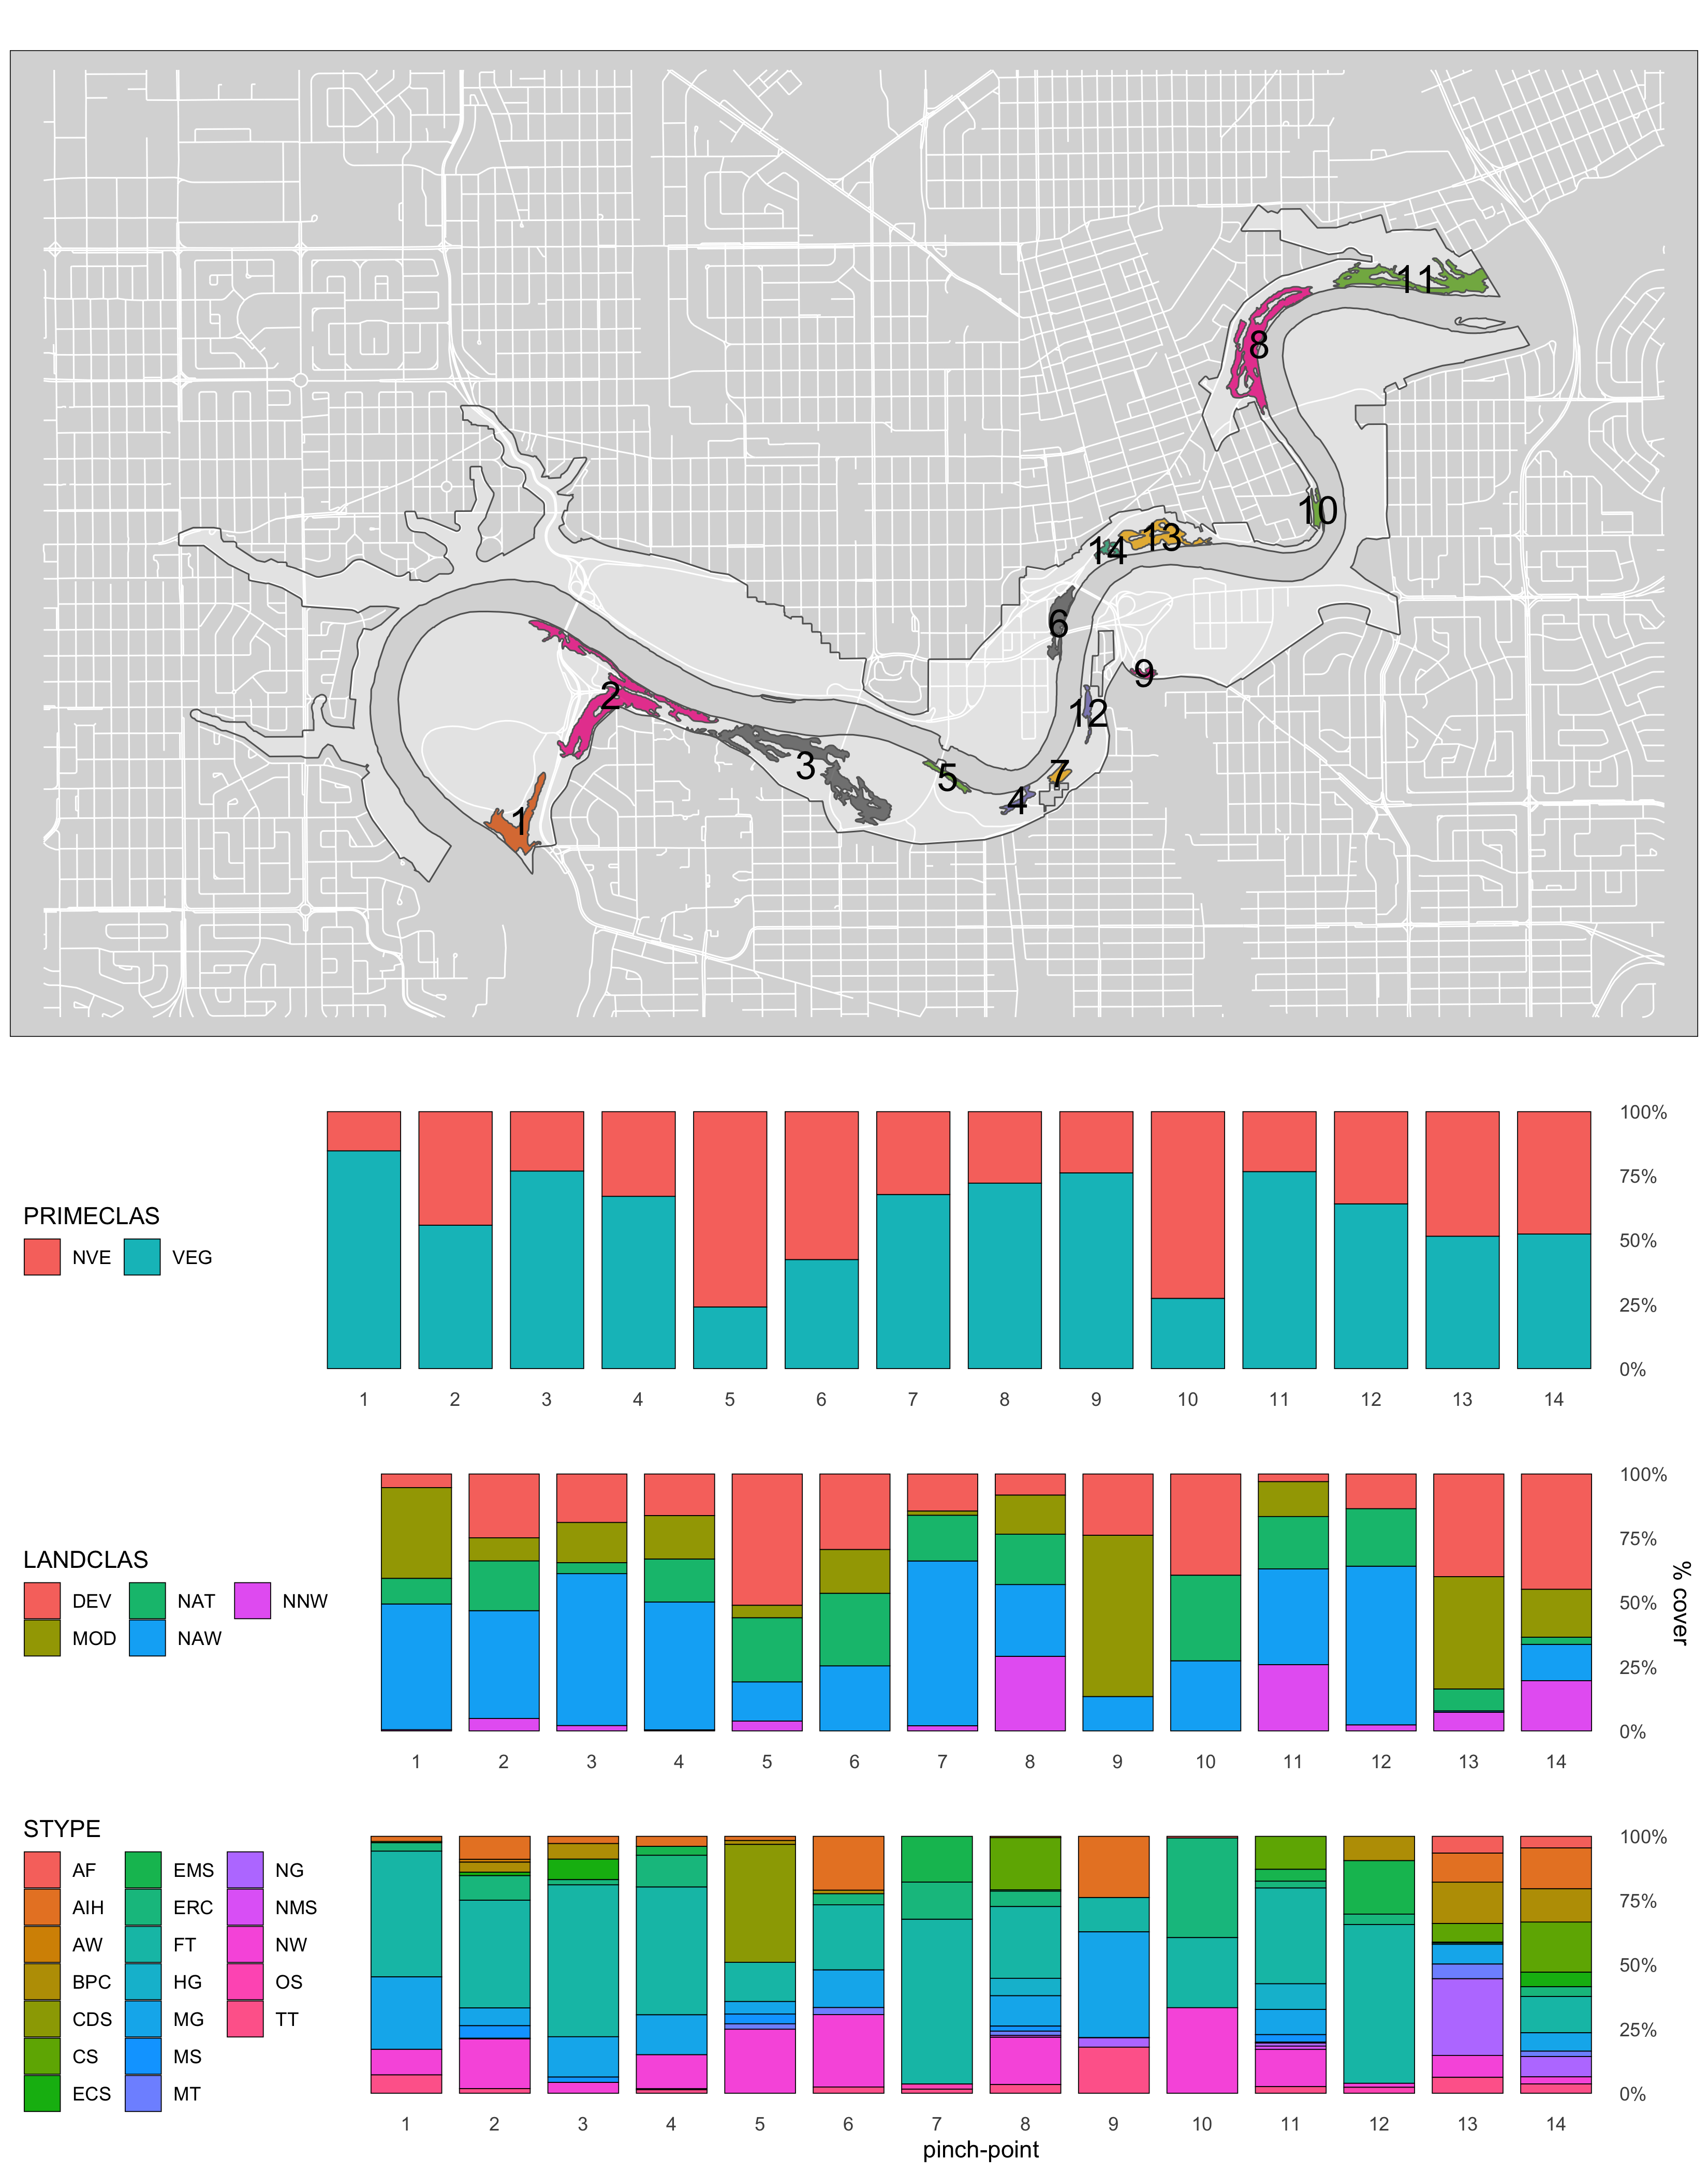
Figure 4.29: Canopy poly class map #2.
4.0.2 Linear features
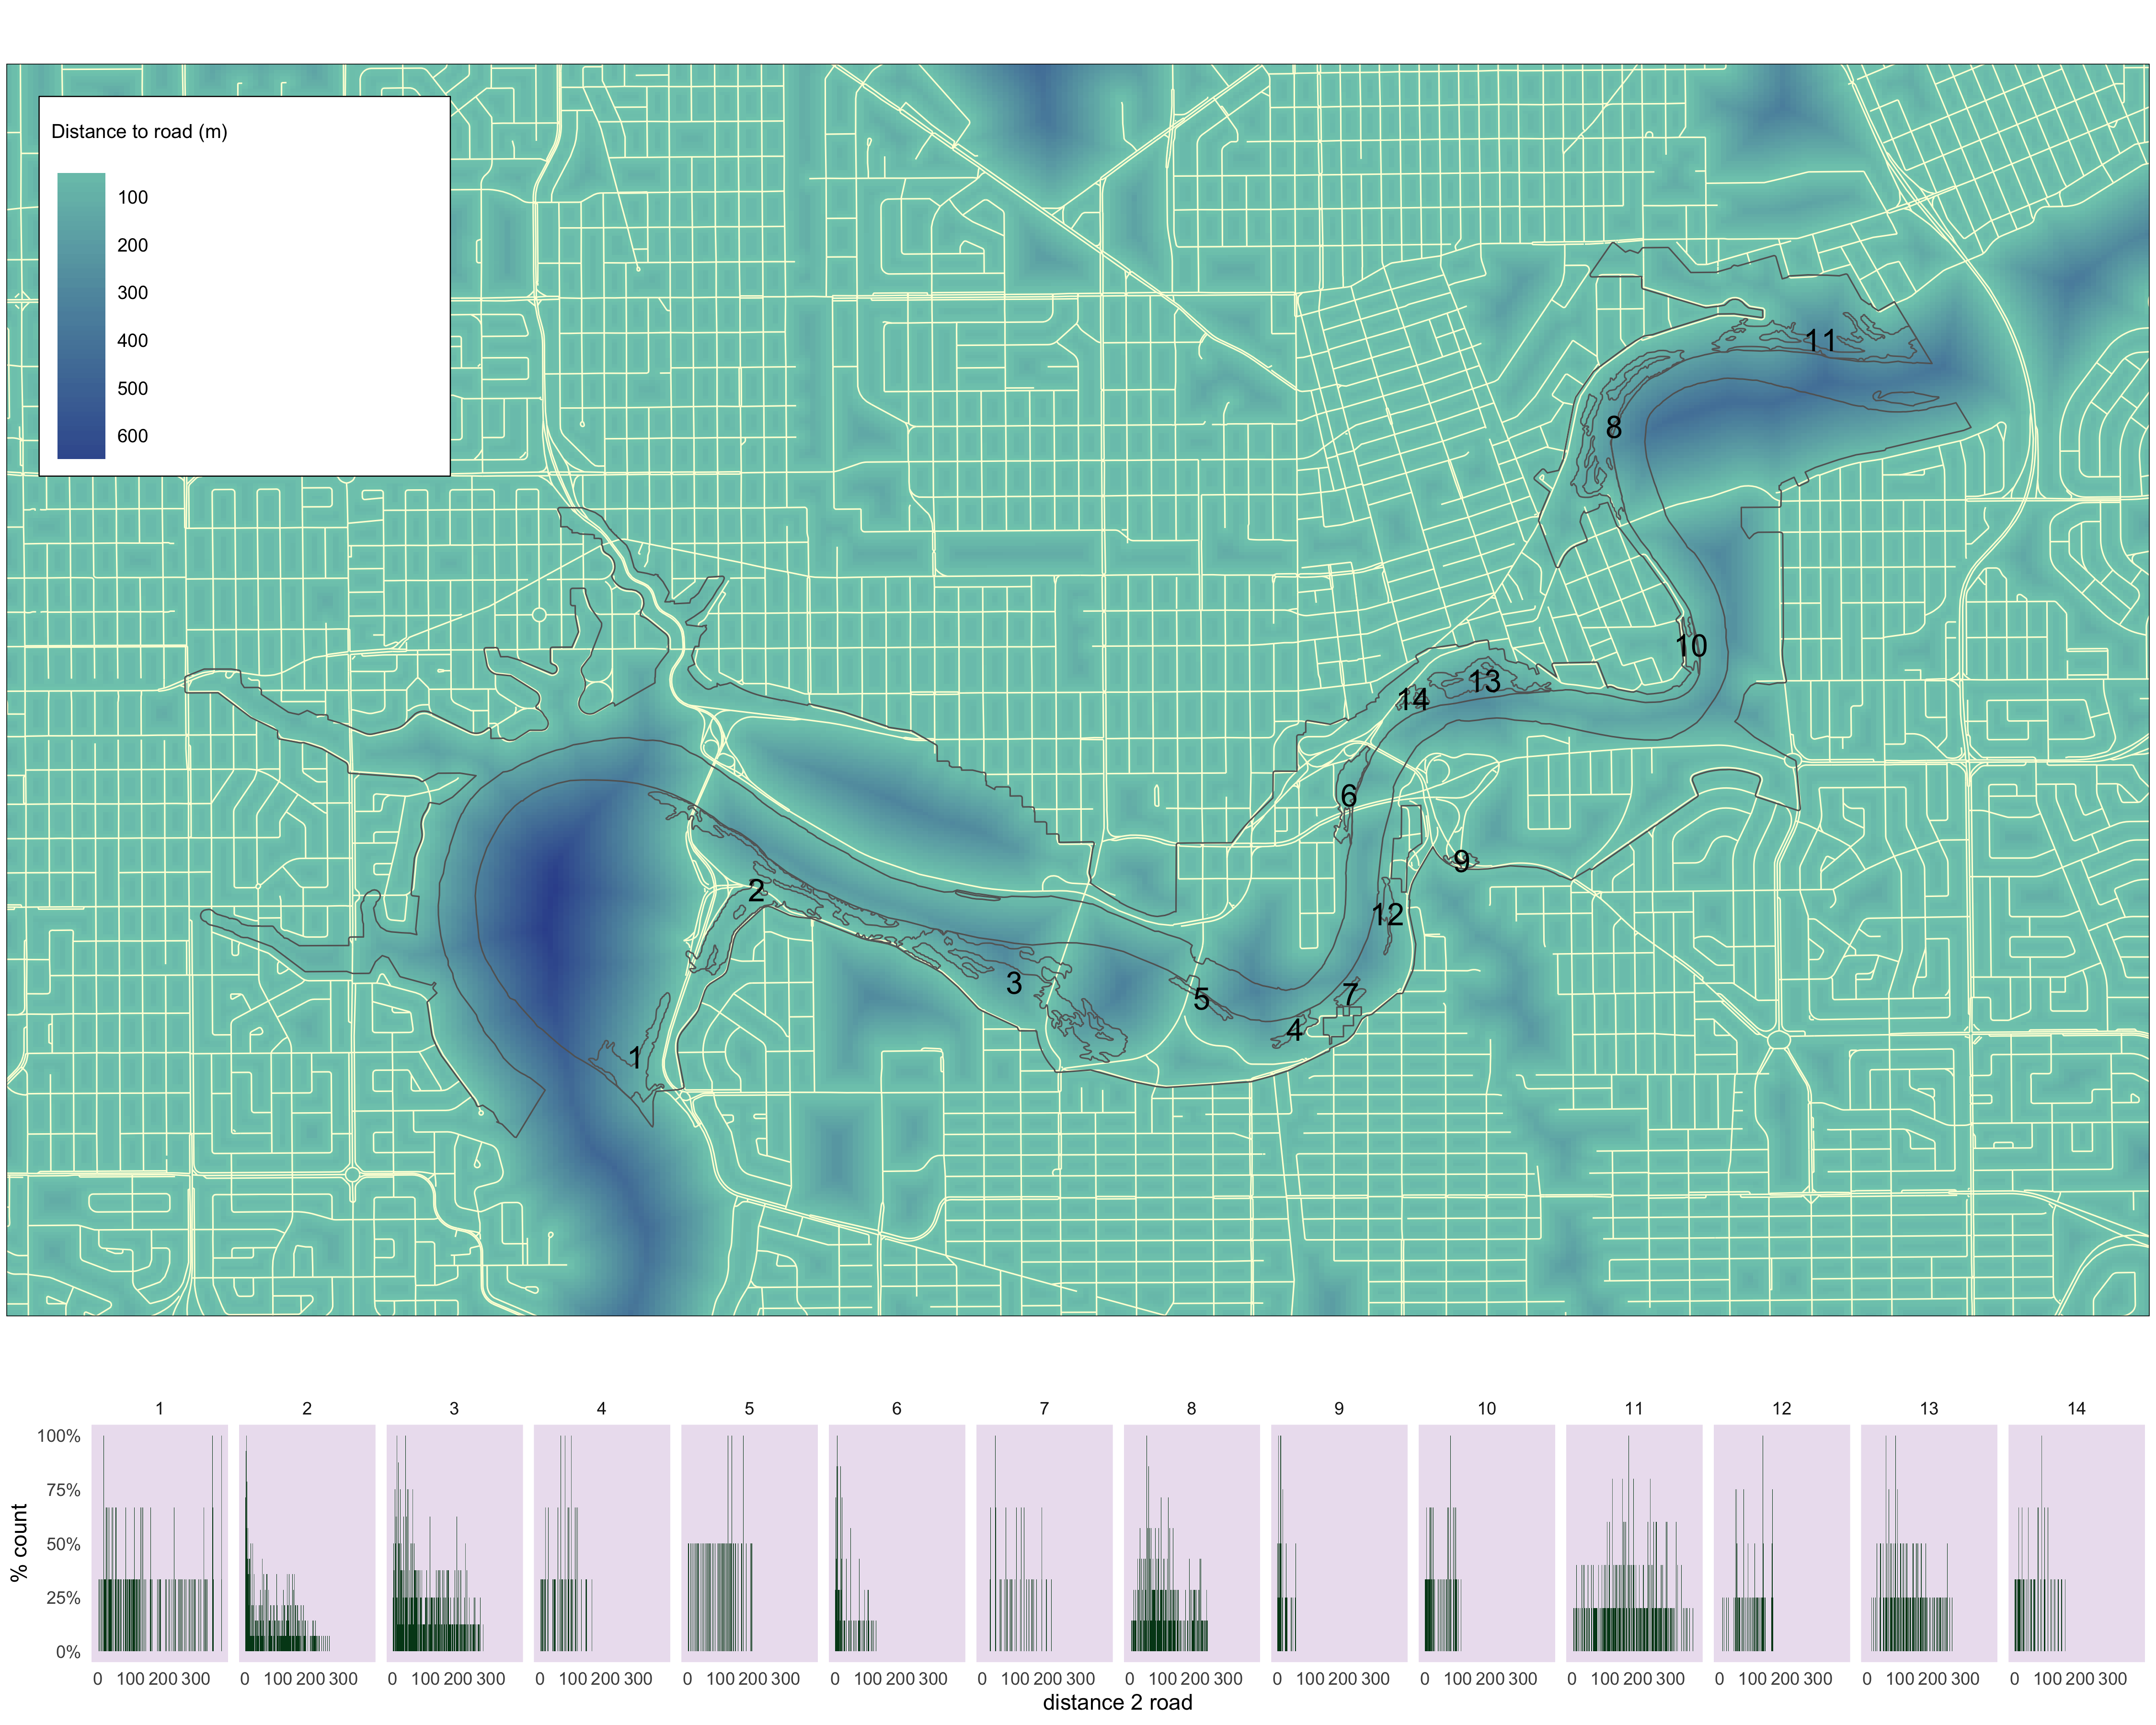
Figure 4.30: Histograms of distance to road values for each pinch point.
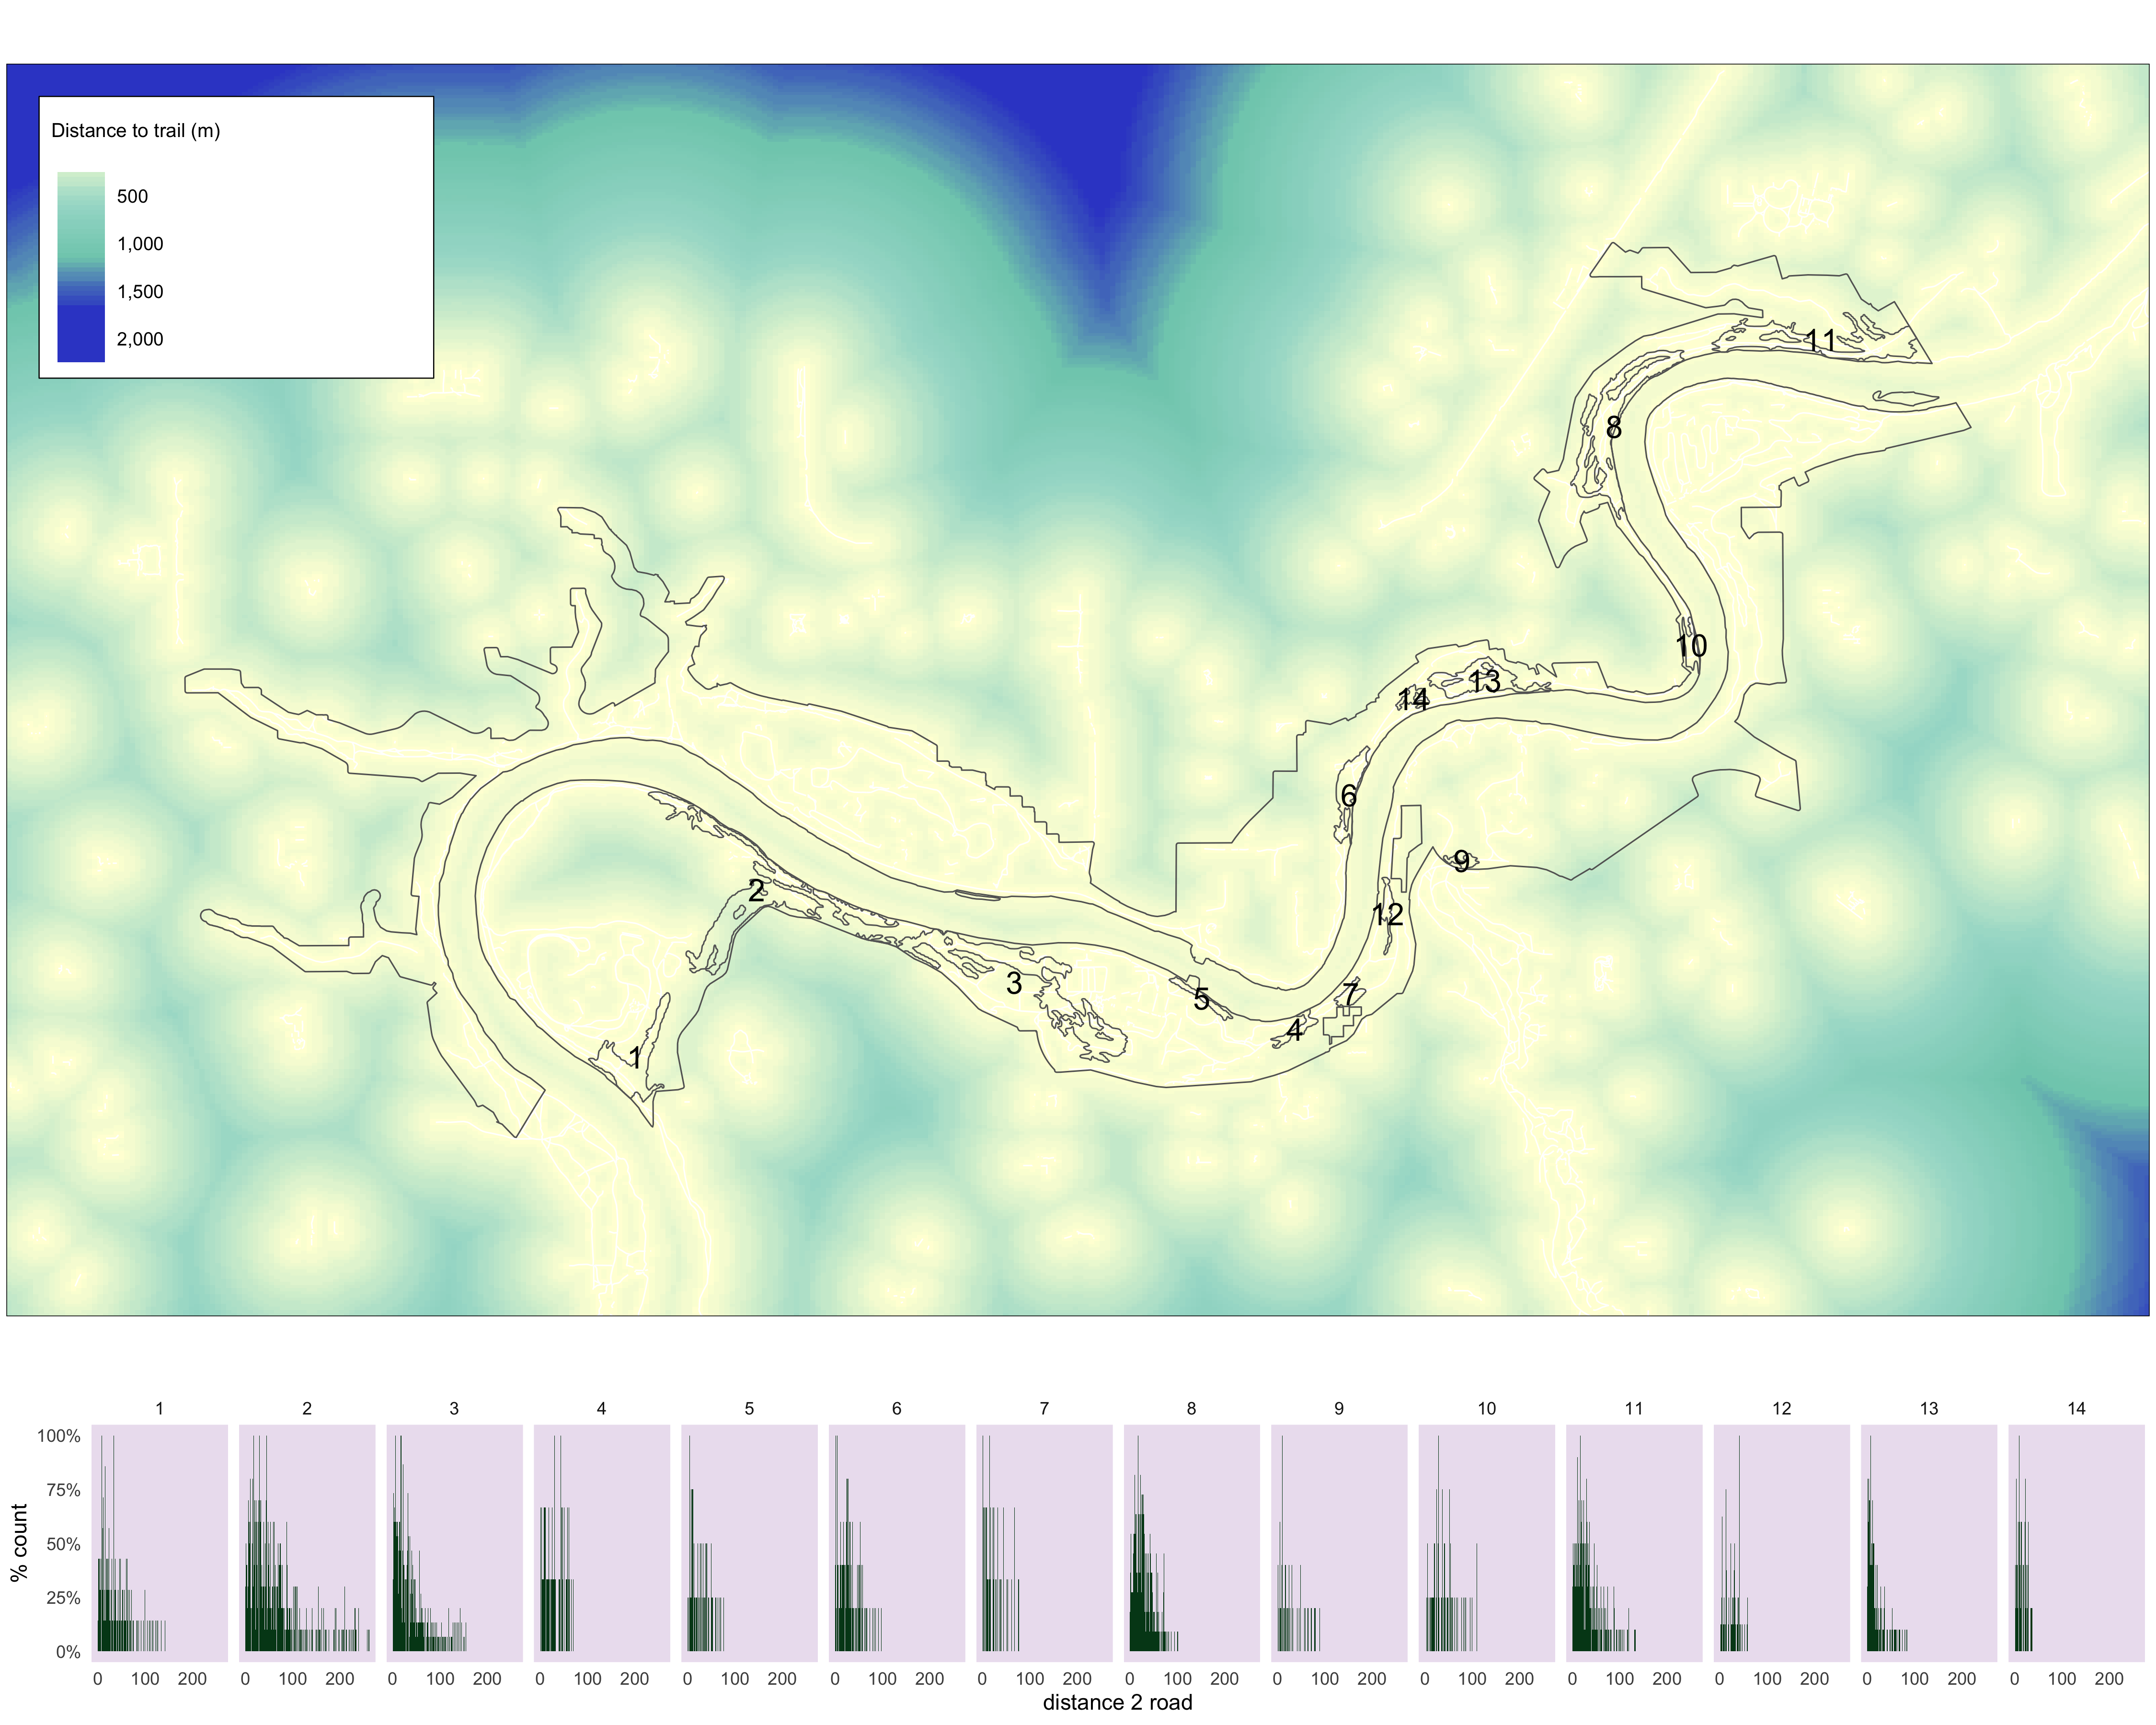
Figure 4.31: Histograms of distance to trail values for each pinch point.