Section 21 Outliers and Errors
Geospatial Analysis
The plots below show the data fields obtained through enrichment. Visualisation seems the most appropriate method for evaluating whether the Enrichment process was a success. Those data fields which do not offer a straightforward interpretation are likely to be unreliable.
I used the R package sp to plot the c.21613 individual properties onto a map. The first 200 pages of (Bivand et al. 2008) give a detailed practical guide to using the sp package for further research. To improve the visual clarity of the images, I aggregated properties according to a 200m by 200m grid. I then calculated average values by grid cell and plotted the results below.
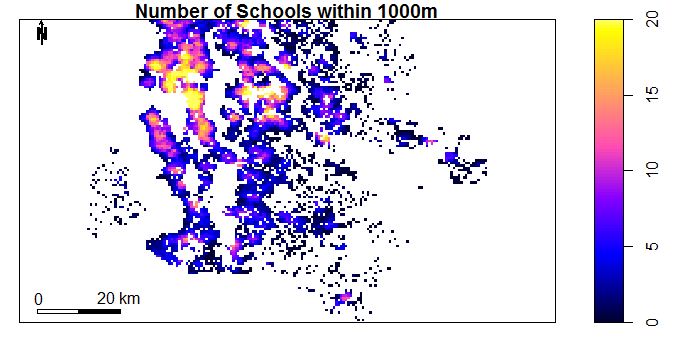
Figure 21.1: Number of Schools within 1000m by Location
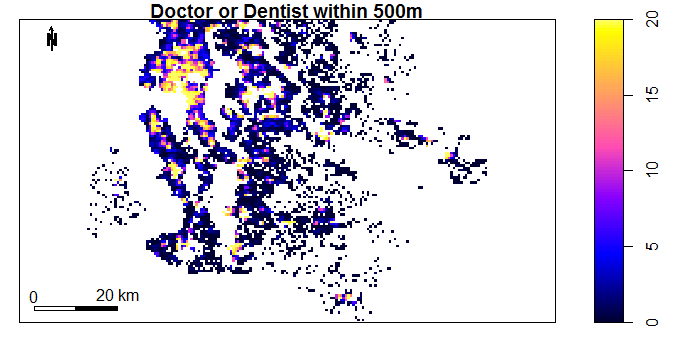
Figure 21.2: Number of Doctors or Dentists within 500m by Location
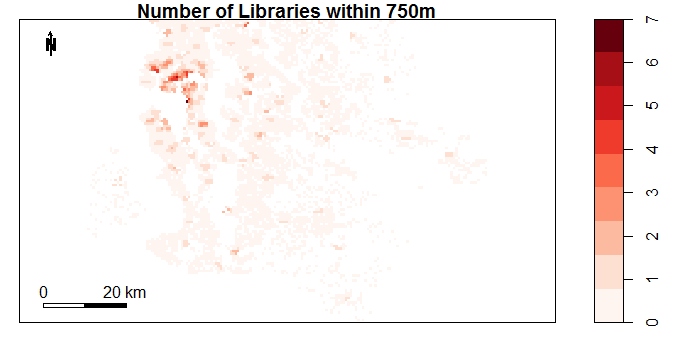
Figure 21.3: Number of Doctors or Dentists within 500m by Location
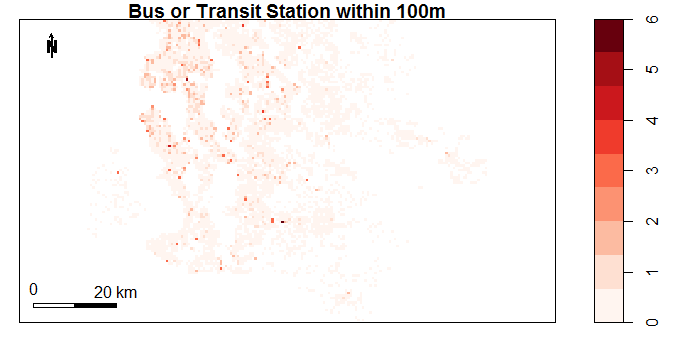
Figure 21.4: Number of Doctors or Dentists within 500m by Location
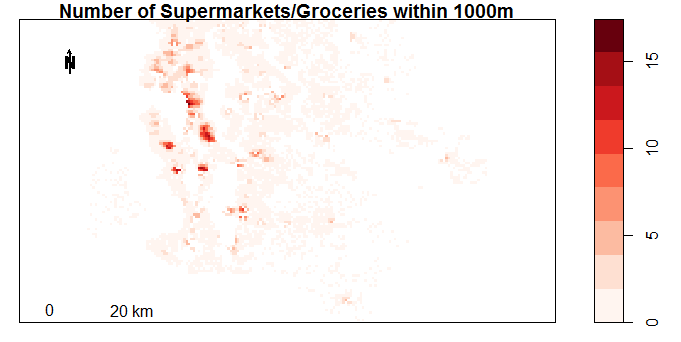
Figure 21.5: Number of Doctors or Dentists within 500m by Location
Some variables display surprisingly little variation by location. It makes sense that the density of police stations in Figure 21.6 is approximately constant throughout the region. This would ensure response police times are consistent.
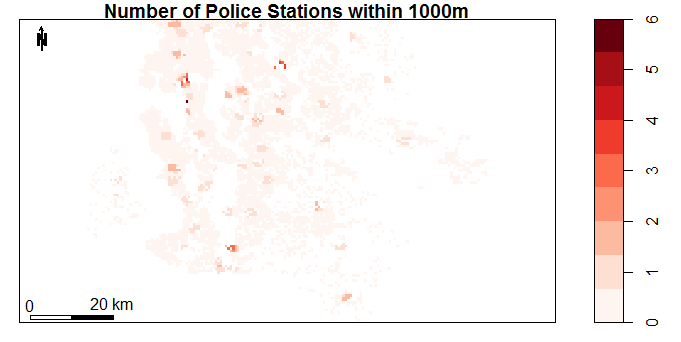
Figure 21.6: Number of Doctors or Dentists within 500m by Location
Department stores and malls are concentrated in a few hot-spots in 21.7. This is consistent with large out of town, destination shopping malls common in the USA.
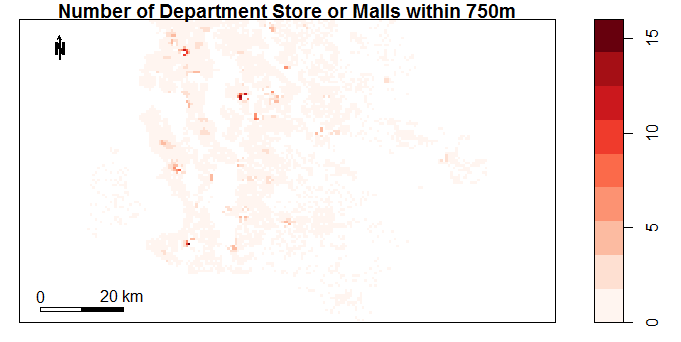
Figure 21.7: Number of Doctors or Dentists within 500m by Location
Figure 21.8 shows relatively few eating places in Seattle andfFigure 21.9 shows relatively few liquor stores. This seems strange and may indicate that Google’s Radar Search does not capture this data reliably.
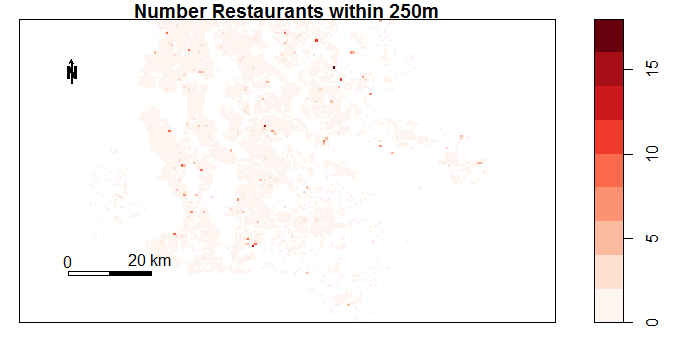
Figure 21.8: Number of Doctors or Dentists within 500m by Location
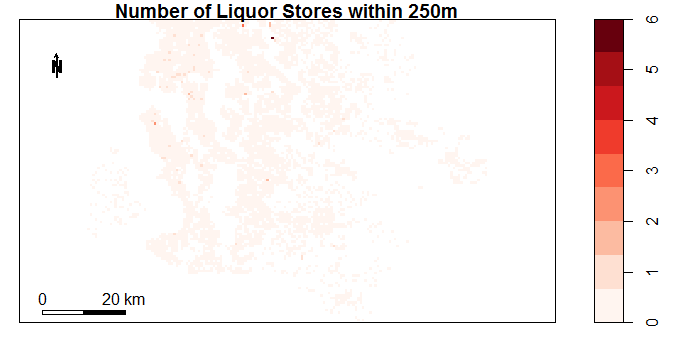
Figure 21.9: Number of Doctors or Dentists within 500m by Location
Figure 21.10 shows that there is relatively little variation in Property Rental Values. This is at odds with common sense. Rental income and property prices should be highly correlated and there are significant variations in property prices within the data. The data obtained from Zillow may be unreliable.
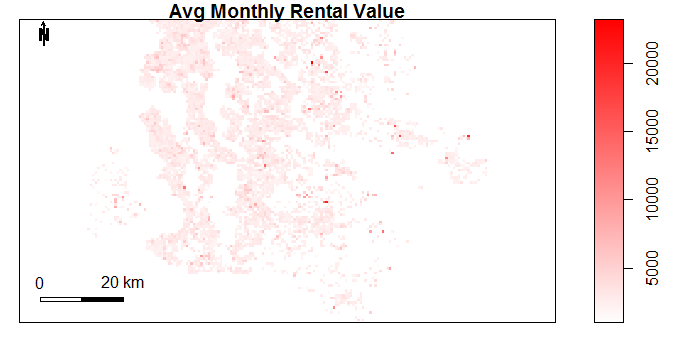
Figure 21.10: Number of Doctors or Dentists within 500m by Location
Results
The enriched data set is found online.
References
Bivand, Roger S, Edzer J Pebesma, Virgilio Gomez-Rubio, and Edzer Jan Pebesma. 2008. Applied Spatial Data Analysis with R. Vol. 747248717. Springer.