Chapter 7 Stats
In this chapter we describe the statistics that can be calculated to your ENA graph, and can be found under Stats on the side bar.
The first statistics is a comparison between groups in your ENA graph [1] (see Figure 7.1). To select your comparison groups, click on the dropdown menus under Groups [2]. You can choose between parametric [3] and non-parametric [4] tests (for more information on choosing between non-parametric or parametric analyses see link). Beside the statistical output, you can generate a sentence summarizing the results of your test by clicking on Write Up [5].
Finally, you can change the number of significant digits by selecting from a dropdown menu in Advanced Options [6].
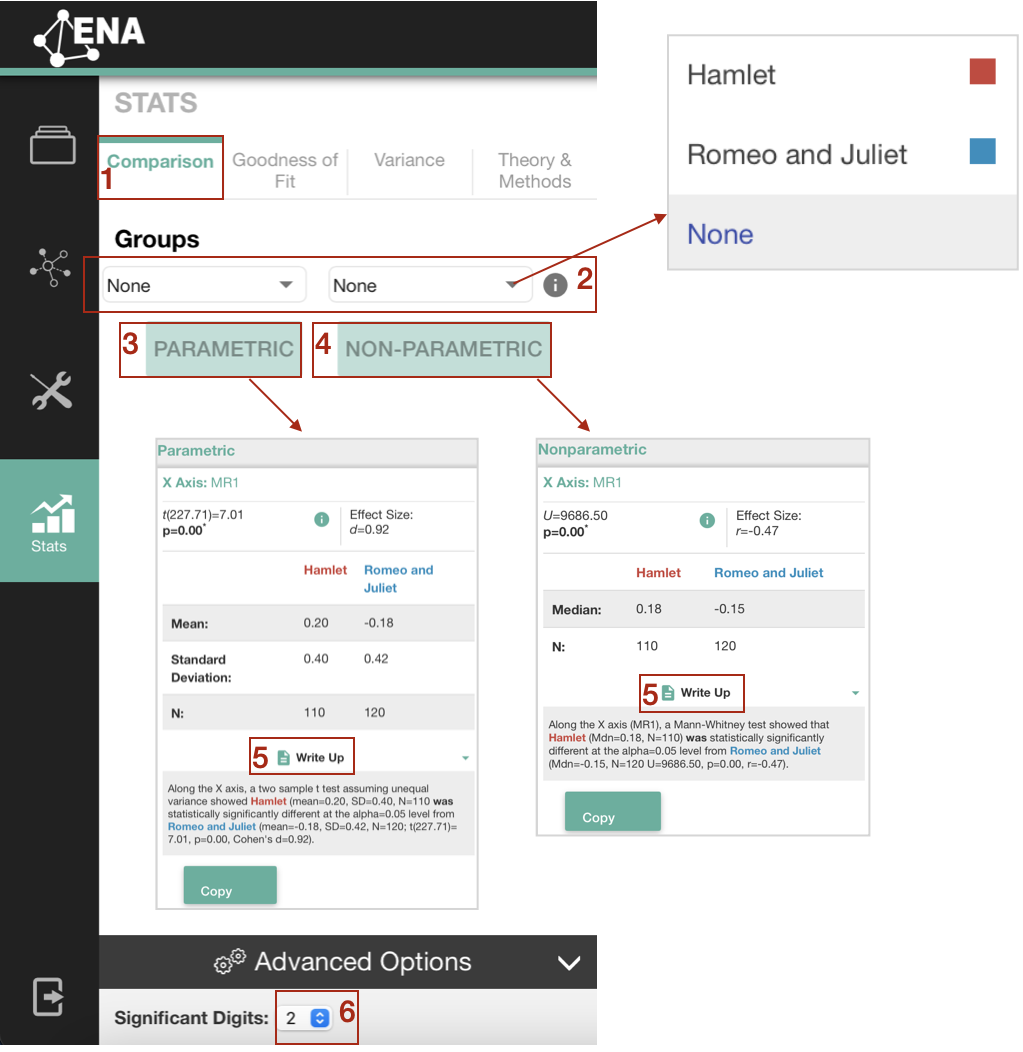
Figure 7.1: Statistical comparison of groups
You can also examine the goodness of fit of your models by selecting Goodness of Fit in the tab bar [2], and clicking on Calculate [2] (see Figure 7.2). This will generate Pearson and Spearman coefficients (for more information on the difference Pearson and Spearman correlation methods see link).
You can see the variance explained by your model for each axes in Stats by clicking on Variance [3]. Variance is also displayed under the axes labels in the comparison plot [4].
Select Theory & Methods [5] and click on Generate Write-Up [6] to generate a general description of your model and a theoretical introduction to Epistemic Network Analysis with references. Its purpose is to equip you with vocabulary to describe your model (for more resources on ENA see QE repository).
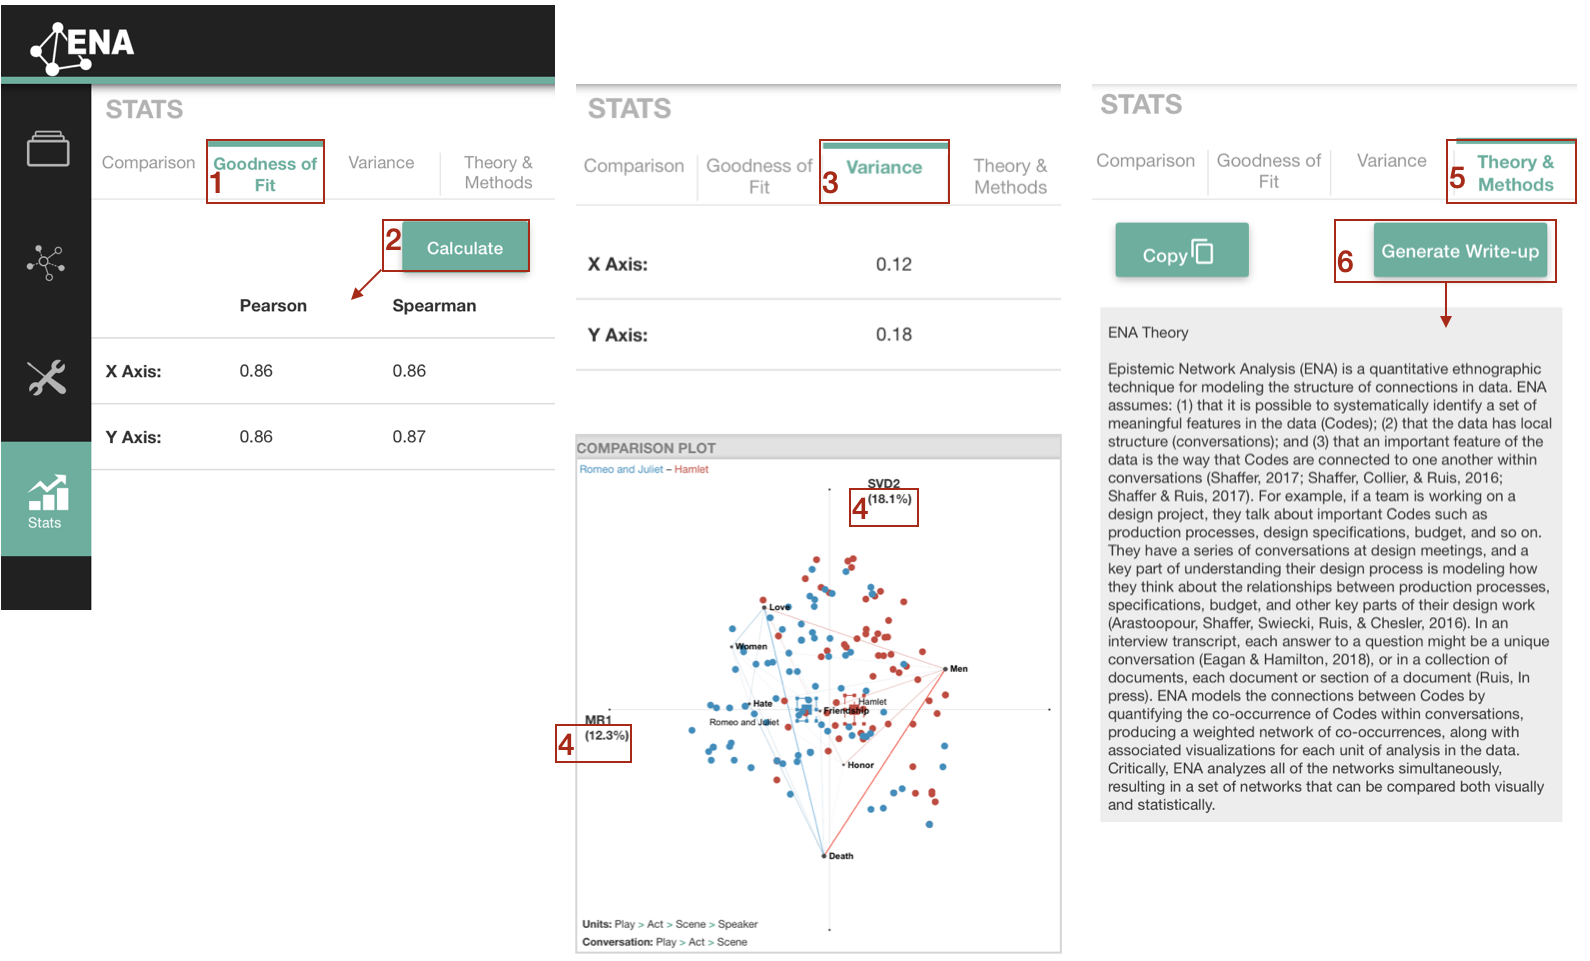
Figure 7.2: Goodness of fit, variance, and theory & methods in the ENA webtool