Chapter 6 Data view
In the ENA webtool you have a possibility to recall your dataset by clicking on Data View under the Comparison Plot [1] (see Figure 6.1). Once you have clicked on it, a view of your dataset will appear in place of the Comparison Plot. You can add additional columns from your dataset to the Data View by clicking on the plus icon [2]. To remove a column, hover over its name and click on a X icon that will appear [3].
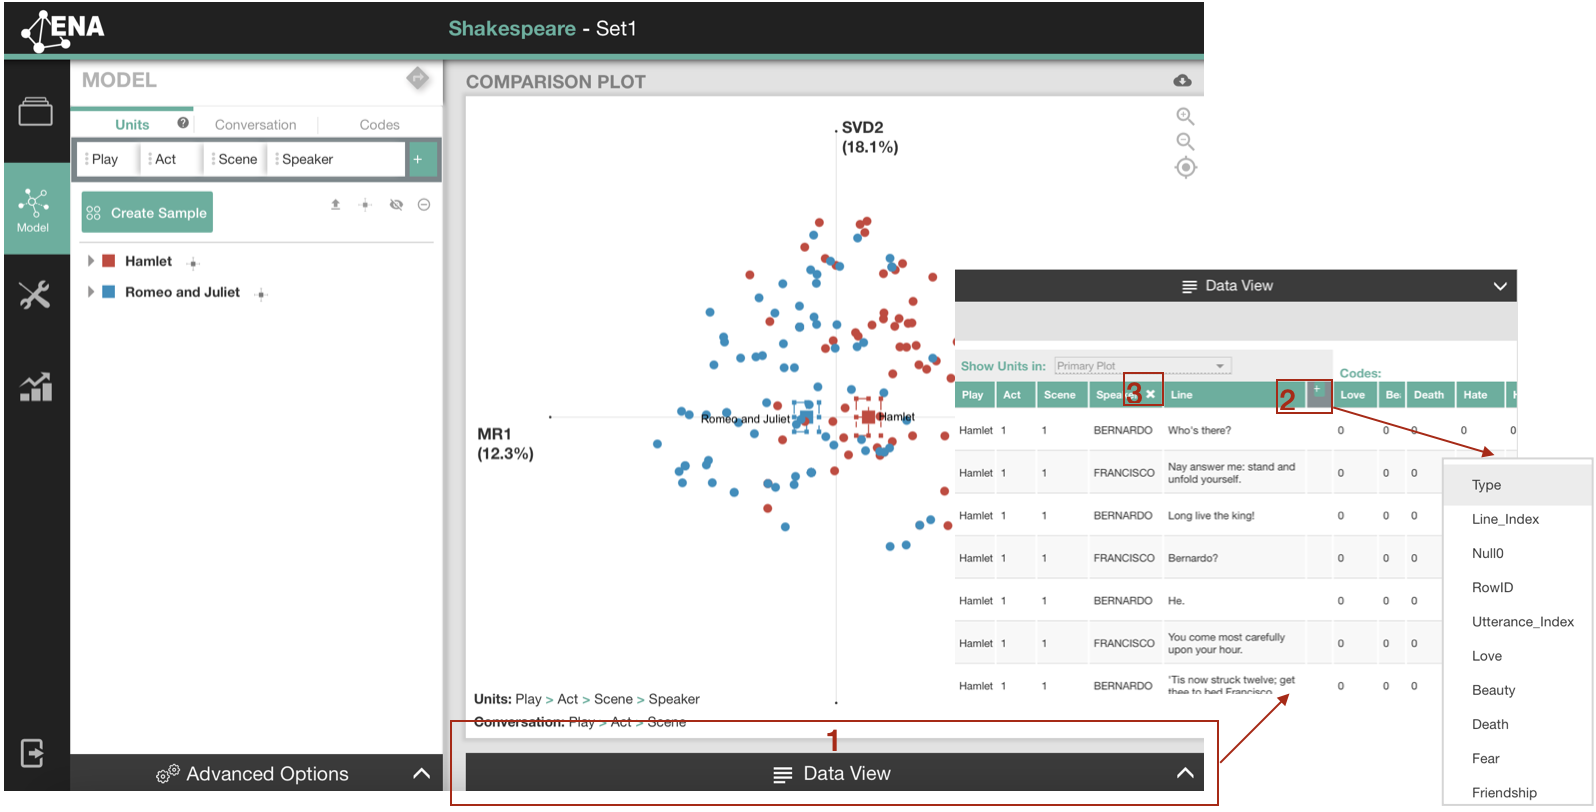
Figure 6.1: Data view in the ENA webtool
Data View is particularly useful to examine the data that build the connections between the codes. To filter your dataset by a specific connection, you have to highlight two codes (see Chapter 4.4 for more information on highlighting codes). Your highlighted codes will appear in the Data View as orange [1] (see Figure 6.2). If your stanza is set to Moving Stanza or Threaded Data, an orange square bracket will appear along the rows to indicate the stanza window.
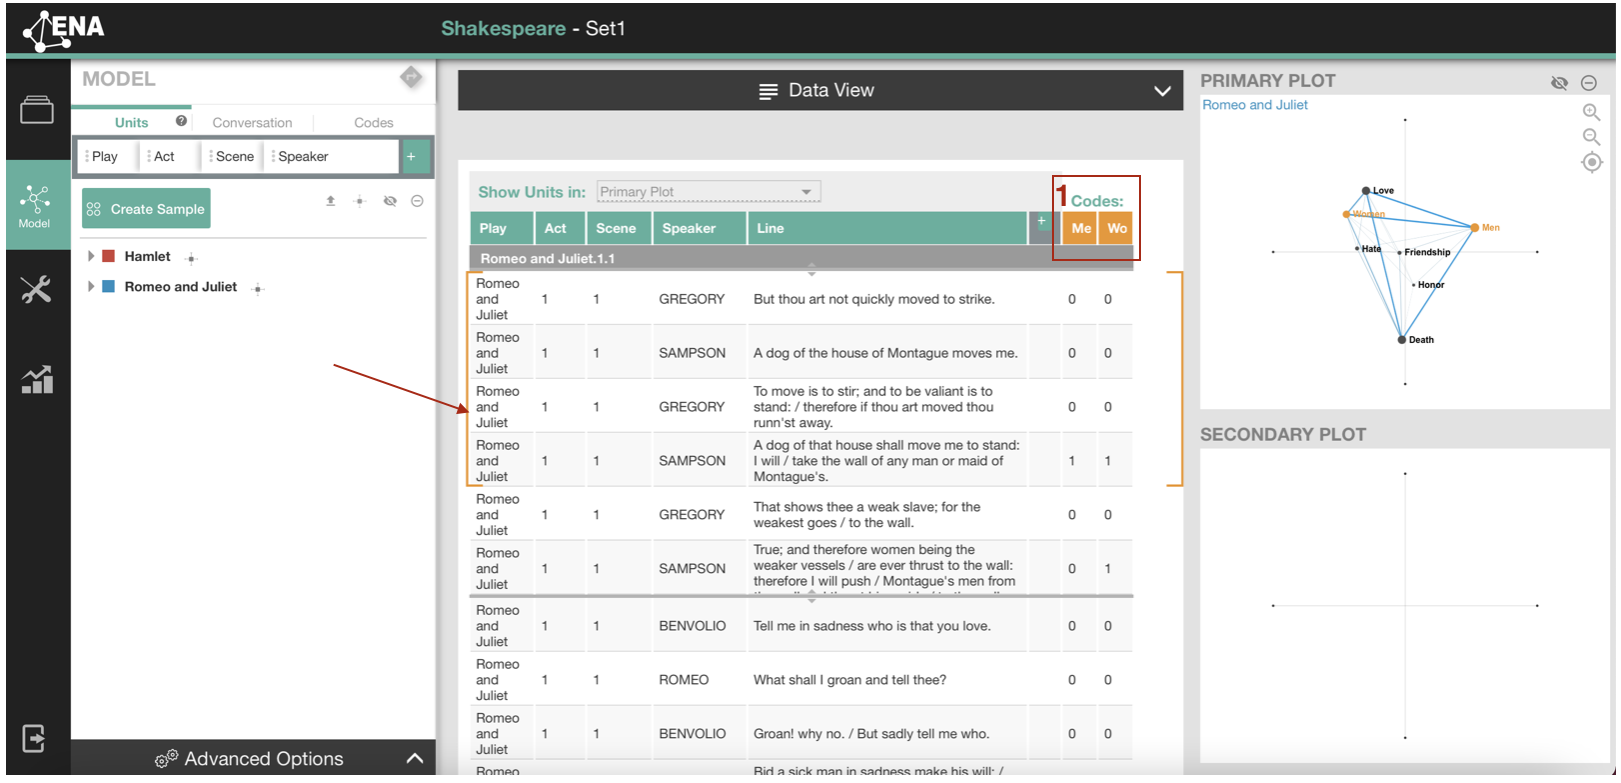
Figure 6.2: Highlighted connections in the data view