Chapter 5 Plot tools
In this chapter we focus on the Plot Tools that can be found in the sidebar. Plot Tools are used to set aesthetics and/or highlight specific parts of your ENA visualization.
5.1 Dimension options
There are several dimension settings that you can change. You can remove the dimension labels from your graph by selecting off next to Dimension labels [1] (see Figure 5.1). To rename your dimensions, type the new name next to the axis name [2]. You can also flip your graph either horizontally or vertically [3]. Finally, to remove the variance values from the ENA graph, click on off next to the variance explained [4].
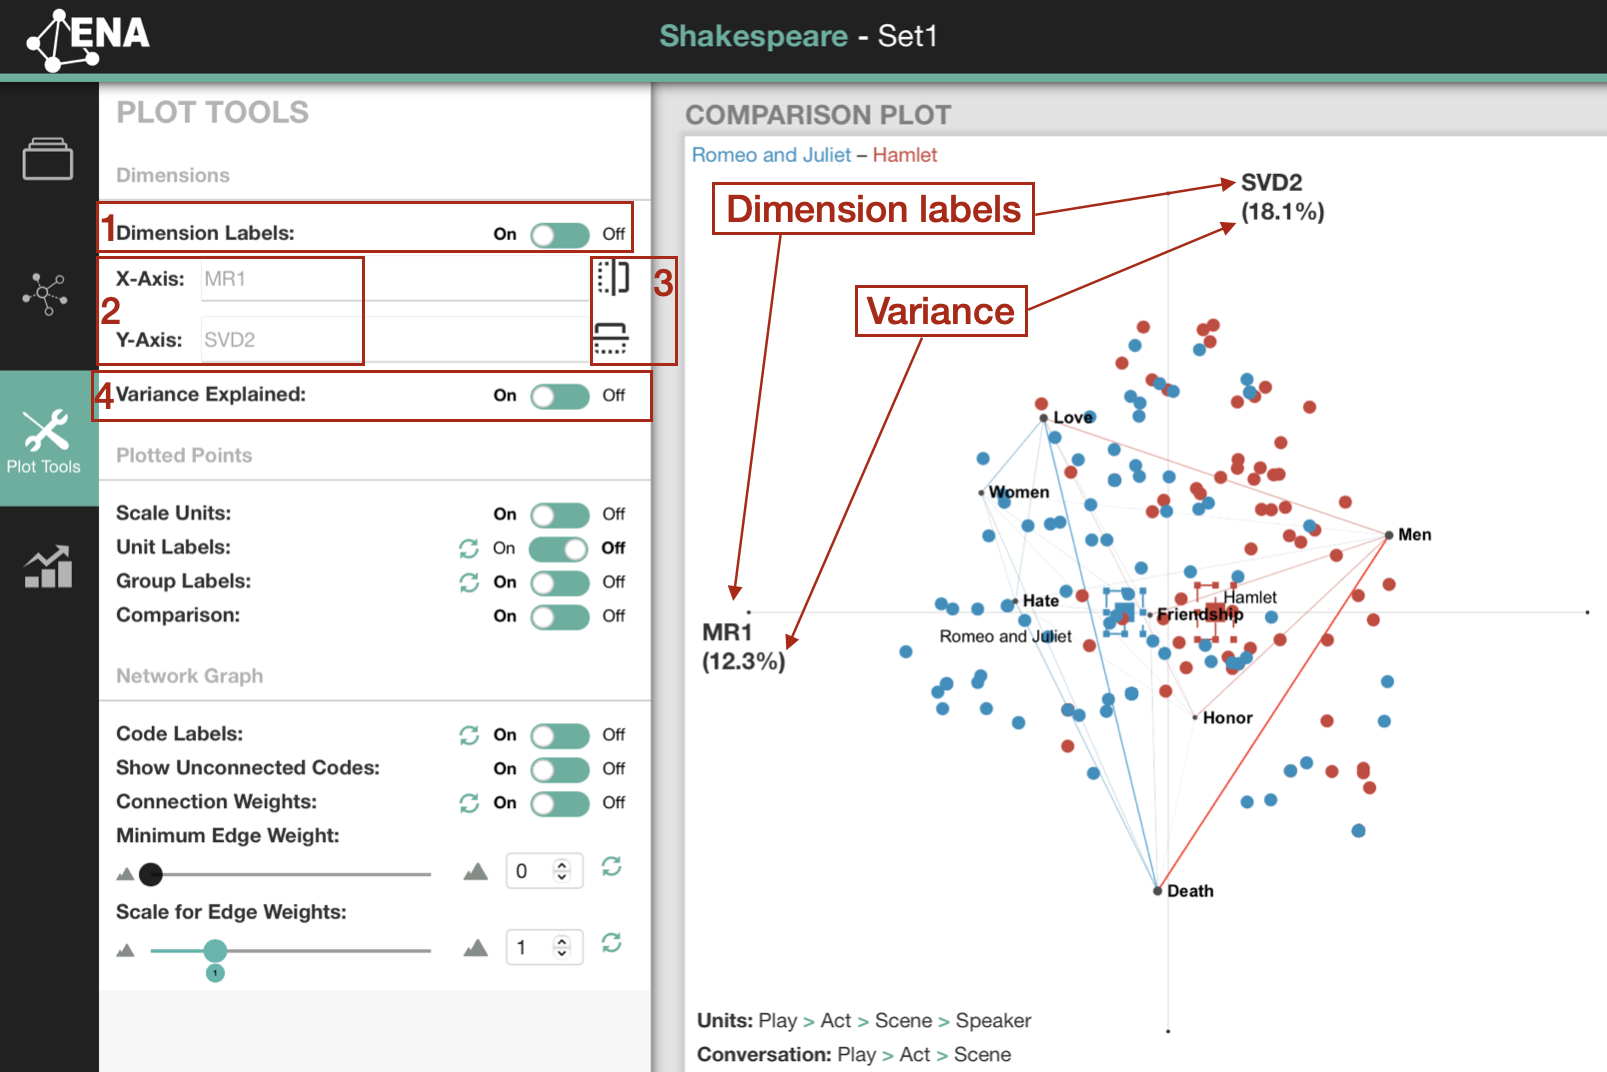
Figure 5.1: Dimension options
5.2 Plotted points options
If you want to turn off scaling of the units, click on off next to scale units [1] (compare the graphs with scaled and unscaled units Figure 5.2
To display unit labels, select on for unit labels [2]. You can also turn off or on the group labels, which refers to the names of your comparison groups displayed next to the group means in the graph [3]. If you select off on Comparison, it will remove the comparison of codes in your ENA visualization [4].
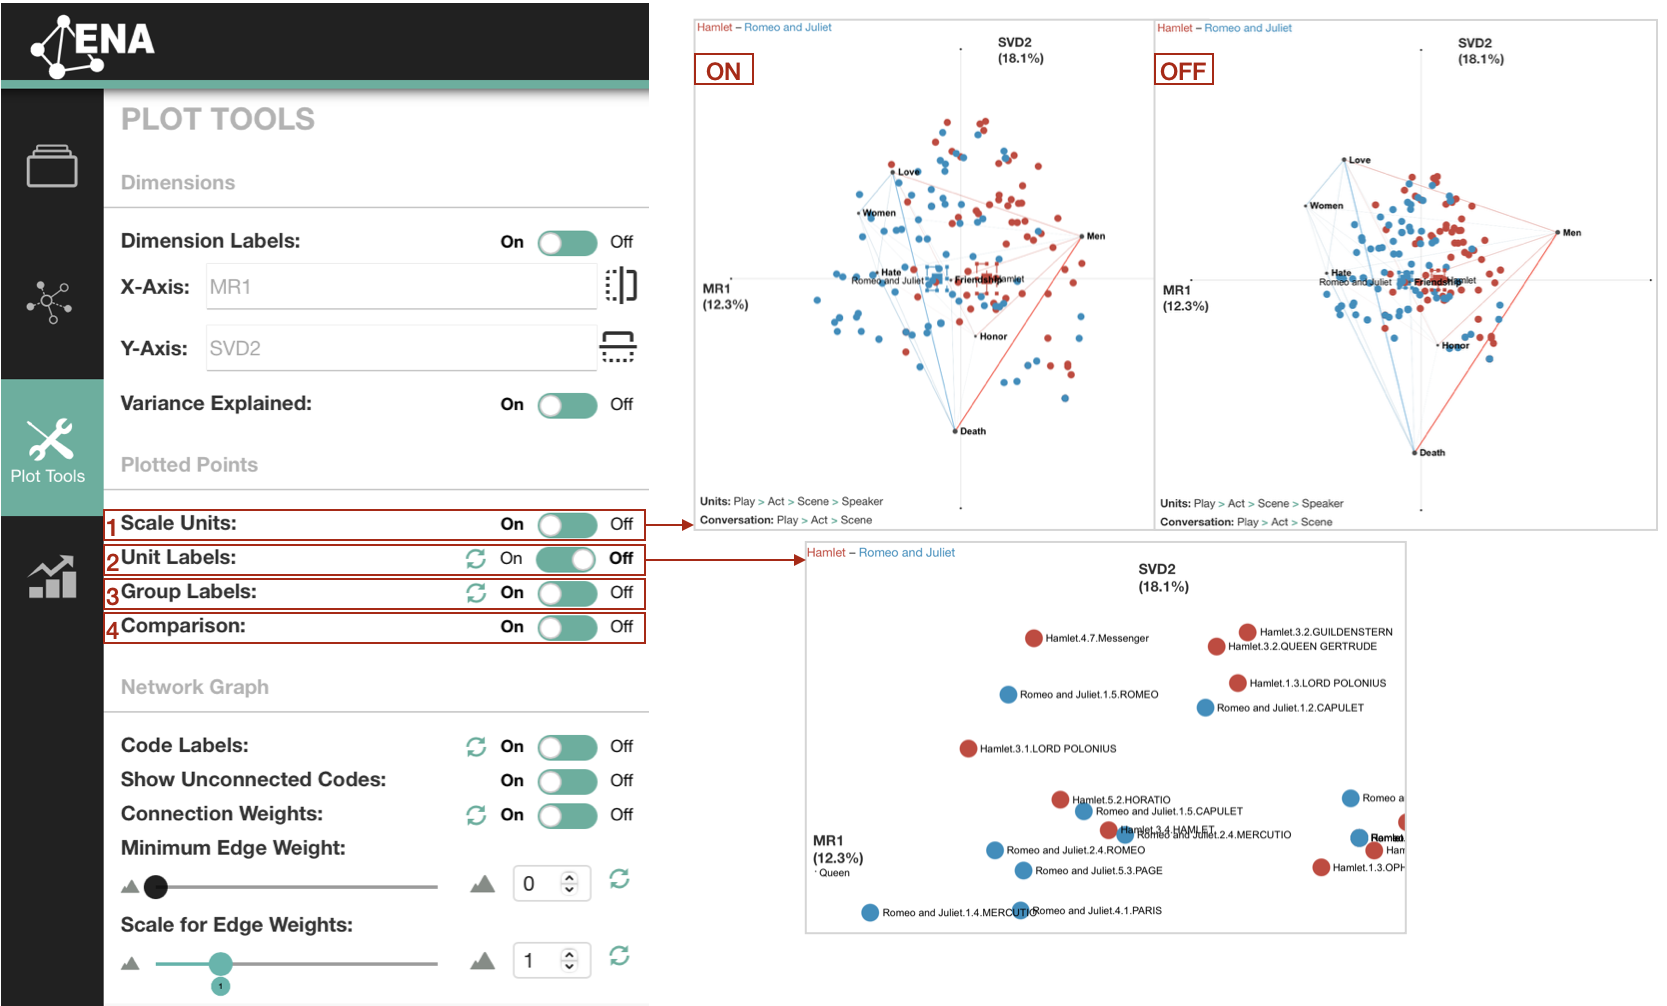
Figure 5.2: Plotted points options
5.3 Network graph options
To remove code labels in your visualization, choose off next to Code Labels [1] (see Figure 5.3). If you want to remove codes from your graph that are not connected with other codes, select off next to Show Unconnected Codes [2]. To remove the edges between the codes, click on off next to Connection Weight [3].
You can set a minimum weight of edges shown in your graph by either using a slide or by typing the weight value under the Minimum Edge Weigh [4]. You can also scale the edge weights in your graph for better readability by using a slide or by typing the weight value in the text box below Scale for Edge Weights [5].
Other advanced option is Weight group networks by with two options Mean and Sum, where the first mentioned is the default setting [7].
To change the font size used in the ENA graph, use the sliding scale in the advanced options under Text Size [8].
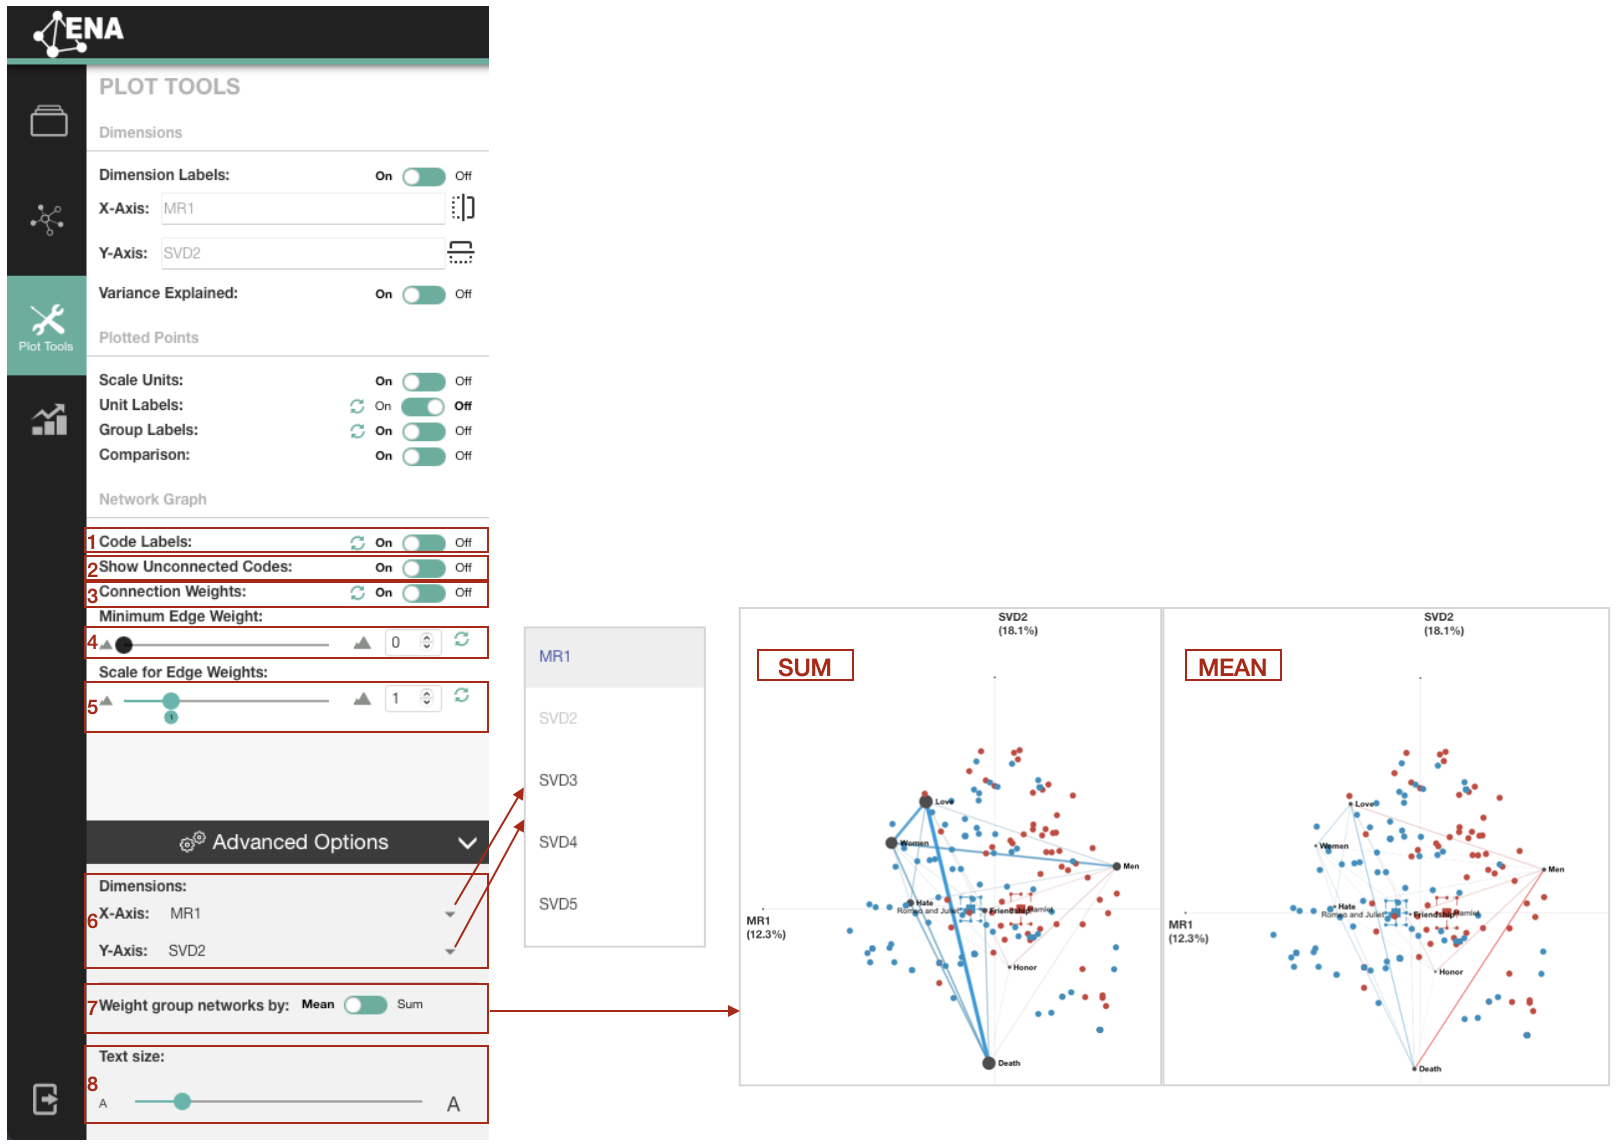
Figure 5.3: Network graph options