6 Population mortality
Population mortality data were used in the relative survival calculations when calculating excess deaths and survival estimates.
6.1 National mortality
All-cause mortality data for the whole population at the national level by sex, year of death and single-year age group (15,16…100+ years) was obtained from the Australian Bureau of Statistics. (Australian Bureau of Statistics, 2022b) This dataset was combined with the national population data by single-year age group up to 99 years and over and sex (see Section 5.1) to calculate the population mortality rates by year, sex, and single age.
6.2 Small area (SA2) level mortality
Mortality data for all causes of death combined for the whole population by small areas during 2006 to 2020 was obtained from the Registries of Births, Deaths and Marriages. (Registry of Births Deaths and Marriages, 2023) Key data variables included sex, year of death, age (grouped into 5-year aggregates for calculations) and geographical area.
The geographical area information was provided by Statistical Local Area (SLA) (Australian Bureau of Statistics, 2006) for the years 2006-2009 and, by 2011 SA2 for the years 2010-2016. (Australian Bureau of Statistics, 2011) The SLA information for the earlier years (2006-2009) was converted to 2011 SA2 using correspondence files. (Australian Bureau of Statistics Geospatial Solutions, 2022) The 2011 SA2 information for all years was converted to 2016 SA2 using population-weighted geographical correspondence files. (Australian Bureau of Statistics Geospatial Solutions, 2023)
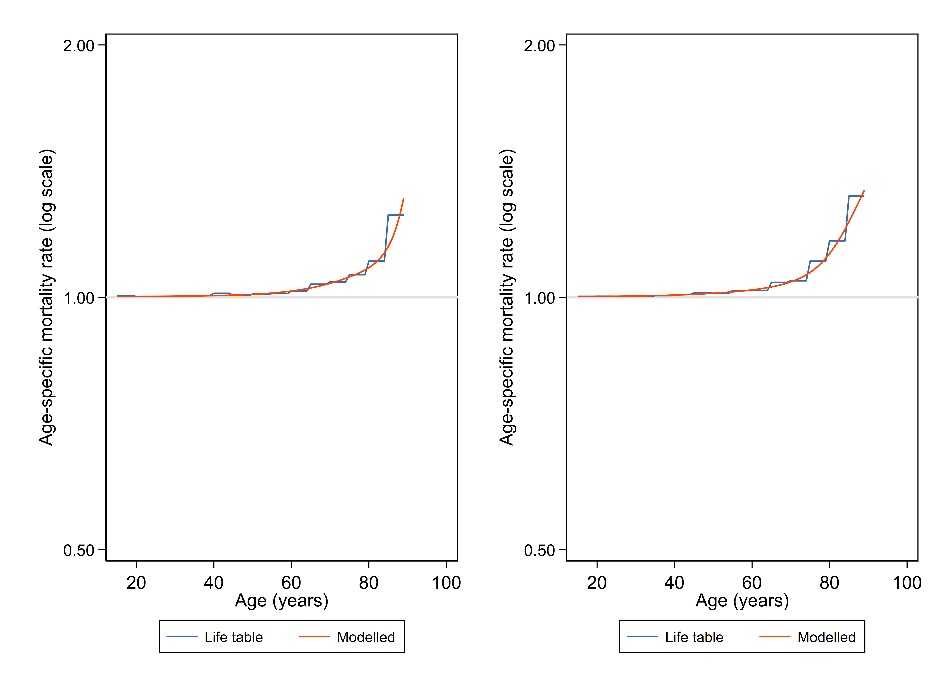
We used information on deaths and population counts to construct tables of age- and sex-specific death (mortality) rates and probabilities of death by year and geographical area (SA2s). Rates were estimated using a flexible Poisson multivariable model that have been shown to derive more robust and unbiased estimates of smoothed age-specific mortality rates for small populations (Rachet et al., 2015) than a no-model (Life table) approach (Figure 6.1). Smoothing was carried out by including groups of SA2s that were considered to be neighbours (see Section 7.1) to enhance stability of the population mortality estimates. Death counts were modelled separately for each sex and geographical area. The log of the population was used as an offset. Expected mortality rates were predicted from the fitted models by individual year of age (15 to 89) for each sex, year, and geographical area.
The population mortality data file for 2001 to 2005 was obtained through a special request from the Australian Bureau of Statistics. To meet their release requirements, we needed to combine each SA2 (using the 2011 definition) with their geographically neighbouring areas. So, the mortality for a specific SA2 includes the mortality for the neighbouring SA2s. For 2001 to 2005 the provided data consisted of total counts of deaths by sex, SA2 group (each 2011 SA2 and its neighbours) and broad age group and aggregated over the years 2001 to 2005, inclusive. This was used to generate a data file containing the mortality counts and population by sex, broad age group, year and grouped SA2 (2011 ASGS), from 2001 to 2005. Finally, the 2011 SA2 information was converted to 2016 SA2 using population-weighted geographical correspondence files. (Australian Bureau of Statistics Geospatial Solutions, 2023)
We used information on deaths and population counts to construct tables of age- and sex-specific death rates or probabilities by year and geographical area (SA2s) for 2001 to 2005. Rates were estimated using a flexible Poisson multivariable model. Death counts were modelled separately for each sex and geographical area. The log of the population was used as an offset. Expected mortality rates were predicted from the fitted models by individual year of age (15 to 89) for each sex, time-period (years, 2001-2005) and geographical area.