Chapter 15 Exposures
Imagine a soldier dropping a piece of paper containing their camp location, trails and military equipment only for it to be picked up by a wandering enemy. That would be catastrophic, right? That is akin to exposing them into the line of fire. However, exposures in dbt serve a good purpose. They show how your data is used by downstream projects, be they be notebooks, a dashboard or another data pipeline. They only thing that sets apart exposures from other models is that this time round you are the one who defines which projects will be used downstream. For example, if you want to show your CEO which models were used to create the dashboard, instead of showing the ten models you sifted through, you only show the three that made it to the dashboard.
15.1 Creating an exposure
Exposures are written in YAML files but nested under the exposures: key. Below is an exposure created in the exposure/exposures.yml path.
version: 2

exposures:

  - name: station_bikes_exposure
    label: A join of station tables and bike rides
    type: dashboard
    maturity: high
    url: https://public-toilets-in-australia-infomap.onrender.com/
    description: '{{ doc("citi_trips_round") }}'

    depends_on:
      - ref('citi_trips_round')
      - ref('citi_trips_minutes') # Added this just to increase complexity of lineage graph
      - source('nyc_bikes_nyc_bikes2014', '2014-tripdata')

    owner:
      name: Mr Fantastic
      email: mrfantastic@unlike.com
Below is the definition of each property used above.
Required
name: a unique exposure name written in snake casetype: one of dashboard, notebook, analysis, ml or applicationowner: name or email required; additional properties allowed
Expected
depends_on: list of nodes, including metric, ref, and source. While possible, it is highly unlikely you will ever need an exposure to depend on a source directly.
Optional
label: May contain spaces, capital letters, or special characters.url: Activates and populates the link to View this exposure in the upper right corner of the generated documentation sitematurity: Indicates the level of confidence or stability in the exposure. One of high, medium, or low. For example, you could use high maturity for a well-established dashboard, widely used and trusted within your organization. Use low maturity for a new or experimental analysis.
General properties (optional)
- description
- tags
- meta
15.2 Running an exposure
To run the exposure we just created, we use the following one liner. The plus sign is there to indicate to dbt to include all models used to feed into the station_bikes_exposure exposure.
dbt run --select +exposure:station_bikes_exposureIt is noteworthy to mention that you run the name value under the exposures key. The name of the YAML is not used when running exposures.
Here is the output:
20:31:06  Concurrency: 1 threads (target='dev')
20:31:06
20:31:06  1 of 2 START sql view model nyc_bikes.citi_trips_minutes ....................... [RUN]
20:31:09  1 of 2 OK created sql view model nyc_bikes.citi_trips_minutes .................. [CREATE VIEW (0 processed) in 3.10s]
20:31:09  2 of 2 START sql view model nyc_bikes.citi_trips_round ......................... [RUN]
20:31:12  2 of 2 OK created sql view model nyc_bikes.citi_trips_round .................... [CREATE VIEW (0 processed) in 2.80s]
20:31:12
20:31:12  Finished running 2 view models in 0 hours 0 minutes and 13.36 seconds (13.36s).
20:31:12
20:31:12  Completed successfully
20:31:12
20:31:12  Done. PASS=2 WARN=0 ERROR=0 SKIP=0 TOTAL=2
One can also decide to test all the upstream models for our exposure. The below code will display test results for all the three models defined by the depends_on key.
19:37:44  Concurrency: 1 threads (target='dev')
19:37:44
19:37:44  1 of 23 START test dbt_expectations_expect_column_max_to_be_between_citi_trips_minutes_trip_duration_min__326000__16  [RUN]
19:37:49  1 of 23 PASS dbt_expectations_expect_column_max_to_be_between_citi_trips_minutes_trip_duration_min__326000__16  [PASS in 5.51s]
19:37:49  2 of 23 START test dbt_expectations_expect_column_max_to_be_between_citi_trips_round_trip_duration_min__326000__16  [RUN]
19:37:53  2 of 23 PASS
-- snip --
Nevertheless, we remain with visualizing our exposure.
15.3 Visualizing the exposure
Visualizing exposures is as simple as just generating your dbt documentation. This is actually the default way of displaying exposures. It begins with dbt docs generate and dbt docs serve. Afterwards, open the dbt documentation static web page in the port number provided. Ours is localhost:/8080.
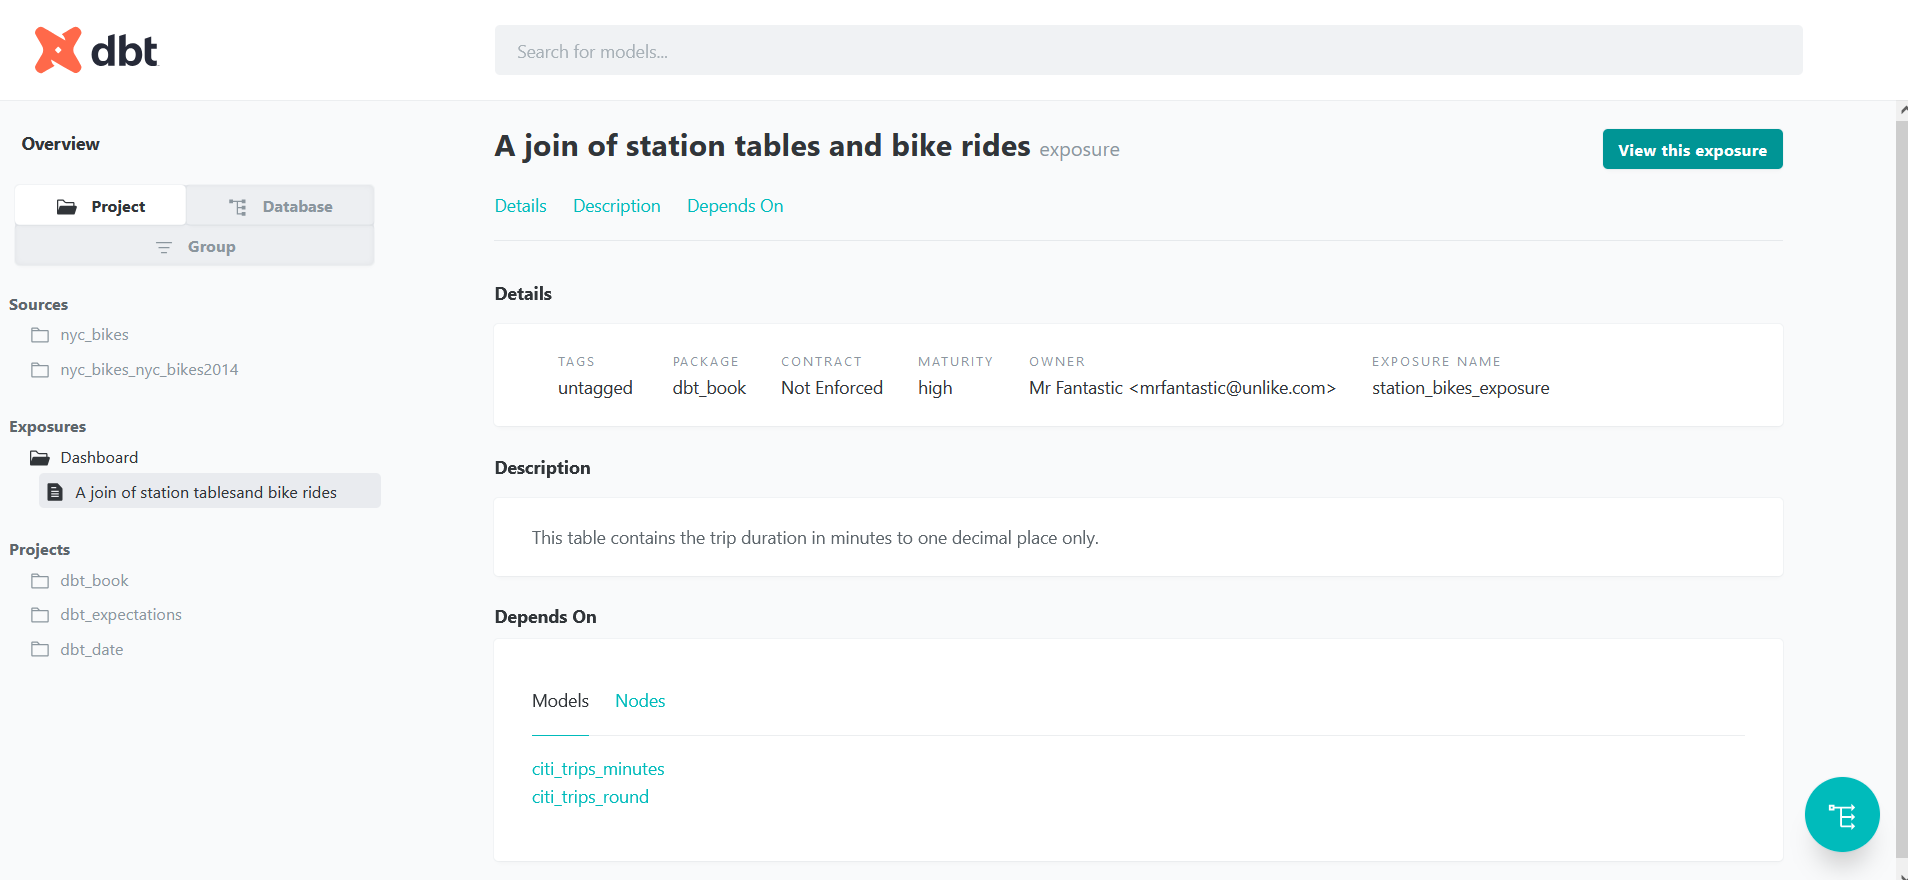
You will notice that there is a dedicated section for exposures called Exposures. The exposure title is Dashboard and the label for the exposure is the label value provided in the YAML.
If you click on the blue lineage graph button, you will see the upstream models that feed into our exposure.
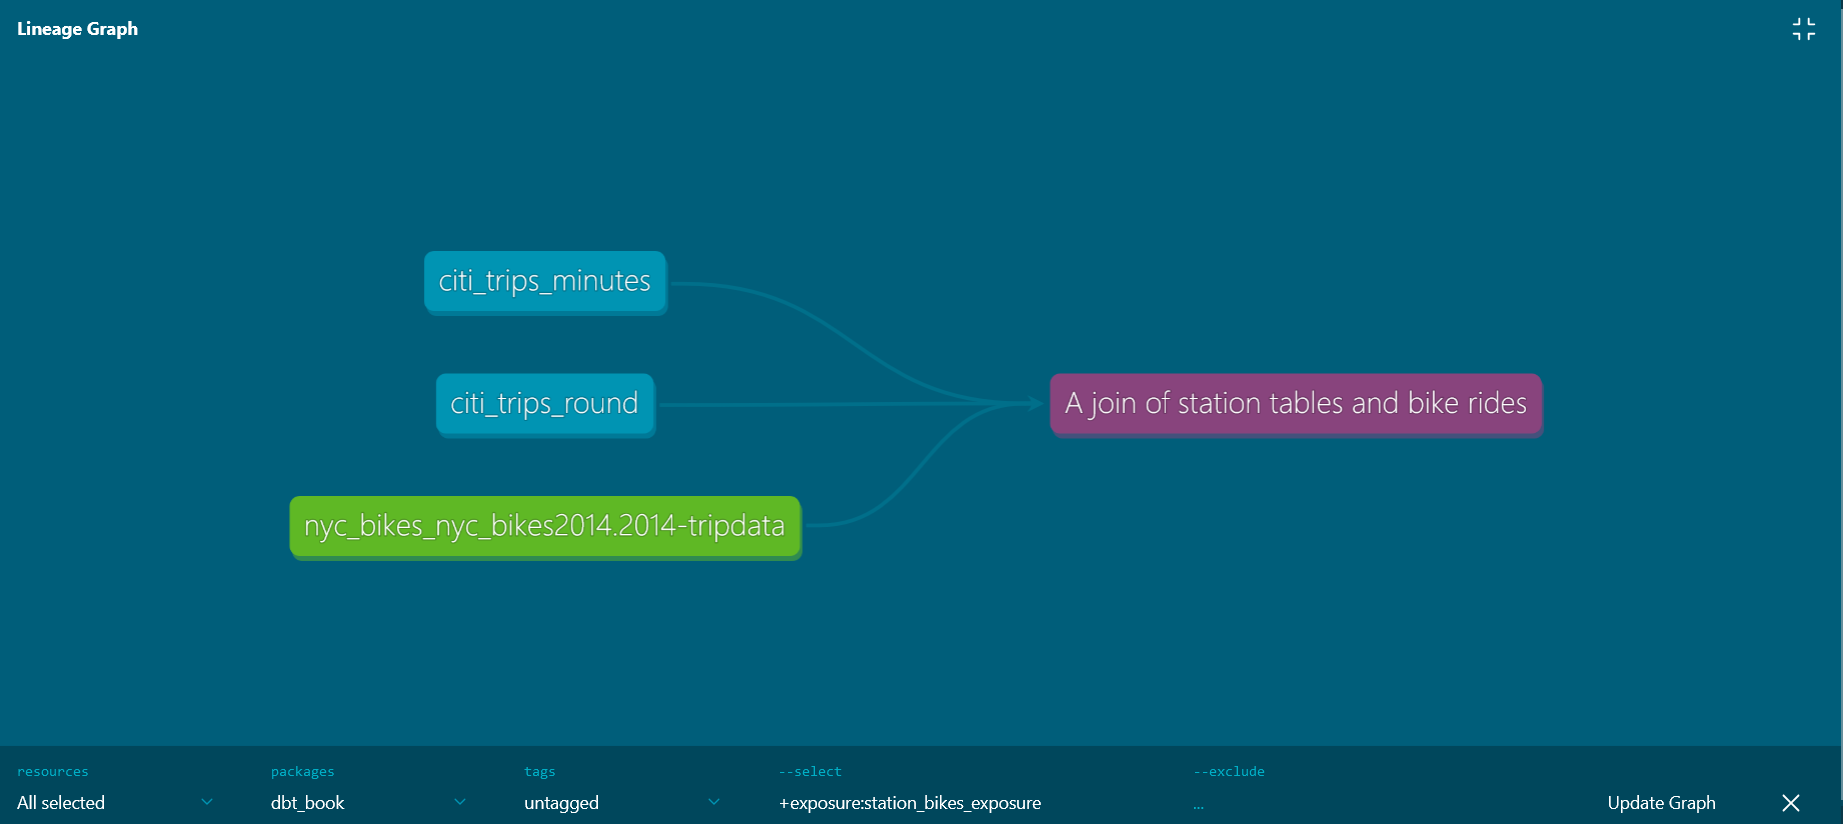
Still at the bottom of the webpage, the Depends on section contains links to all the upstream models and references for your exposure. Clicking on any takes you to the dbt documentation site for that model.
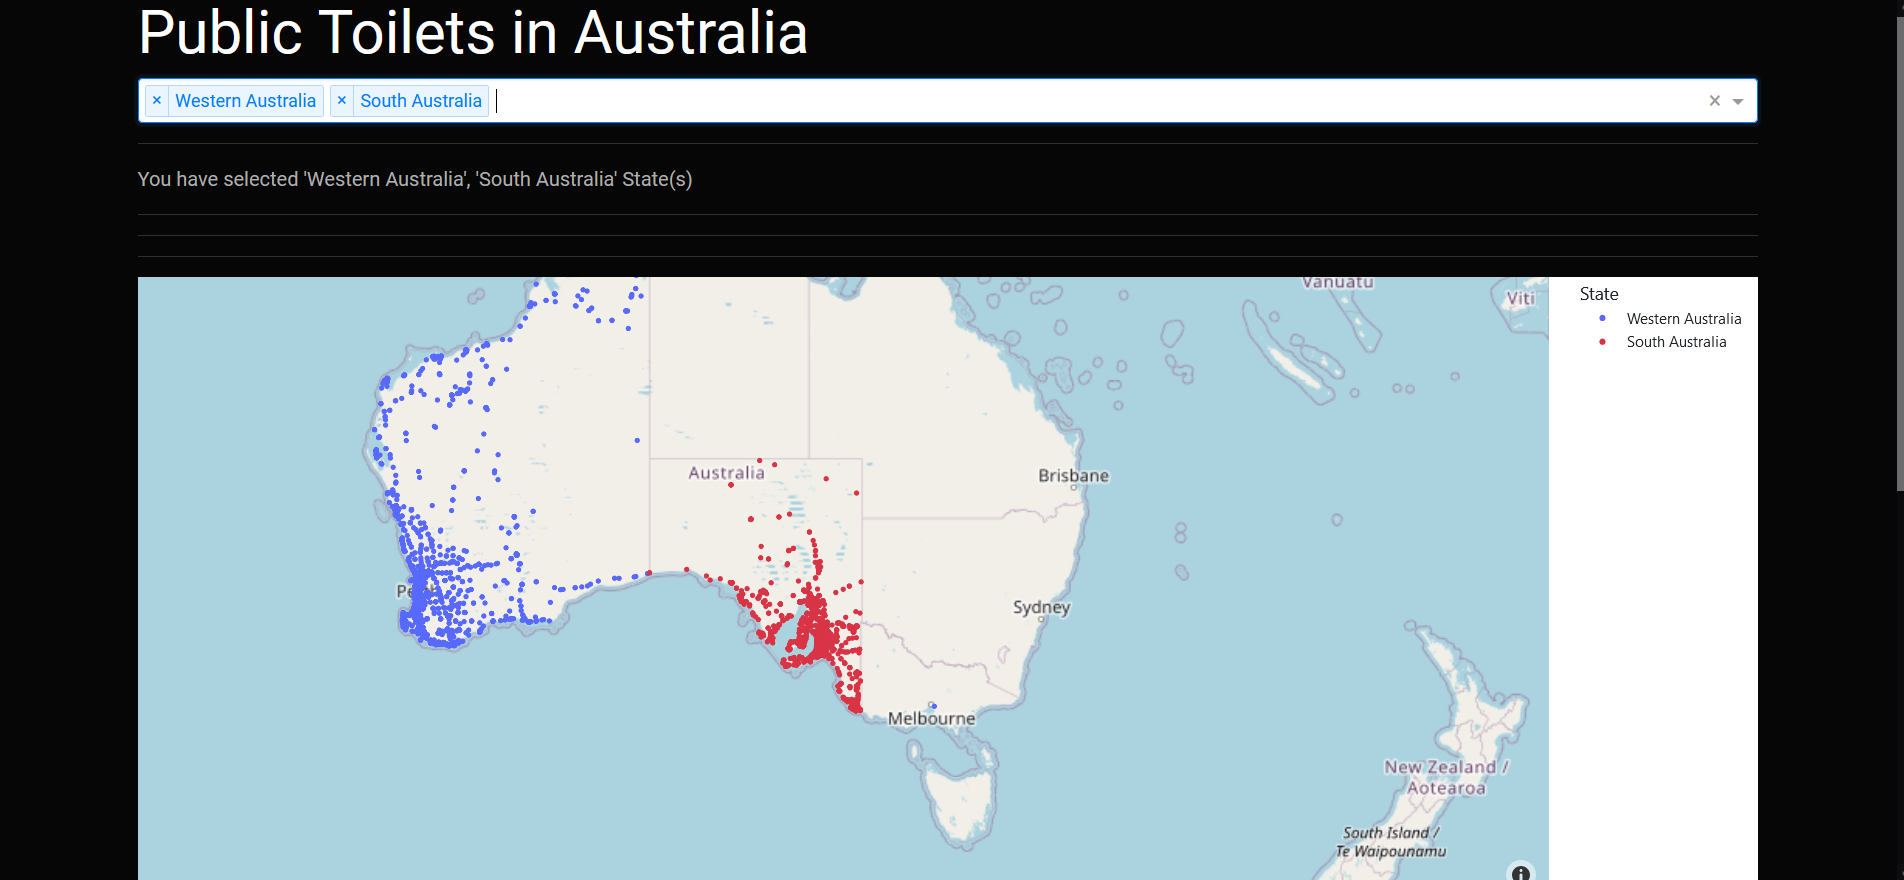
Finally, there is the View this exposure button. Clicking on it will take you to the url you specified in the url: key of the exposures file. In our case, the url leads to a Dashboard showing all the public sanitation facilities in Australia. Obviously there is no relation between bikes and sanitation facilities. This was just for demonstration purposes only!
Working with exposures can be fun. You can add as many exposures as you wish. Below we extended the exposures YAML to also include the following station_bikes_application exposure.
-- snip --
- name: station_bikes_application
    label: An app of stations and bike rides
    type: application
    maturity: high
    url: https://data-visualization-for-diarrhoea-deaths.onrender.com/
    description: '{{ doc("citi_trips_round") }}'

    depends_on:
      - ref('citi_trips_long')
      - ref('citi_trips_minutes') # Added this just to increase complexity of lineage graph
      - source('nyc_bikes_nyc_bikes2014', '2014-tripdata')

    owner:
      name: Mr Fantastic
      email: mrfantastic@unlike.com
Once again, to include this exposure, we run dbt run --select +exposure:station_bikes_application. Thereafter create a documentation using the two sesame magic characters of dbt docs generate and dbt docs serve.
The above exposure of station_bikes_application falls under the Application section as specified in the type key.
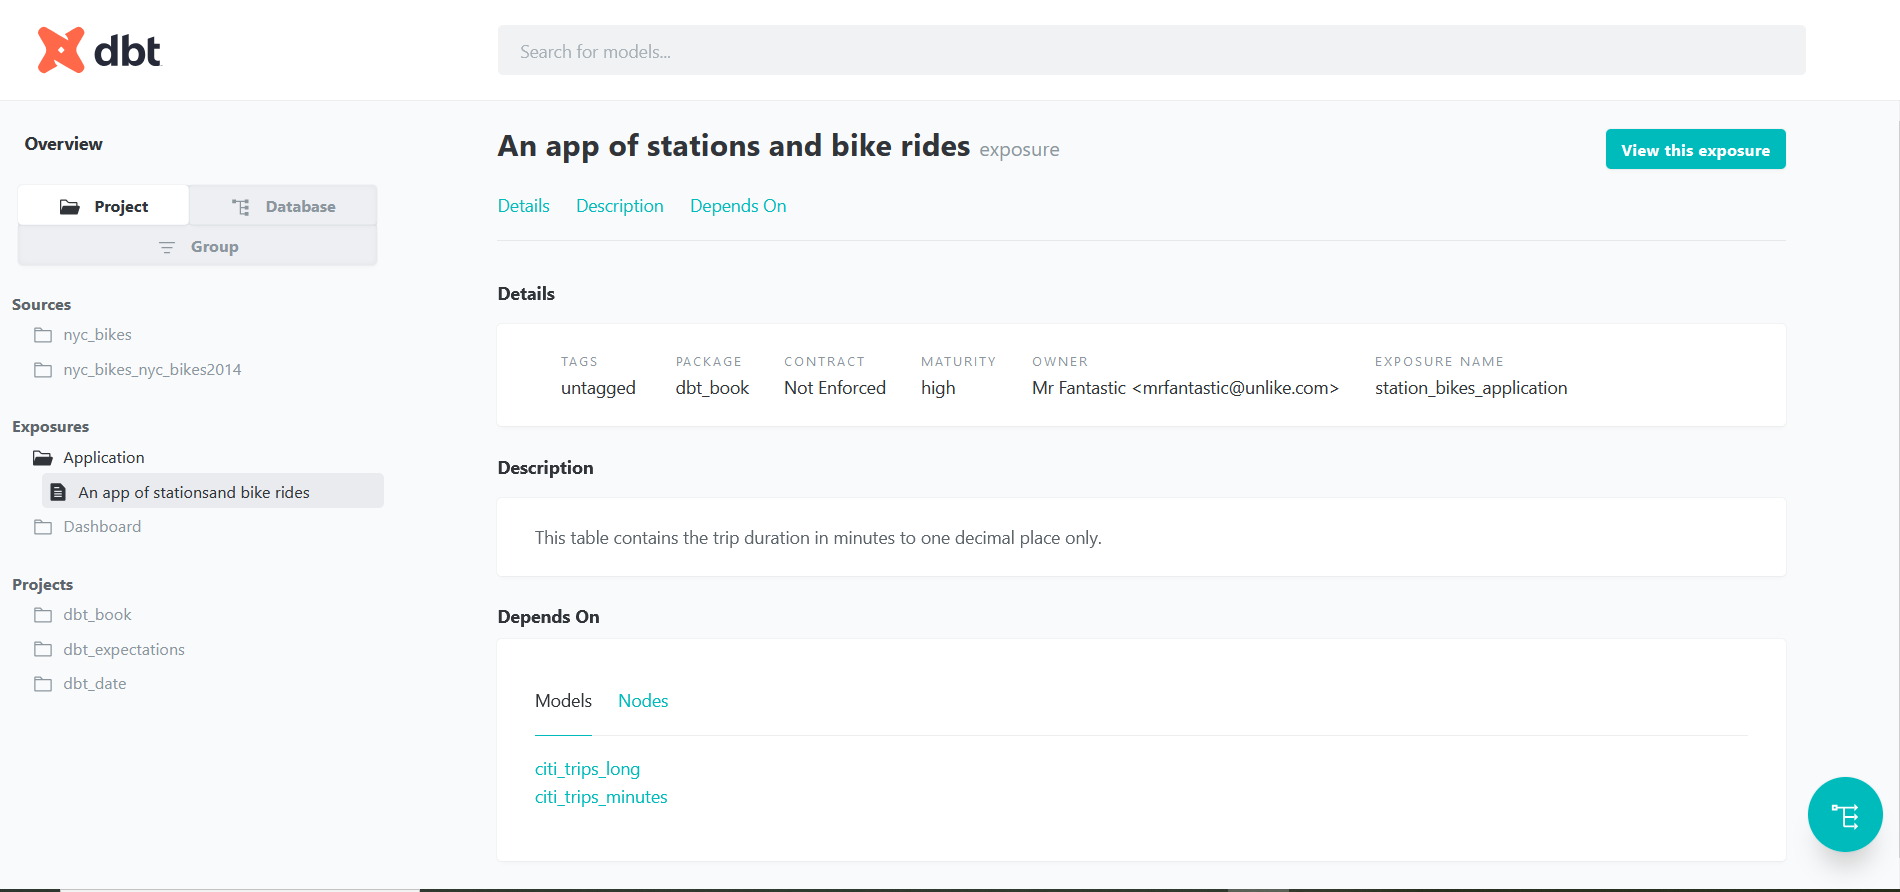
The lineage graph and the View this exposure buttons work for this exposure as well. In fact this lineage graph is the most complex we’ve encountered in the course so far. The exposure took into consideration that the citi_trips_long model is dependent on the citi_trips_minutes and citi_trips_round models!
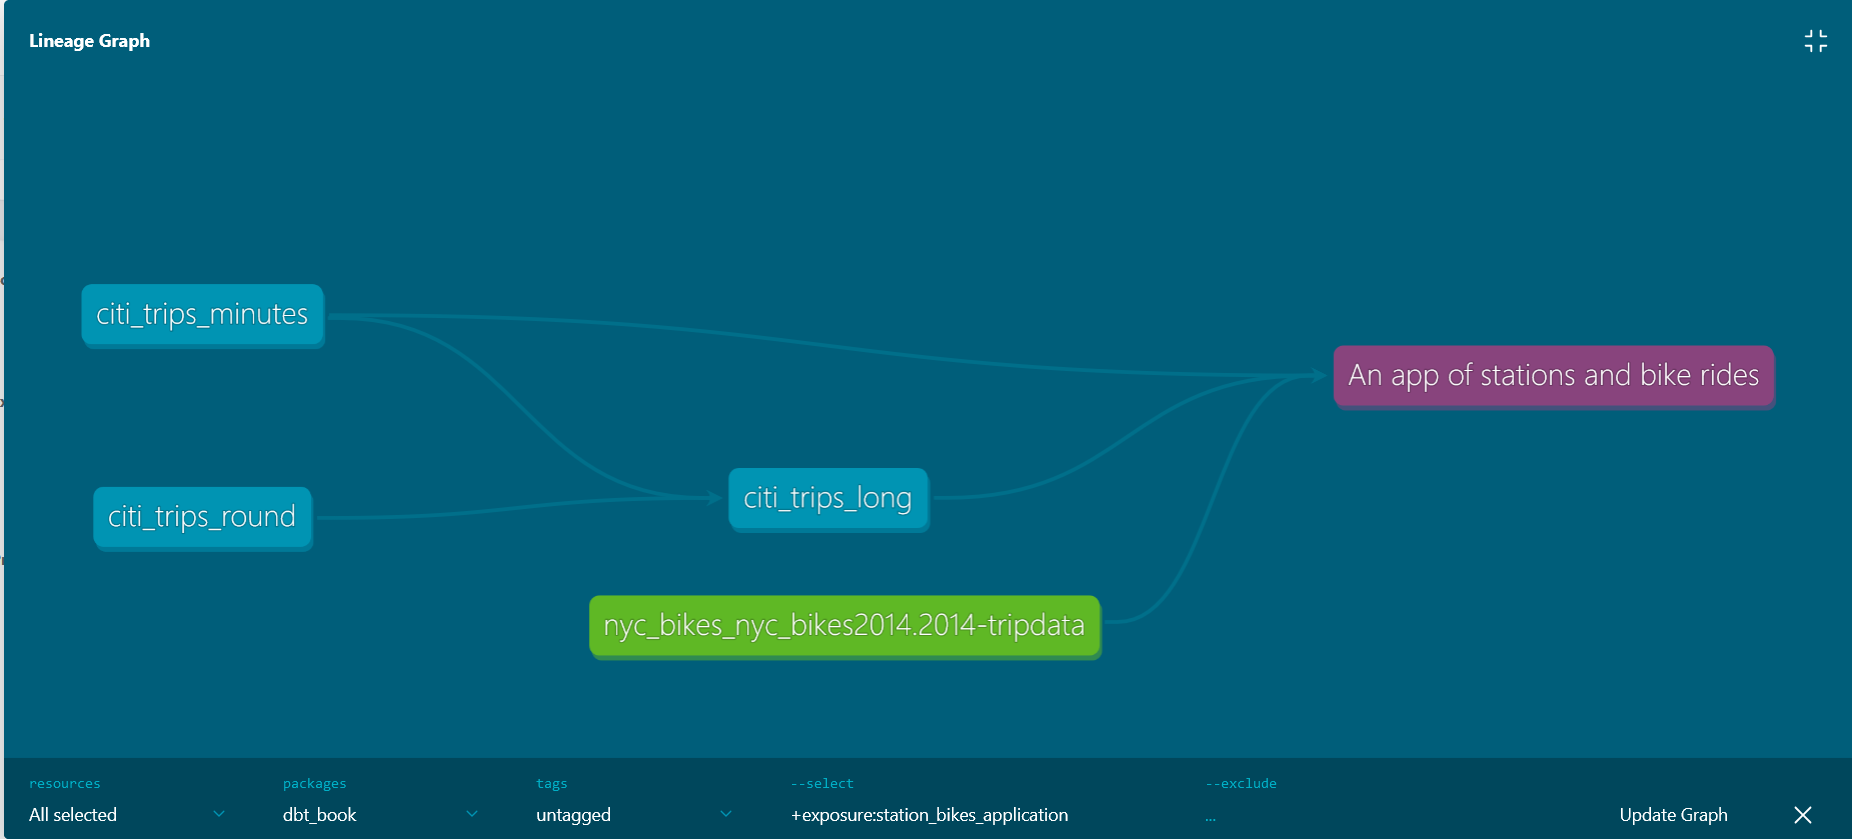
The exposure button also leads to a dashboard showing rates of some sanitation related disease. Again, this dashboard is not related to bikes and stations but serves the purpose of demonstration.