Introduction
In
Section 16 we introduced linear models with particular emphasis on Normal linear models. We derived the
least square estimates of the model parameters for the straight line model:
\[ y = \alpha + \beta x + \epsilon, \]
and showed that if \(\epsilon \sim N(0,\sigma^2)\) then the least square estimates coincide with the maximum likelihood estimates of the parameters. In this section we consider the mathematics behind least squares estimation for general linear models. This relies heavily on linear algebra (matrix manipulation) and we give a review of key linear algebra results in Section 17.2. The main message is that we can concisely express key quantities such as least square parameter estimates, \(\hat{\beta}\), fitted values, \(\hat{y}\) and residuals, \(\epsilon\) as functions of matrices.
Linear algebra review
Rank of a matrix
Let \(\mathbf{M}\) be any \(n \times m\) matrix. Then the rank of \(\mathbf{M}\) is the maximum number of linearly independent column vectors of \(\mathbf{M}\).
Transpose of a matrix
If \(\mathbf{M}=(m_{ij})\), then \(\mathbf{M}^T=(m_{ji})\) is said to be the transpose of the matrix \(\mathbf{M}\).
Properties of square matrices
Suppose \(\mathbf{A}\) is a square \(n \times n\) matrix, then
- \(\mathbf{A}\) is symmetric if and only if \(\mathbf{A}^T=\mathbf{A}\);
- \(\mathbf{A}^{-1}\) is the inverse of \(\mathbf{A}\) if and only if \(\mathbf{A}\mathbf{A}^{-1}=\mathbf{A}^{-1}\mathbf{A}=\mathbf{I}_n\);
- The matrix \(\mathbf{A}\) is nonsingular if and only if \(\text{rank}(\mathbf{A})=n\);
- \(\mathbf{A}\) is orthogonal if and only if \(\mathbf{A}^{-1}=\mathbf{A}^T\);
- \(\mathbf{A}\) is idempotent if and only if \(\mathbf{A}^2=\mathbf{A}\mathbf{A}=\mathbf{A}\);
- \(\mathbf{A}\) is positive definite if and only if \(\mathbf{x}^T \mathbf{A} \mathbf{x} > 0\) for all non-zero vectors \(\mathbf{x}\).
Note the following two important results:
- \(\mathbf{A}\) has an inverse if and only if \(\mathbf{A}\) is nonsingular, that is the rows and columns are linearly independent;
- \(\mathbf{A}^T \mathbf{A}\) is positive definite if \(\mathbf{A}\) has an inverse.
The following computational results are also useful:
- Let \(\mathbf{N}\) be an \(n \times p\) matrix and \(\mathbf{P}\) be a \(p \times n\) matrix, then
\[(\mathbf{N}\mathbf{P})^T = \mathbf{P}^T \mathbf{N}^T;\]
- Suppose \(\mathbf{A}\) and \(\mathbf{B}\) are two invertible \(n \times n\) matrices, then
\[(\mathbf{A}\mathbf{B})^{-1} = \mathbf{B}^{-1} \mathbf{A}^{-1};\]
- We can write the sum of squares \(\sum\limits_{i=1}^n x_i^2 = \mathbf{x}^T \mathbf{x}\), where \(\mathbf{x}^T=[x_1, x_2,\dots,x_n]\) is a \(1 \times n\) row vector.
Given
\(n\)-dimensional vectors
\(\mathbf{x}\) and
\(\mathbf{y} = \mathbf{y}(\mathbf{x})\), we define
\[
\frac{d \mathbf{y}}{d \mathbf{x}} = \left(
\begin{array}{ccc}
\frac{\partial y_1}{\partial x_1} & \cdots & \frac{\partial y_n}{\partial x_1}\\
\frac{\partial y_1}{\partial x_2 }& \cdots & \frac{\partial y_n}{\partial x_2}\\
\vdots & \vdots & \vdots\\
\frac{\partial y_1}{\partial x_n }& \cdots & \frac{\partial y_n}{\partial x_n}\\
\end{array}
\right) .
\]
Then the following results hold in the calculus of matrices:
- \(\frac{d}{d\mathbf{x}}(\mathbf{A}\mathbf{x}) = \mathbf{A}^T\), where \(\mathbf{A}\) is a matrix of constants;
- \(\frac{d}{d\mathbf{x}}(\mathbf{x}^T \mathbf{A} \mathbf{x}) = (\mathbf{A}+\mathbf{A}^T)\mathbf{x} = 2\mathbf{A}\mathbf{x}\) whenever \(\mathbf{A}\) is symmetric;
- If \(f(\mathbf{x})\) is a function of several variables the necessary condition to maximise or minimise \(f(\mathbf{x})\) is
\[\frac{\partial f(\mathbf{x}) }{ \partial \mathbf{x} } = 0.\]
- Let \(\mathbf{H}=\frac{\partial^2 f(\mathbf{x}) }{ \partial \mathbf{x} \partial \mathbf{x}^T}\) be the Hessian of \(f\), that is the matrix of second derivatives. Then a maximum will occur if \(\mathbf{H}\) is negative definite, and a minimum will occur if \(\mathbf{H}\) is positive definite.
Let \(\mathbf{A}\) be a matrix of constants and \(\mathbf{Y}\) be a random vector, then we have the following expectation and variance results:
- \(E[\mathbf{A}\mathbf{Y}] = \mathbf{A}E[\mathbf{Y}]\);
- \(\text{Var}(\mathbf{A}\mathbf{Y}) = \mathbf{A} \text{Var}(\mathbf{Y}) \mathbf{A}^T\).
Deriving the least squares estimator
Recall that a linear model is given in matrix form by
\(\mathbf{Y}=\mathbf{Z}\mathbf{\beta}+\mathbf{\epsilon}\), where
\[\begin{eqnarray*}
\mathbf{Y} = \begin{pmatrix} Y_1 \\ Y_2 \\ \vdots \\ Y_n \end{pmatrix}, &\qquad&
\mathbf{Z} = \begin{pmatrix}
1 & X_{11} & \cdots & X_{(p-1)1} \\
1 & X_{12} & \cdots & X_{(p-1)2} \\
\vdots & \vdots & \ddots & \vdots \\
1 & X_{1n} & \cdots & X_{(p-1)n} \end{pmatrix}, \\
\mathbf{\beta} =\begin{pmatrix} \beta_0 \\ \beta_1 \\ \vdots \\ \beta_{p-1} \end{pmatrix}, &\qquad&
\mathbf{\epsilon} = \begin{pmatrix} \epsilon_1 \\ \epsilon_2 \\ \vdots \\ \epsilon_n \end{pmatrix},
\end{eqnarray*}\]
where
- \(\mathbf{Y}\) is an \(n \times 1\) column vector of observations of the response variable;
- \(\mathbf{Z}\) is the \(n \times p\) design matrix whose first column is a column of \(1\)’s, if there is a constant in the model. The other columns are the observations on the explanatory variables \((X_1,X_2,\dots,X_{p-1})\);
- \(\mathbf{\beta}\) is a \(p \times 1\) column vector of the unknown parameters;
- \(\mathbf{\epsilon}\) is an \(n \times 1\) column vector of the random error terms.
The general linear regression model assumes that \(E[\mathbf{\epsilon}]=\mathbf{0}\) and \(\text{Var}(\mathbf{\epsilon}) = \sigma^2 \mathbf{I}_n\).
Our aim is to estimate the unknown vector of parameters, \(\mathbf{\beta}\).
Least squares estimate
The least squares estimate of \(\mathbf{\beta}\) is
\[\mathbf{\hat{\beta}} =(\mathbf{Z}^T\mathbf{Z})^{-1} \mathbf{Z}^T\mathbf{y}.\]
The least squares estimator is the value of \(\mathbf{\beta}\) that minimises the model deviance \(D\). Consider
\[\begin{align*}
D &= \sum\limits_{i=1}^n (\mathbf{y}_i - (\mathbf{Z}\mathbf{\beta})_i)^2 \\[3pt]
&= (\mathbf{y} - \mathbf{Z} \mathbf{\beta})^T (\mathbf{y} - \mathbf{Z} \mathbf{\beta}) \\[3pt]
&= \mathbf{y}^T\mathbf{y} - \mathbf{y}^T\mathbf{Z}\mathbf{\beta} - \mathbf{\beta}^T\mathbf{Z}^T\mathbf{y} + \mathbf{\beta}^T\mathbf{Z}^T\mathbf{Z}\mathbf{\beta} \\[3pt]
&= \mathbf{y}^T\mathbf{y} - 2\mathbf{y}^T\mathbf{Z}\mathbf{\beta} + \mathbf{\beta}^T\mathbf{Z}^T\mathbf{Z}\mathbf{\beta}.
\end{align*}\]
Taking the derivative of \(D\) with respect to \(\mathbf{\beta}\) and noticing that \(\mathbf{Z}^T\mathbf{Z}\) is a symmetric matrix, we have that
\[\begin{align*}
\frac{\partial D}{\partial \mathbf{\beta}} &= (-2\mathbf{y}^T\mathbf{Z})^T + 2\mathbf{Z}^T\mathbf{Z}\mathbf{\beta} \\
&= -2\mathbf{Z}^T\mathbf{y} + 2\mathbf{Z}^T\mathbf{Z}\mathbf{\beta}.
\end{align*}\]
Therefore the least squares estimator \(\mathbf{\hat{\beta}}\) of \(\mathbf{\beta}\) will satisfy \(\mathbf{Z}^T\mathbf{Z}\mathbf{\hat{\beta}} =\mathbf{Z}^T\mathbf{y}\). This system of equations are the normal equations for the general linear regression model. To be able to isolate \(\mathbf{\hat{\beta}}\) it is necessary for \(\mathbf{Z}^T\mathbf{Z}\) to be invertible. Therefore we need \(\mathbf{Z}\) to be of full rank, that is, \(\text{rank}(\mathbf{Z})=p\). If \(\text{rank}(\mathbf{Z})=p\), then
\[ \mathbf{\hat{\beta}} = (\mathbf{Z}^T\mathbf{Z})^{-1} \mathbf{Z}^T\mathbf{y}.\]
We know that \(\mathbf{\hat{\beta}}\) minimising \(D\) is equivalent to the Hessian of \(D\) will be positive definite. If \(\mathbf{Z}\) has full rank, then since \(\mathbf{Z}^T\mathbf{Z}\) is a symmetric matrix, we have that
\[\begin{align*}
\mathbf{H} &= \frac{\partial^2 D}{\partial \mathbf{\beta}^2} \\[3pt]
&= (2\mathbf{Z}^T\mathbf{Z})^T \\[3pt]
&= 2\mathbf{Z}^T\mathbf{Z}.
\end{align*}\]
We know \(\mathbf{Z}^T\mathbf{Z}\) is positive definite and hence, \(\mathbf{\hat{\beta}}\) is the least squares estimator of \(\mathbf{\beta}\).
Let
\(\mathbf{\hat{y}} = \mathbf{Z}\mathbf{\hat{\beta}}\) be the
\(n \times 1\) vector of
fitted values of
\(\mathbf{y}\). Note that
\[\mathbf{\hat{y}} = \mathbf{Z} \mathbf{\hat{\beta}} = \mathbf{Z} (\mathbf{Z}^T\mathbf{Z})^{-1} \mathbf{Z}^T \mathbf{y}.\]
If we set \(\mathbf{P}=\mathbf{Z}(\mathbf{Z}^T\mathbf{Z})^{-1}\mathbf{Z}^T\), then we can write \[\mathbf{\hat{y}} = \mathbf{P} \mathbf{y}.\] The matrix \(\mathbf{P}\) is therefore often referred to as the hat matrix. Note that \(P\) is symmetric and idempotent because \(\mathbf{P}^T=\mathbf{P}\) and \(\mathbf{P}^2=\mathbf{P}\).
The residuals,
\(\epsilon\), satisfy
\[ \epsilon = \mathbf{y} - \hat{\mathbf{y}} = \mathbf{I}_n \mathbf{y} - \mathbf{P}\mathbf{y} = (\mathbf{I}_n - \mathbf{P})\mathbf{y}, \]
where \(\mathbf{I}_n\) is the \(n \times n\) identify matrix.
Therefore the sum of the square of the residuals is given by
\[\begin{eqnarray*} \sum_{i=1}^n \epsilon^2_i &=& (\mathbf{y} - \mathbf{Z} \mathbf{\hat{\beta}})^T(\mathbf{y} - \mathbf{Z} \mathbf{\hat{\beta}}) \\ &=& ((\mathbf{I}_n - \mathbf{P})\mathbf{y})^T (\mathbf{I}_n - \mathbf{P})\mathbf{y} \\ &=& \mathbf{y}^T (\mathbf{I}_n - \mathbf{P})^T (\mathbf{I}_n - \mathbf{P}) \mathbf{y}.
\end{eqnarray*}\]
The quantity
\[s^2 = \frac{1}{n-p} \sum_{i=1}^n \epsilon_i^2= \frac{1}{n-p}(\mathbf{y} - \mathbf{Z} \mathbf{\hat{\beta}})^T(\mathbf{y} - \mathbf{Z} \mathbf{\hat{\beta}})\]
is an unbiased estimator of \(\sigma^2\).
Note that to obtain an unbiased estimator of \(\sigma^2\), we divide the sum of the square of the residuals by \(n-p\). That is, the number of observations \((n)\) minus the number of parameters \((p)\) estimated in \(\beta\). This is in line with the divisor \(n-1\) in estimating the variance of a random variable \(X\) from data \(x_1, x_2, \ldots, x_n\) with \(\mu = E[X]\) (one parameter) estimated by \(\bar{x} = \frac{1}{n} \sum_{i=1}^n x_i\).
Examples
Suppose we have two observations such that
\[\begin{align*}
y_1 &= \theta + \epsilon, \\
y_2 &= 2\theta + \epsilon.
\end{align*}\]
Calculate the least squares estimator of \(\theta\).
Writing the given linear model in a matrix format, one obtains
\[ \mathbf{Z} = \begin{pmatrix} 1 \\ 2 \end{pmatrix}, \qquad \text{and} \qquad \mathbf{y} = \begin{pmatrix} y_1 \\ y_2 \end{pmatrix} \]
Then \((\mathbf{Z}^T\mathbf{Z})^{-1} = \frac{1}{5}\) and by applying Theorem 17.3.1 (Least squares estimate):
\[\hat{\theta} = (\mathbf{Z}^T\mathbf{Z})^{-1}\mathbf{Z}^T \mathbf{Y} = \frac{1}{5}(y_1 + 2y_2).\]
Simple Linear Regression
Consider the simple regression model,
\(y_i =a +b x_i + \epsilon\), for
\(i \in \{ 1,\ldots ,n \}\). Then in matrix terms
\(\mathbf{Y} = \mathbf{Z} \mathbf{\beta} + \mathbf{\epsilon}\) where,
\[\begin{align*}
\mathbf{Y} = \begin{pmatrix} y_1 \\ y_2 \\ \vdots \\ y_n \end{pmatrix}, &\quad& \mathbf{Z} = \begin{pmatrix} 1 & x_1 \\ 1 & x_2 \\ \vdots & \vdots \\ 1 & x_n \end{pmatrix}, \\[5pt]
\mathbf{\beta} = \begin{pmatrix} a \\ b \end{pmatrix}, &\quad& \mathbf{\epsilon} = \begin{pmatrix} \epsilon_1 \\ \epsilon_2 \\ \vdots \\ \epsilon_n \end{pmatrix}.
\end{align*}\]
Calculate the least squares estimator of \(\mathbf{\beta}\).
The least squares estimators of \(\mathbf{\beta}\) will be given by,
\[ \mathbf{\hat{\beta}} = (\mathbf{Z}^T\mathbf{Z})^{-1}\mathbf{Z}^T\mathbf{y},\]
where,
\[\begin{align*}
\mathbf{Z}^T\mathbf{Z} &= \begin{pmatrix} 1 & 1 & \cdots 1 \\ x_1 & x_2 & \cdots x_n \end{pmatrix} \begin{pmatrix} 1 & x_1 \\ 1 & x_2 \\ \vdots & \vdots \\ 1 & x_n \end{pmatrix} \\[5pt]
&=\begin{pmatrix} n & \sum\limits_{i=1}^n x_i \\ \sum\limits_{i=1}^n x_i & \sum\limits_{i=1}^n x_i^2 \end{pmatrix}, \\[5pt]
\mathbf{Z}^T \mathbf{y} &= \begin{pmatrix} \sum\limits_{i=1}^n y_i \\ \sum\limits_{i=1}^n x_iy_i \end{pmatrix}.
\end{align*}\]
Therefore, the inverse of
\(\mathbf{Z}^T\mathbf{Z}\) is
\[ \left( \mathbf{Z}^T\mathbf{Z} \right) ^{-1} = \frac{1}{\sum\limits_{i=1}^n (x_i-\bar{x})^2} \begin{pmatrix} \frac{1}{n} \sum\limits_{i=1}^{n} x_i^2 & -\bar{x} \\ -\bar{x} & 1 \end{pmatrix},\]
and so
\[\begin{align*}
\mathbf{\hat{\beta}} &= \left( \mathbf{Z}^T\mathbf{Z} \right) ^{-1}\mathbf{Z}^T\mathbf{y} \\[5pt]
&= \frac{1}{\sum\limits_{i=1}^n (x_i-\bar{x})^2} \begin{pmatrix} \frac{1}{n} \sum\limits_{i=1}^{n} x_i^2 & -\bar{x} \\ -\bar{x} & 1 \end{pmatrix} \begin{pmatrix} \sum\limits_{i=1}^n y_i \\ \sum\limits_{i=1}^n x_iy_i \end{pmatrix} \\[5pt]
&= \frac{1}{\sum\limits_{i=1}^{n} (x_i - \bar{x})^2} \begin{pmatrix} \frac{1}{n} \sum\limits_{i=1}^{n} x_i^2 \sum\limits_{i=1}^{n} y_i - \bar{x} \sum\limits_{i=1}^{n} x_i y_i \\ -\bar{x} \sum\limits_{i=1}^{n} y_i + \sum\limits_{i=1}^{n} x_i y_i \end{pmatrix} \\[5pt]
&= \frac{1}{\sum\limits_{i=1}^{n} (x_i - \bar{x})^2} \begin{pmatrix} \bar{y} \sum\limits_{i=1}^{n} x_i^2 - \bar{x} \sum\limits_{i=1}^{n} x_i y_i \\ \sum\limits_{i=1}^{n} y_i (x_i - \bar{x}) \end{pmatrix} \\[5pt]
&= \frac{1}{\sum\limits_{i=1}^{n} (x_i - \bar{x})^2} \begin{pmatrix} \bar{y} \sum\limits_{i=1}^{n} (x_i - \bar{x})^2 - \bar{x} \sum\limits_{i=1}^{n} (x_i - \bar{x})(y_i - \bar{y}) \\ \sum\limits_{i=1}^{n} (x_i - \bar{x})(y_i - \bar{y}) \end{pmatrix} \\[5pt]
&= \begin{pmatrix} \bar{y} - \bar{x} \frac{ \sum\limits_{i=1}^n (x_i - \bar{x})(y_i - \bar{y}) }{ \sum\limits_{i=1}^n (x_i - \bar{x})^2 } \\ \frac{ \sum\limits_{i=1}^n (x_i - \bar{x})(y_i - \bar{y}) }{ \sum\limits_{i=1}^n (x_i - \bar{x})^2 } \end{pmatrix}.
\end{align*}\]
So,
\[\begin{pmatrix} \hat{a} \\ \hat{b} \end{pmatrix} = \begin{pmatrix} \bar{y} - \hat{b} \bar{x} \\ \frac{s_{xy}}{s_x^2} \end{pmatrix}.\]
The least square estimates agree with the estimates we obtained in Section 16.6.
Properties of the estimator of \(\mathbf{\beta}\)
In this section we give a collection of results about the properties of the estimator of \(\mathbf{\beta}\). The properties are given with proofs. It is not important to know the proofs but to know what the key properties are and have an understanding of why they are important.
Unbiasedness of LSE
\(\mathbf{\hat{\beta}}\) is an unbiased estimator of \(\beta\).
Since \((\mathbf{Z}^T\mathbf{Z})^{-1}\mathbf{Z}^T\) is a constant,
\[\begin{align*}
E \left[ \mathbf{\hat{\beta}} \right] &= E \left[ (\mathbf{Z}^T\mathbf{Z})^{-1}\mathbf{Z}^T\mathbf{y} \right] \\
&= (\mathbf{Z}^T \mathbf{Z})^{-1} \mathbf{Z}^T E[\mathbf{y}].
\end{align*}\]
Substituting in \(\mathbf{Z}\mathbf{\beta} + \mathbf{\epsilon}\) for \(\mathbf{y}\)
\[\begin{align*}
E \left[ \mathbf{\hat{\beta}} \right]
&= (\mathbf{Z}^T \mathbf{Z})^{-1} \mathbf{Z}^T E[\mathbf{Z}\mathbf{\beta} + \mathbf{\epsilon}] \\
&= (\mathbf{Z}^T \mathbf{Z})^{-1} \mathbf{Z}^T (\mathbf{Z}\mathbf{\beta} + E[\mathbf{\epsilon}]) \\
&= (\mathbf{Z}^T \mathbf{Z})^{-1} \mathbf{Z}^T (\mathbf{Z}\mathbf{\beta} + \mathbf{0}) \\
&= \mathbf{I}_p \mathbf{\beta} \\
&= \mathbf{\beta}.
\end{align*}\]
Variance of LSE
The variance of \(\mathbf{\hat{\beta}}\) is given by
\[ \text{Var}(\mathbf{\hat{\beta}}) = \sigma^2 \left( \mathbf{Z}^T \mathbf{Z} \right)^{-1}. \]
Since for a constant matrix \(\mathbf{A}\), we have that \(\text{Var} (\mathbf{A} \mathbf{Y}) = \mathbf{A} \text{Var} ( \mathbf{Y}) \mathbf{A}^T\), it follows that
\[\begin{align*}
\text{Var}(\mathbf{\hat{\beta}}) &= \text{Var} \left( (\mathbf{Z}^T\mathbf{Z})^{-1} \mathbf{Z}^T \mathbf{y} \right) \\
&= (\mathbf{Z}^T \mathbf{Z})^{-1} \mathbf{Z}^T \text{Var}(\mathbf{y}) \left( (\mathbf{Z}^T \mathbf{Z})^{-1} \mathbf{Z}^T \right)^T
\end{align*}\]
Substituting in \(\mathbf{Z}\mathbf{\beta} + \mathbf{\epsilon}\) for \(\mathbf{y}\), and noting that \(\mathbf{Z}\mathbf{\beta}\) is a constant, we have that
\[\begin{align*}
\text{Var}(\mathbf{\hat{\beta}}) &= (\mathbf{Z}^T \mathbf{Z})^{-1} \mathbf{Z}^T \text{Var}(\mathbf{Z}\mathbf{\beta}+\mathbf{\epsilon}) \mathbf{Z}(\mathbf{Z}^T\mathbf{Z})^{-1} \\
&= (\mathbf{Z}^T \mathbf{Z})^{-1} \mathbf{Z}^T \text{Var}(\mathbf{\epsilon}) \mathbf{Z} (\mathbf{Z}^T\mathbf{Z})^{-1} \\
&= (\mathbf{Z}^T \mathbf{Z})^{-1} \mathbf{Z}^T \sigma^2 \mathbf{I}_n \mathbf{Z} (\mathbf{Z}^T\mathbf{Z})^{-1} \\
&= \sigma^2 (\mathbf{Z}^T \mathbf{Z})^{-1} \mathbf{Z}^T \mathbf{Z} (\mathbf{Z}^T\mathbf{Z})^{-1} \\
&= \sigma^2 (\mathbf{Z}^T \mathbf{Z})^{-1}.
\end{align*}\]
Note that \(\text{Var}(\mathbf{\hat{\beta}})\) is the \(p \times p\) variance-covariance matrix of the vector \(\mathbf{\hat{\beta}}\). Specifically the \(i^{th}\) diagonal entry is \(\text{Var}(\hat{\beta}_i)\) and the \((i,j)^{th}\) entry is \(\text{Cov}(\hat{\beta}_i,\hat{\beta}_j)\).
Uncertainty in simple linear regression
Consider the straight line model:
\[ y_i= \alpha + \beta x_i + \epsilon, \qquad \qquad i=1,2,\ldots, n, \]
where \(\epsilon \sim N(0,\sigma^2)\).
Watch Video 25 for a run through uncertainty in the estimates of the parameters of a simple linear regression model. A summary of the results are presented after the video.
Video 25: Uncertainty in simple linear regression
Then
\[ \mathbf{Z} = \begin{pmatrix} 1 & x_1 \\ 1 & x_2 \\ \vdots & \vdots \\ 1 & x_n \end{pmatrix}, \qquad \qquad \mathbf{\beta} = \begin{pmatrix} \alpha \\ \beta \end{pmatrix}.\]
We have shown in
Example 17.4.2 (Simple Linear Regression) that
\[ \left( \mathbf{Z}^T\mathbf{Z} \right)^{-1} = \frac{1}{ \sum\limits_{i=1}^n (x_i - \bar{x})^2 } \begin{pmatrix}
\frac{1}{n} \sum\limits_{i=1}^n x_i^2 & -\bar{x} \\
-\bar{x} & 1 \end{pmatrix}. \]
Therefore,
\[\begin{align*}
\text{Var} \left( \mathbf{\hat{\beta}} \right) &= \sigma^2 \left( \mathbf{Z}^T \mathbf{Z} \right)^{-1} \\
&= \frac{\sigma^2}{ \sum\limits_{i=1}^n (x_i - \bar{x})^2 } \begin{pmatrix} \frac{1}{n} \sum\limits_{i=1}^n x_i^2 & -\bar{x} \\ -\bar{x} & 1 \end{pmatrix},
\end{align*}\]
and so,
\[\begin{align*}
\text{Var}(\hat{\alpha}) &= \frac{ \sigma^2 \sum\limits_{i=1}^n x_i^2 }{ n \sum\limits_{i=1}^n (x_i-\bar{x})^2 }, \\[5pt]
\text{Var}(\hat{\beta}) &= \frac{\sigma^2}{ \sum\limits_{i=1}^n (x_i-\bar{x})^2 }, \\[5pt]
\text{Cov}(\hat{\alpha},\hat{\beta}) &= \frac{ - \sigma^2 \bar{x} }{ \sum\limits_{i=1}^n (x_i-\bar{x})^2 }.
\end{align*}\]
The variance of the \(\hat{\beta}\) does not depend on the values of \(\alpha\) and \(\beta\) but on \(\sigma^2\) (the variance of \(\epsilon\)) and the design matrix \(\mathbf{Z}\). This tells us that if we have input in choosing \(x_i\) (constructing the design matrix) then we can construct the design matrix to reduce the variance of the estimator. In particular, the larger \(\sum_{i=1}^n (x_i - \bar{x})^2\) (variability in the \(x_i\)s), the smaller the variance of the estimates. Note that there will often be scientific and practical reasons for choosing \(x_i\) within a given range.
Observe that the covariance between
\(\hat{\alpha}\) and
\(\hat{\beta}\) has the opposite sign to
\(\bar{x}\) and becomes larger as
\(|\bar{x}|\) increases. The correlation between
\(\hat{\alpha}\) and
\(\hat{\beta}\) is
\[ \text{Cor} (\hat{\alpha},\hat{\beta}) = \frac{\text{Cov}(\hat{\alpha},\hat{\beta})}{\sqrt{\text{Var}(\hat{\alpha}) \text{Var}(\hat{\beta})}}
= \frac{- \sqrt{n} \bar{x}}{\sqrt{\sum_{i=1}^n x_i^2}}. \]
The correlation in the estimates is larger, in absolute value, the larger \(\bar{x}^2\) is relative to \(\sum_{i=1}^n x_i^2\).
To illustrate the variability in
\(\hat{\beta}\) we use an example. Suppose that we have ten observations from the model:
\[ y = 2 + 0.6 x + \epsilon \]
where \(\epsilon \sim N(0,1)\) and for \(i=1,2,\ldots, 10\), \(x_i =i\).
Then
\[\begin{eqnarray*} \text{Var} (\hat{\beta}) &=& \frac{1}{\sum_{i=1}^n (x_i -\bar{x})^2} \begin{pmatrix} \frac{1}{n} \sum_{i=1}^n x_i^2 & - \bar{x} \\ -\bar{x} & 1
\end{pmatrix} \\ &=& \frac{1}{82.5} \begin{pmatrix} 38.5 & - 5.5 \\ -5.5 & 1
\end{pmatrix}\\ &=& \begin{pmatrix} 0.46667 & -0.06667 \\ -0.06667 & 0.01212
\end{pmatrix}
\end{eqnarray*}\]
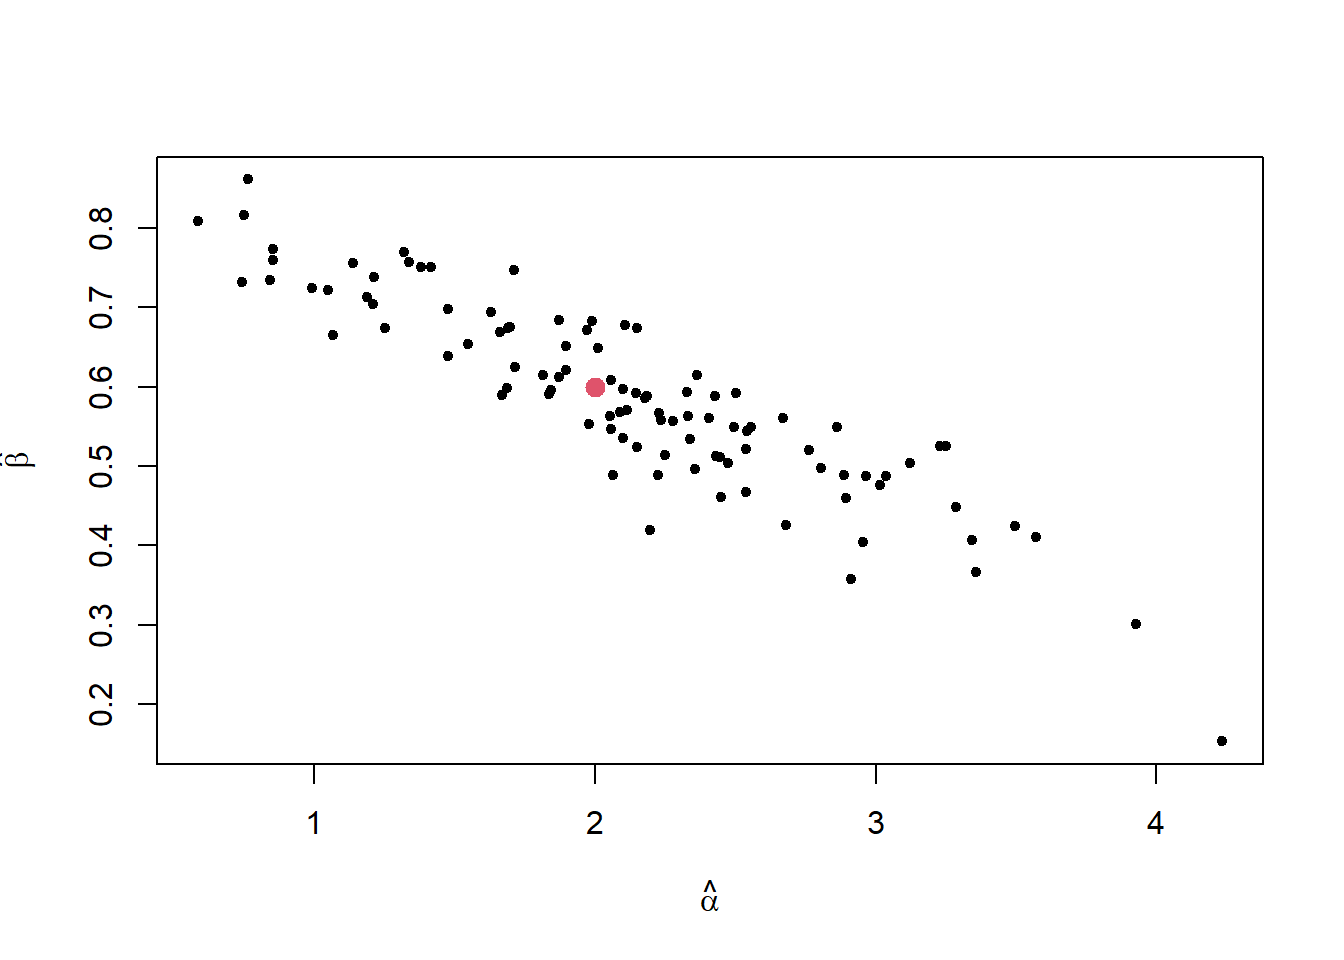
We simulated 100 sets of data from the model and for each set of data calculate \(\hat{\alpha}\) and \(\hat{\beta}\). In Figure 17.1, the estimates of \(\hat{\beta}\) against \(\hat{\alpha}\) are plotted along with the true parameter values \(\beta =0.6\) and \(\alpha =2\). The estimates show negative correlation.
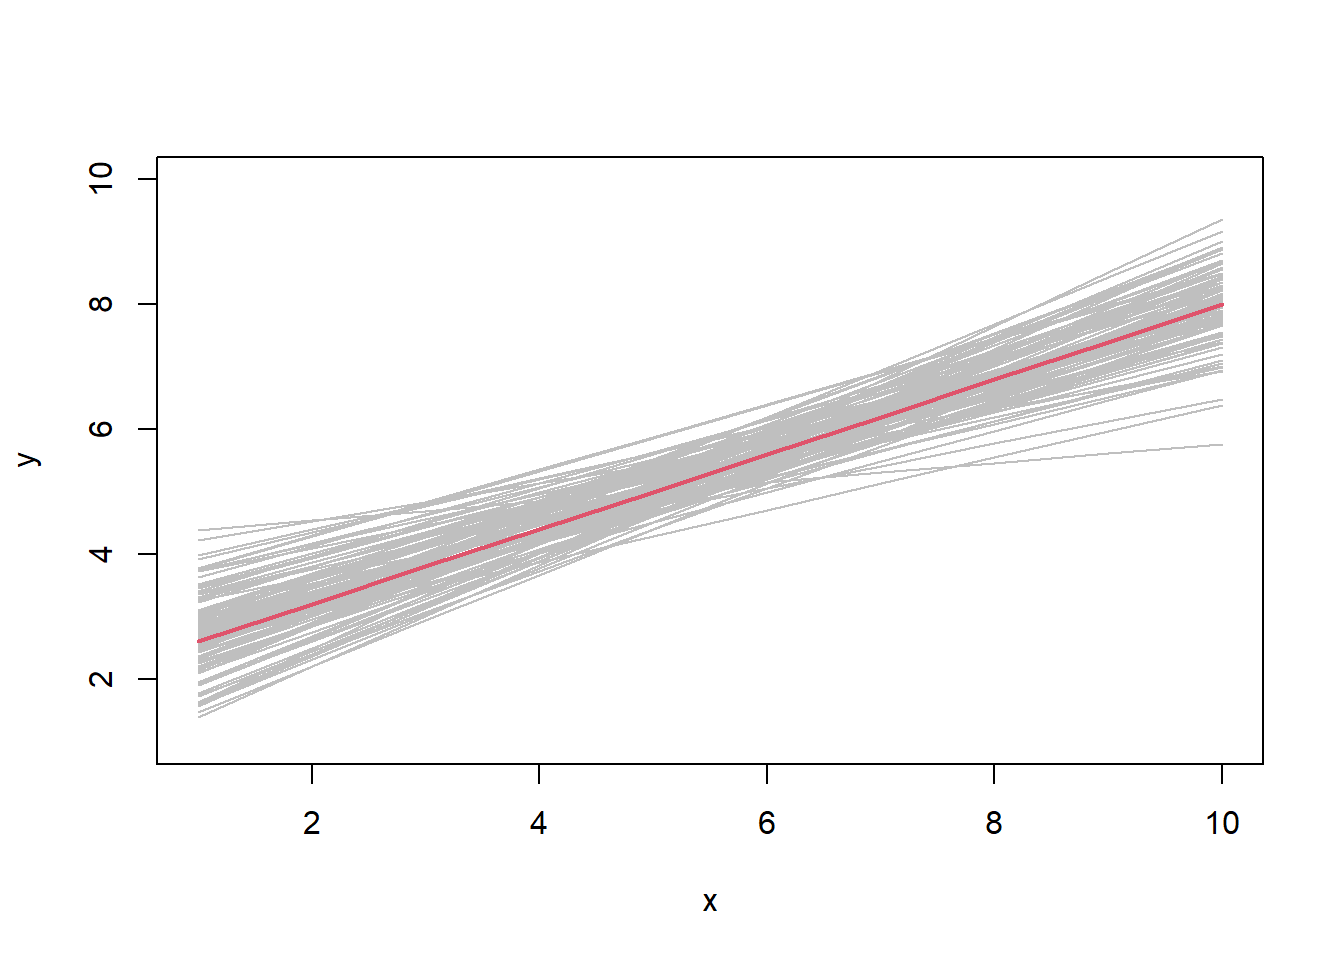
In Figure 17.2, the fitted line \(\hat{\alpha}+\hat{\beta} x\) is plotted for each simulated data set along with the true line \(2 + 0.6 x\). Observe that the lines with the highest intercepts tend to have the smallest slope and visa-versa. Also note that there is more variability in the estimated lines at the end points (\(x=1\) and \(x=10\)) rather than in the middle of the range (close to \(x=5.5\)).
Distribution of LSE
If additionally \(\mathbf{\epsilon} \sim N_n(\mathbf{0},\sigma^2 \mathbf{I}_n)\), then
\[\mathbf{\hat{\beta}} \sim N_p \left( \mathbf{\beta},\sigma^2(\mathbf{Z}^T\mathbf{Z})^{-1} \right).\]
Note,
\[\begin{align*}
\mathbf{\hat{\beta}} &= (\mathbf{Z}^T\mathbf{Z})^{-1} \mathbf{Z}^T\mathbf{y} \\
&= (\mathbf{Z}^T\mathbf{Z})^{-1} \mathbf{Z}^T (\mathbf{Z}\mathbf{\beta}+\mathbf{\epsilon}) \\
&= (\mathbf{Z}^T\mathbf{Z})^{-1} \mathbf{Z}^T\mathbf{Z}\mathbf{\beta} + (\mathbf{Z}^T\mathbf{Z})^{-1} \mathbf{Z}^T \mathbf{\epsilon} \\
&= \mathbf{\beta} + (\mathbf{Z}^T\mathbf{Z})^{-1} \mathbf{Z}^T \mathbf{\epsilon}.
\end{align*}\]
Hence \(\mathbf{\hat{\beta}}\) is a linear function of a normally distributed random variable. Using the identities \(E[A \mathbf{x} + b] = A E[\mathbf{x}] + b\) and \(\text{Var}(A \mathbf{x} + b) = A \text{Var}(\mathbf{x}) A^{T}\), consequently \(\mathbf{\hat{\beta}}\) has a normal distribution with mean and variance as required.
Note that since
\(\mathbf{\hat{\beta}} \sim N_p(\mathbf{\beta},\sigma^2(\mathbf{Z}^T\mathbf{Z})^{-1})\), then each of the individual parameters has a distribution
\[\hat{\beta}_i \sim N \left( \beta_i, \sigma^2 ((\mathbf{Z}^T\mathbf{Z})^{-1})_{ii} \right),\]
However the individual \(\hat{\beta}_i\) are not independent as we saw in Example 17.5.3 (Uncertainty in simple linear regression).
Gauss-Markov Theorem
The Gauss-Markov Theorem shows that a good choice of estimator for \(\mathbf{a}^T \beta\), a linear combination of the parameters, is \(\mathbf{a}^T\mathbf{\hat{\beta}}\).
Gauss-Markov Theorem
If \(\mathbf{\hat{\beta}}\) is the least squares estimator of \(\mathbf{\beta}\), then \(\mathbf{a}^T \mathbf{\hat{\beta}}\) is the unique linear unbiased estimator of \(\mathbf{a}^T\mathbf{\beta}\) with minimum variance.
The details of the proof of Theorem 17.6.1 (Gauss-Markov Theorem) are provided but can be omitted.
Proof of Gauss-Markov Theorem.
Consider \(\mathbf{\hat{\beta}} = (\mathbf{Z}^T\mathbf{Z})^{-1} \mathbf{Z}^T\mathbf{y}\), the LSE of \(\mathbf{\beta}\). Hence,
\[\mathbf{a}^T\mathbf{\hat{\beta}} = \mathbf{a}^T (\mathbf{Z}^T\mathbf{Z})^{-1} \mathbf{Z}^T \mathbf{y} = \mathbf{C}\mathbf{y},\]
where \(\mathbf{C} = \mathbf{a}^T(\mathbf{Z}^T\mathbf{Z})^{-1} \mathbf{Z}^T\). It follows that \(\mathbf{a}^T \mathbf{\hat{\beta}}\) is a linear function of \(\mathbf{y}\).
Note that
\(\mathbf{a}^T \mathbf{\hat{\beta}}\) is an unbiased estimator of
\(\mathbf{a}^T\mathbf{\beta}\) because,
\[\begin{align*}
E[\mathbf{a}^T \mathbf{\hat{\beta}}] &= E[\mathbf{C}\mathbf{y}] \\
&= \mathbf{C} E[\mathbf{Z} \mathbf{\beta} + \mathbf{\epsilon}] \\
&= \mathbf{C} \mathbf{Z} \mathbf{\beta} + \mathbf{C} E[\mathbf{\epsilon}] \\
&= \mathbf{a}^T(\mathbf{Z}^T\mathbf{Z})^{-1} \mathbf{Z}^T\mathbf{Z} \mathbf{\beta} + \mathbf{0} \\
&= \mathbf{a}^T\mathbf{\beta}.
\end{align*}\]
Suppose there exists another linear unbiased estimator of
\(\mathbf{a}^T\mathbf{\beta}\), denoted
\(\mathbf{b}^T\mathbf{y}\). By definition
\[E[\mathbf{b}^T\mathbf{y}] = \mathbf{a}^T \mathbf{\beta}.\]
However we can also calculate
\[\begin{align*}
E[\mathbf{b}^T\mathbf{y}] &= \mathbf{b}^T E[\mathbf{Z}\mathbf{\beta} + \mathbf{\epsilon}] \\
&= \mathbf{b}^T \mathbf{Z} \mathbf{\beta}.
\end{align*}\]
It follows that
\[\mathbf{b}^T \mathbf{Z} \mathbf{\beta} = \mathbf{a}^T \mathbf{\beta}, \qquad \text{for all } \mathbf{\beta},\]
so
\[\mathbf{a}^T = \mathbf{b}^T\mathbf{Z}.\]
Now
\[\begin{align*}
\text{Var}(\mathbf{b}^T\mathbf{y}) &= \mathbf{b}^T\text{Var}(\mathbf{Z}\mathbf{\beta}+\mathbf{\epsilon})\mathbf{b} \\
&= \mathbf{b}^T\text{Var}(\mathbf{\epsilon})\mathbf{b} \\
&= \mathbf{b}^T\sigma^2\mathbf{I}_n\mathbf{b} = \sigma^2 \mathbf{b}^T\mathbf{b},
\end{align*}\]
and
\[\begin{align*}
\text{Var}(\mathbf{a}^T\mathbf{\hat{\beta}}) &= \text{Var}(\mathbf{C}\mathbf{y}) \\
&= \mathbf{C}\text{Var}(\mathbf{Z}\mathbf{\beta}+\mathbf{\epsilon})\mathbf{C}^T \\
&= \mathbf{C}\text{Var}(\mathbf{\epsilon})\mathbf{C}^T \\
&= \mathbf{C} \sigma^2 \mathbf{I}_n \mathbf{C}^T \\
&= \sigma^2 \mathbf{C}\mathbf{C}^T \\
&= \sigma^2 (\mathbf{a}^T(\mathbf{Z}^T\mathbf{Z})^{-1}\mathbf{Z}^T) (\mathbf{a}^T(\mathbf{Z}^T\mathbf{Z})^{-1}\mathbf{Z}^T)^T \\
&= \sigma^2 \mathbf{a}^T(\mathbf{Z}^T\mathbf{Z})^{-1}\mathbf{Z}^T\mathbf{Z}(\mathbf{Z}^T\mathbf{Z})^{-1}\mathbf{a} \\
&= \sigma^2 \mathbf{a}^T(\mathbf{Z}^T\mathbf{Z})^{-1}\mathbf{a}.
\end{align*}\]
Substituting \(\mathbf{a}^T=\mathbf{b}^T\mathbf{Z}\), we can rewrite
\[\begin{eqnarray*}
\text{Var}(\mathbf{a}^T\mathbf{\hat{\beta}})
&=& \sigma^2 \mathbf{b}^T\mathbf{Z}(\mathbf{Z}^T\mathbf{Z})^{-1}(\mathbf{b}^T\mathbf{Z})^T \\
&=& \sigma^2 \mathbf{b}^T\mathbf{Z}(\mathbf{Z}^T\mathbf{Z})^{-1}\mathbf{Z}^T\mathbf{b} \\
&=& \sigma^2\mathbf{b}^T\mathbf{P}\mathbf{b}.
\end{eqnarray*}\]
Comparing
\(\text{Var}(\mathbf{b}^T\mathbf{y})\) and
\(\text{Var}(\mathbf{a}^T\mathbf{\hat{\beta}})\), we get
\[\begin{eqnarray*}
\text{Var}(\mathbf{b}^T\mathbf{y}) - \text{Var}(\mathbf{a}^T\mathbf{\hat{\beta}})
&=& \sigma^2 \mathbf{b}^T\mathbf{b} - \sigma^2 \mathbf{b}^T\mathbf{P}\mathbf{b} \\
&=& \sigma^2 \mathbf{b}^T (\mathbf{I}_n-\mathbf{P})\mathbf{b} \\
&=& \sigma^2 \mathbf{b}^T(\mathbf{I}_n-\mathbf{P})^2\mathbf{b} \\
&=& \sigma^2 \mathbf{b}^T(\mathbf{I}_n-\mathbf{P})^T (\mathbf{I}_n-\mathbf{P})\mathbf{b} \\
&=& \sigma^2 \mathbf{D}^T\mathbf{D},
\end{eqnarray*}\]
where
\(\mathbf{D} = (\mathbf{I}_n-\mathbf{P})\mathbf{b}\). Therefore,
\[\text{Var}(\mathbf{b}^T\mathbf{y})-\text{Var}(\mathbf{a}^T\mathbf{\hat{\beta}}) = \sigma^2 \mathbf{D}^T\mathbf{D} \geq 0, \]
so \(\mathbf{a}^T\mathbf{\hat{\beta}}\) has the smallest variance of any other linear unbiased estimator.
Finally suppose that
\(\mathbf{b}^T\mathbf{y}\) is another linear unbiased estimator such that
\(\text{Var}(\mathbf{b}^T\mathbf{y}) = \text{Var}(\mathbf{a}^T\mathbf{\hat{\beta}})\), then
\[\begin{align*}
\text{Var}(\mathbf{b}^T\mathbf{y}) - \text{Var}(\mathbf{a}^T\mathbf{\hat{\beta}}) &= \sigma^2 \mathbf{D}^T\mathbf{D}=0 \\
\implies \qquad \mathbf{D}&=\mathbf{0}
\end{align*}\]
Since
\(\mathbf{D}=(\mathbf{I}_n-\mathbf{P})\mathbf{b}=\mathbf{0}\), it follows that
\[\begin{align*}
\mathbf{b} &= \mathbf{P}\mathbf{b} \\
&= \mathbf{Z}(\mathbf{Z}^T\mathbf{Z})^{-1}\mathbf{Z}^T\mathbf{b} \\
&= \mathbf{Z}(\mathbf{Z}^T\mathbf{Z})^{-1}\mathbf{a} \\
\implies \qquad \mathbf{b}^T &= \mathbf{a}^T(\mathbf{Z}^T\mathbf{Z})^{-1}\mathbf{Z}^T,
\end{align*}\]
So
\[\begin{align*}
\mathbf{b}^T\mathbf{y} &= \mathbf{a}^T(\mathbf{Z}^T\mathbf{Z})^{-1}\mathbf{Z}^T\mathbf{y} \\
&=\mathbf{a}^T\mathbf{\hat{\beta}}.
\end{align*}\]
Therefore \(\mathbf{a}^T\mathbf{\hat{\beta}}\) is the unique linear unbiased estimator of \(\mathbf{a}^T\mathbf{\beta}\).
Best linear unbiased estimator (BLUE)
If \(\mathbf{a}^T=(0,0,\dots,1,0,\dots,0)\) where the \(1\) is in the \(i\)th position, then \(\hat{\beta}_i\) is the
best linear unbiased estimator, shorthand BLUE, of \(\beta_i\).
The following R shiny app generates data and fits a regression line, \(y = \alpha + \beta x\). It allows for variability in the coefficients and how the covariates \(x\) are generated. Predicted values can also be plotted with confidence intervals, see Section 18, Interval Estimation for an introduction to confidence intervals and Session 12: Linear Models II for a discussion of confidence intervals for predicted values.
R Shiny app: Linear Model
Student Exercises
Attempt the exercises below.
Suppose that a model states that
\[ E[Y_1] = \theta, \qquad E[Y_2] = 2 \theta - \phi, \qquad E[Y_3] = \theta + 2 \phi.\]
Find the least squares estimates of \(\theta\) and \(\phi\).
Solution to Exercise 17.1.
Using first principles, minimise
\[D= \sum_{i=1}^3 (y_i - E[y_i])^2 = (y_1 - \theta)^2 + (y_2 - 2\theta + \phi)^2 + (y_3 - \theta - 2 \phi)^2\]
by finding solutions to the normal equations,
\[\begin{eqnarray*}
\frac{\partial D}{\partial \theta} &=& 0 = -2(y_1 - \theta) -4(y_2 - 2\theta + \phi) -2(y_3 - \theta - 2 \phi), \\
\frac{\partial D}{\partial \phi} &=& 0 = 2(y_2 - 2\theta + \phi) -4(y_3 - \theta - 2 \phi).
\end{eqnarray*}\]
Solving for \(\theta, \phi\) gives
\[ \hat{\theta} = \frac{1}{6}(y_1 + 2y_2 + y_3), \qquad \hat{\phi} = \frac{1}{5}(2y_3 - y_2).\]
Note that generally if we have a linear model with \(p\) parameters \(\theta = (\theta_1,\theta_2, \ldots, \theta_p)\) and \(n\) observations \(y_1, y_2, \ldots, y_n\) with \(E[y_i] = \sum_{j=1}^p a_{ij} \theta_j\), then the least squares estimate of \(\theta_j\) \((j=1,2,\ldots, p)\) is
\[ \hat{\theta}_j = \frac{1}{\sum_{i=1}^n a_{ij}^2} \sum_{i=1}^n a_{ij} y_i. \]
The marks of 8 students are presented below. For student \(i\), \(x_i\) denotes their mark in a mid-term test and \(y_i\) denotes their mark in the final exam.
Mid-term test marks:
\[ \mathbf{x} = (x_1, x_2, \ldots, x_{8}) = ( 75, 68, 60, 58, 70, 67, 64, 65 ) \]
Final exam marks:
\[ \mathbf{y} = (y_1, y_2, \ldots, y_{8}) = ( 62, 54, 55, 43, 59, 59, 56, 50 ). \]
Note that:
\[\begin{eqnarray*}
\bar{x} &=& \frac{1}{8} \sum_{i=1}^{8} x_i = 65.875 \\
\bar{y} &=& \frac{1}{8} \sum_{i=1}^{8} y_i = 54.75 \\
s_{xy} &=& \frac{1}{8 -1} \left\{\sum_{i=1}^{8} x_iy_i - n \bar{x} \bar{y} \right\} = 25.679 \\
s_x^2 &=& \frac{1}{8 -1} \left\{\sum_{i=1}^{8} x_i^2 - n \bar{x}^2 \right\} = 29.554 \\
s_y^2 &=& \frac{1}{8 -1} \left\{\sum_{i=1}^{8} y_i^2 - n \bar{y}^2 \right\} = 35.929
\end{eqnarray*}\]
- Calculate the correlation between the mid-term test marks and the final exam marks.
- Fit a straight line linear model \(y = \alpha + \beta x + \epsilon\), where \(\epsilon \sim N(0,\sigma^2)\) with the final exam mark, \(y\), as the response and the mid-term test mark, \(x\), as the predictor variable. Include estimation of \(\sigma^2\) in the model fit.
- Find the expected final exam mark of a student who scores 79 in the mid-term test.
Solution to Exercise 17.2.
- The correlation between \(x\) and \(y\) is given by
\[ \frac{s_{xy}}{s_x \times s_y} = \frac{25.679}{\sqrt{29.554} \times \sqrt{35.929} } = 0.788 \]
- The coefficients of the linear regression model are:
\[\begin{eqnarray*}
\hat{\beta} &=& \frac{s_{x,y}}{s_x^2} = \frac{25.679}{29.554} = 0.869. \\
\hat{\alpha} &=& \bar{y} - \hat{\beta} \bar{x} = 54.75 - 0.869 \times 65.875 = -2.488.
\end{eqnarray*}\]
Since we have
\(p=2\) parameters (
\(\alpha\) and
\(\beta\)), an unbiased estimate of
\(\sigma^2\) is:
\[s^2 = \frac{1}{n-p} \sum_{i=1}^n (y_i - [\hat{\alpha} +\hat{\beta} x ])^2 = 15.886. \]
Thus the fitted model is:
\[ y = -2.488 + 0.869 x + \epsilon, \qquad \qquad \epsilon \sim N(0,15.886). \]
- The expected final exam mark of a student who scores 79 in the mid-term test is:
\[ y^\ast = -2.488 + 0.869 \times 79 = 66.163. \]