Chapter 7 Missing data Mechanisms
By evaluating the missing data patterns, we get insight in the location of the missing values. With respect to the missing data mechanism we are interested in the underlying reasons for the missing values and the relationships between variables with and without missing data. In 1976, Donald Rubin introduced a typology for missing data that distincts between random and non-random missing data situations, which are called Missing Completely At Random, Missing At Random and Missing Not At Random and abbreviated as MCAR, MAR and MNAR respectively (Rubin (1976)).
The key idea behind Rubin’s missing data mechanisms is that the probability of missing data in a variable may or may not be related to the values of other measured variables in the dataset. With probability we loosely mean the likelihood of a missing value to occur, i.e. if a variable has a lot of missing data, the probability of missing data in that variable is high. This probability can be related to other measured or not-measured variables. For example, when mostly older people have missing values, the probability for missing data is related to age. Moreover, the missing data mechanisms also assume a certain relationship (or correlation) between observed variables and variables with missing values in the dataset.
7.1 Missing Completely At Random
Data are Missing Completely At Random (MCAR) when the probability that a value is missing, is unrelated to the value of other observed (or unobserved) variables, and unrelated to values of the missing data variable itself. An MCAR example could be that, low back pain patients had to come to a research center to determine their level of disability by performing some physical tests and some of these patients were unable to leave their home, due to the flu. There is no assumed relationship between having the flu and scores on the disability variable which makes that this data is MCAR.
An MCAR missing data situation for the disability variable is visualized in the MCAR column in Figure 2.7 below. Note that in real live we do not know the completely observed data, but for educational reasons, the completely observed values of the disability variable are displayed as well. We can observe that in the MCAR situation an equal number of lower and higher values of the disability variable are missing (in total 4 disability scores are missing, 2 for lower and 2 for higher values). Also, the missing data in the disability variable do not seem to be related to the values of another variable like pain; an equal number of disability values is missing for patients with low pain scores as well as for patients with higher pain scores.
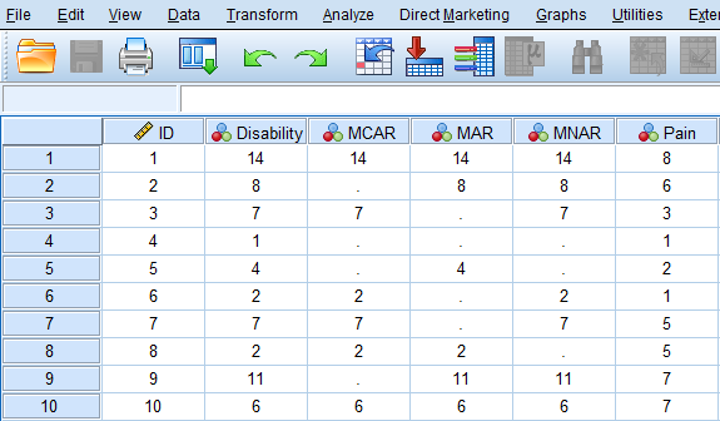
Figure 7.1: Examples of MCAR, MAR and MNAR data.
7.2 Missing At Random
Data are Missing At Random (MAR) when the probability that a value for a variable is missing is related to other observed values in the dataset but not to the variable itself. An example of MAR data is presented in the MAR column of Figure 7.1. Now 4 disability scores are missing for pain scores that are ≤ 5. In other words the probability of missing data in the disability variable is higher for patients with lower pain scores. However, MAR also assumes that within the category of pain scores with values ≤ 5, the disability scores are MCAR, because disability scores are randomly missing for lower and higher values within that category. As a consequence, means and standard deviations do not differ between the observed and missing data for the disability variable. An explanation could be that patients with lower pain scores that were assessed by questionnaires that were filled in at home were less likely to visit the research center to determine their level of disability because they thought that information about their level of disability was not of interest anymore.
7.3 Missing Not At Random
The data are MNAR when the probability of missing data in a variable is related to the scores of that variable itself, e.g. mostly high or low scores are missing. In low back pain patients, MNAR data can occur when patients with the highest scores on the disability variable have missing disability values. This is shown in the MNAR column of Figure 7.1. An explanation could be that these patients were not able to visit the research center due to their high level of disability.
MNAR missing data can also occur indirectly through the relationship of the variable with missing data with another variable that is not available in the dataset. For example, it could also be that patients with a high level of disability also have a high fear of moving their back, and for that reason will not visit the research center. In case of a positive relationship between disability and fear of movement, the highest values on the disability variable are than missing. If fear of movement is not measured in the study, the missing data in the disability variable is called MNAR.
The difference with MAR is that with MNAR, the missing data problem cannot be handled by using a technique as Multiple Imputation. However, as with MAR data, MNAR data can also not be verified because for that information about the missing values is needed.
References
Rubin, D. B. 1976. “Inference and Missing Data.” Biometrika 63 (3): 581–90.