Case Study 4
The case study below uses a data set from Laerd and a second modified version. The first data set passes the chi-square test of homogeneity requirements. The second (in parentheses), fails the n-sizes test.
A researcher recruits 100 (50) patients who have a “high” classification of cholesterol and who currently have a poor lifestyle. The researcher randomly assigns 50 (25) of them to a drug intervention and 50 (25) to a lifestyle intervention. After six months, a doctor reclassifies the patients as either still having a “high” classification of cholesterol or now having a “normal” classification of cholesterol.
The chi-sq data set has the following summary statistics.
Data | intervention | High | Normal | Total |
|---|---|---|---|---|
Observed | Drug | 18 (36%) | 32 (64%) | 50 (100%) |
Lifestyle | 33 (66%) | 17 (34%) | 50 (100%) | |
Total | 51 (51%) | 49 (49%) | 100 (100%) | |
Expected | Drug | 25.5 (51%) | 24.5 (49%) | 50 (100%) |
Lifestyle | 25.5 (51%) | 24.5 (49%) | 50 (100%) | |
Total | 51.0 (51%) | 49.0 (49%) | 100 (100%) |
The Fisher data set has the following summary statistics.
Data | intervention | High | Normal | Total |
|---|---|---|---|---|
Observed | Drug | 9 (36%) | 16 (64%) | 25 (100%) |
Lifestyle | 16 (64%) | 9 (36%) | 25 (100%) | |
Total | 25 (50%) | 25 (50%) | 50 (100%) | |
Expected | Drug | 12.5 (50%) | 12.5 (50%) | 25 (100%) |
Lifestyle | 12.5 (50%) | 12.5 (50%) | 25 (100%) | |
Total | 25.0 (50%) | 25.0 (50%) | 50 (100%) |
Conditions
n-Size
The chi-square test of homogeneity applies with the CLT conditions hold.
- the sample is independently drawn,
- there are at least 5 successes (Normal) and failures (High) for each group \(i\),
- the sample sizes for both groups are >=30, and
- the probability of success for each group is not extreme, \(0.2 < \pi_i < 0.8\).
The conditions hold for the chi-sq data set, but not for the Fisher data set.
Test
Chi-Square
(ind_discrete$chisq_test <- ind_discrete$chisq_dat %>%
  tabyl(intervention, risk_level) %>%
  chisq.test(correct = FALSE))
##
## Pearson's Chi-squared test
##
## data: .
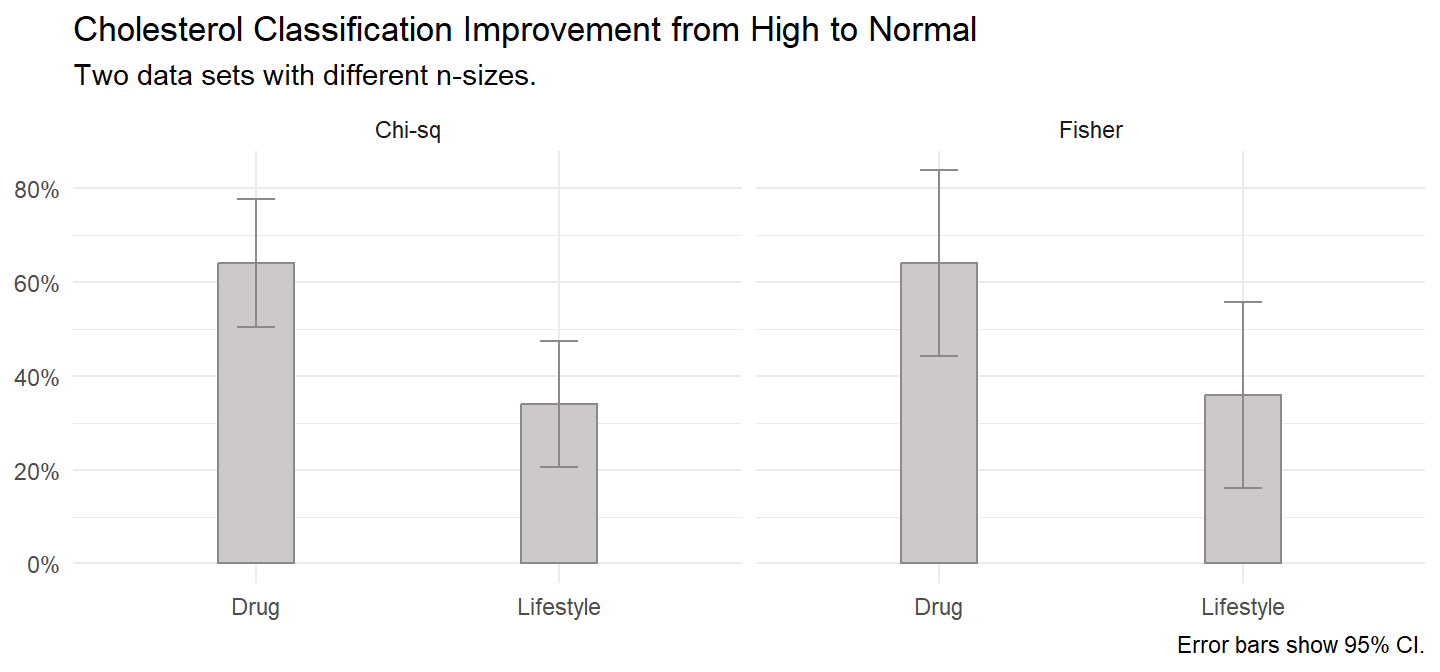
## X-squared = 9.0036, df = 1, p-value = 0.002694100 patients with a high cholesterol classification were randomly assigned to either a drug or lifestyle intervention, 50 in each intervention. The test of two proportions used was the chi-square test of homogeneity. At the conclusion of the drug intervention, 32 patients (64%) had improved their cholesterol classification from high to normal compared to 17 patients (34%) in the lifestyle intervention, a difference in proportions of 0.30, p = 0.0027.
Fisher
(ind_discrete$fisher_test <- ind_discrete$fisher_dat %>%
  tabyl(intervention, risk_level) %>%
  fisher.test())
##
## Fisher's Exact Test for Count Data
##
## data: .
## p-value = 0.08874
## alternative hypothesis: true odds ratio is not equal to 1
## 95 percent confidence interval:
## 0.08497039 1.15362199
## sample estimates:
## odds ratio
## 0.324195250 patients with a high cholesterol classification were randomly assigned to either a drug or lifestyle intervention, 25 in each intervention. At the conclusion of the drug intervention, 16 patients (64%) had improved their cholesterol classification from high to normal compared to 9 patients (36%) in the lifestyle intervention. Due to small sample sizes, Fisher’s exact test was run. There was a non-statistically significant difference in proportions of 0.28, p = 0.0887.