9 Assignment: Show and tell
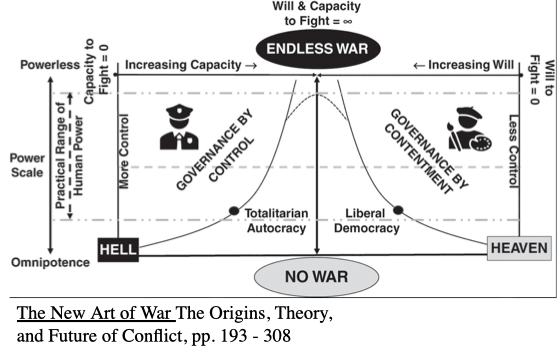
In the second half of this class, you will be asked to find an example of an especially good or bad data visualization, and present it to the class in about 5 minutes. Please explain why you like / hate this visualization, and we will have a short group critique. You can find it on the internet, in a book, or in a journal article.
If it is in a book, send it to me as a 1-slide powerpoint. If you’ve found an interactive web vizualization, please just send me the link. Submission is due at noon on the day of your presentation.
